| Oracle® Fusion Middleware Administrator's Guide for Oracle Portal 11g Release 1 (11.1.1) Part Number E10239-02 |
|
|
View PDF |
| Oracle® Fusion Middleware Administrator's Guide for Oracle Portal 11g Release 1 (11.1.1) Part Number E10239-02 |
|
|
View PDF |
This chapter provides information about the monitoring and administration tools that are available, and how to use them to successfully monitor and administer Oracle Portal.
You can monitor and administer Oracle Portal through Oracle Enterprise Manager 11g Fusion Middleware Control. Additionally, you can view Oracle Portal Analytics to monitor Oracle Portal performance and analyze Oracle Portal access characteristics.
You can also configure the Oracle Portal using WLST, see Section 5.1.2.2, "WebLogic ScriptingTool (WLST) Command-line Utility".
See Also:
For additional Oracle Portal monitoring and administration information, see the Oracle Portal Administration page on the Oracle Technology Network (OTN), athttp://www.oracle.com/technology/products/ias/portal/index.html.This chapter contains the following sections:
Using Oracle Enterprise Manager 11g Fusion Middleware Control
Using Fusion Middleware Control to Monitor and Administer Oracle Portal
Oracle Enterprise Manager 11g Fusion Middleware Control is included when you install Oracle Portal. From Oracle Portal's perspective, consider this to be the administration console for Oracle Portal. In the Oracle Enterprise Console you can:
Administer clusters
Start and stop services
View logs and ports
Perform real-time monitoring
Accessing Oracle Enterprise Manager 11g Fusion Middleware Control
You can access by navigating to the following URL: http://<hostname.domain>:<port>/em. For example, http://myhost.mycompany.com:7001/em.
Your start page for Fusion Middleware Control is the Farm home page. This page contains an Application Deployments page and a Fusion Middleware page indicating the status of the farm's system components. From these portlets, you can display the home page for each component of the Oracle Fusion Middleware for monitoring and administrative purposes.
If Oracle Portal is configured, it will appear in the Fusion Middleware portlet under Portal: <portal (WLS_PORTAL)>.
To monitor and administer Oracle Portal, in the Oracle Fusion Middleware home page under Portal, click on the portal J2EE application name. This also displays the WebLogic Container name besides the Portal application, which allows you to locate a specific portal application, running in a specific WebLogic container. The WLS_PORTAL is the container for portal servlets, and not the actual portal servlet to monitor.
Fusion Middleware Control displays a lot of useful metrics for Portal, when this metrics are displayed in tabular format, they allow sorting of metric rows in ascending or descending order and allowing you to find highest and lowest values easily.
Figure 8-1 shows the Oracle Portal Home page, the main page for monitoring Oracle Portal, and from which you access Portal's configuration, logging, and metrics pages, and Portal components.
Figure 8-1 Oracle Fusion Middleware Control - Oracle Portal Home Page
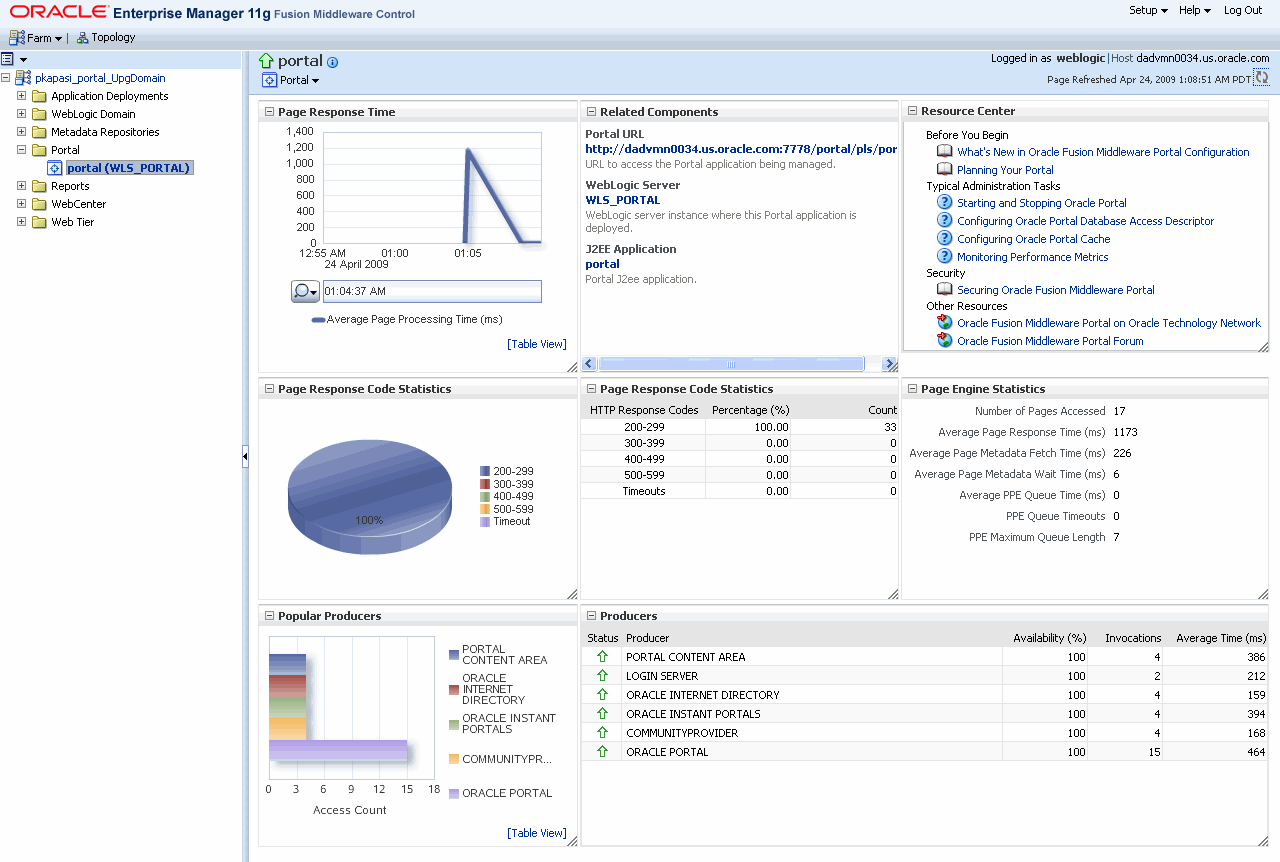
The Oracle Portal home page, shown in Figure 8-1, displays various portlets which are described in the following sections:
The Page Response Time portlet, as shown in Figure 8-2, shows a graphical representation of the average time in milliseconds that the Parallel Page Engine takes to generate a page.
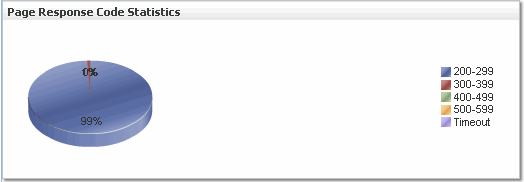
The Page Response Codes Statistics Portlet, shown in Figure 8-3, provides statistics about HTTP response codes generated by Portal's Parallel Page Engine (PPE). Typically, HTTP-2xx and HTTP-3xx status codes mean successful responses.
Figure 8-3 Page Response Codes Statistics Portlet
The Popular Producers portlet, as shown in Figure 8-4, provides a graphical view of the relative popularity of producers based on access counts.
The Related Component portlet lists the Oracle Fusion Middleware components used by Oracle Portal. You can drill down and find more information about individual Oracle Fusion Middleware components, by clicking on a link. The listed components are:
Clicking the Portal URL takes you to the Welcome page for the currently configured Oracle Portal.
Clicking the WebLogic Server (domain name) link, in the Related Components portlet, takes you to the Oracle WebLogic Server Domain home page for the WLS instance associated with the currently configured Oracle Portal. This is the starting point for managing and monitoring the WLS instance associated with the Oracle Portal. For example, you can restart the WLS instance from here. All configuration changes require a restart of the WebLogic Server running on Portal, and the WebLogic Server (domain name) link provides quick access to perform such an operation.
Clicking the J2EE Application link, in the Related Components portlets, takes you to the Application Deployment home page for the instance associated with the currently configured Oracle Portal. Here you can do the following:
Start, restart, and shutdown the application.
View and configure log files. You can also access the log files from the Portal menu.
Undeploy and redeploy the application.
Configure security policies and roles.
The Producers portlet, as shown in Figure 8-5, lists Portal producers, their status, and metrics. The status of Producers is shown to be Up when none of the portlets' last response codes indicated a failure. The status appears Down if the last response code for at least one portlet indicates a failure.
Metrics you can monitor include:
Status - Indicates whether a specific producer's portlet is Up or Down.
Availability - The percentage of requests that got an HTTP-2xx response from a producer.
Invocations - The number of times a producer's portlet was invoked.
Average - The average time (in milliseconds) to request a producer's portlet.
The resource Center portlet, as shown in Figure 8-6, provides links to general information about using Oracle Fusion Middleware Control to configure Oracle Portal, links to procedures for common administrative tasks, and links to other useful sites.
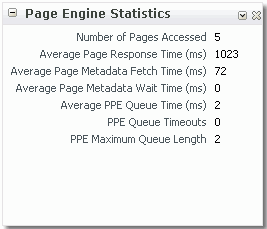
The Page Engine Statistics Portlet, shown in Figure 8-7, shows average response times, page access counts, page metadata metrics and Queue statistics for the Parallel Page Engine.
Figure 8-7 Page Engine Statistics Portlet
From the Oracle Portal home page you can also start and stop Oracle Portal and the Portal's J2EE applications, and access Portal's configuration, log, and metrics pages:
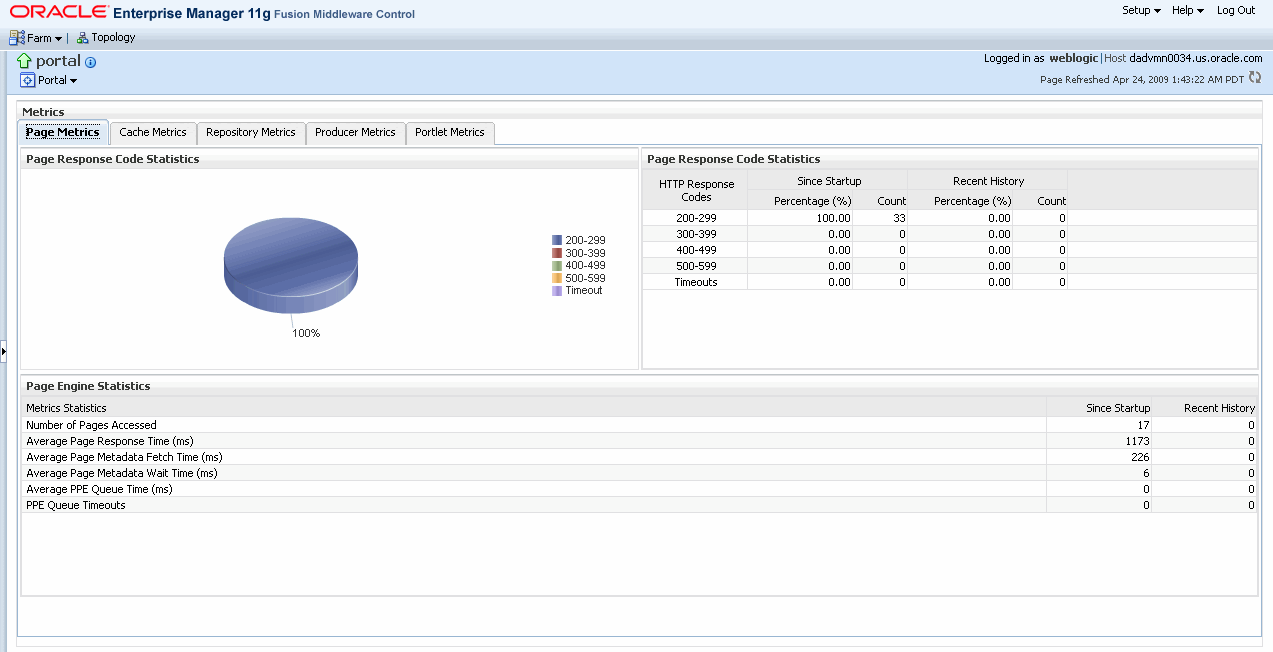
Use the Performance Metrics page to display Oracle Portal metrics or other metrics for the Oracle Fusion Middleware Farm and Farm components. From the Portal home page's Portal menu, click Monitoring > Performance Metrics to display the Performance Metrics page shown in Figure 8-8.
Figure 8-8 Oracle Fusion Middleware - Performance Metrics Page
Overview of Metric Collection: Recent History and Since Startup
Performance metrics are automatically enabled for Oracle Portal. In other words, you do not need to set options or perform any extra configuration to collect performance metrics. If you encounter a problem, such as an application that is running slowly or is hanging, you can view particular metrics to find out more information about the problem. Fusion Middleware Control provides real-time data.
The following types of metrics are available for Oracle Portal:
Since Startup: At any given time, real-time metrics are available for the duration for which the WebLogic Server hosting Portal applications was up and running. The real-time metrics that are collected or aggregated since the startup of the container are displayed for Portal as Since Startup. These metrics provide data aggregated over the life time of the WebLogic Server, and therefore, these are very useful.
Note:
Metric collection starts afresh after the Fusion Middleware components are restarted. Data collected prior to the restart is no longer available.Recent History: In addition to the Since Startup metrics, Oracle Portal metrics are also configured to capture the performance data every five minutes. This metric data is used in conjunction with the Since Startup metrics and is made available as Recent History metrics. All metrics seen under Recent History are calculated using just the recent metrics. For example, if a service was used for a short time, but it was not accessed at all for the last 15 minutes, then the Since Startup metrics for the service shows numbers greater than 0, whilst the Recent History metrics for that service are all zero. The Recent History metrics enable you to assess real-time performance of a live site based on data collected just from recent runtime access.
Typically, Recent History metrics shows data for the immediate last 10-15 minutes of data. However, there are scenarios when the data is not for the last 10-15 minutes:
If the WebLogic Server has just been started up, and has been running for less than 10-15 minutes, then Recent History shows data for the duration for which the server has been up and running.
Metric collection stops temporarily if no metric requests are detected over a long period of time. The collection restarts when the client next requests metrics. If metric collection has stopped, then Recent History initially shows data for the period since metric collection has stopped. As soon as the metric collection starts again, the data starts displaying.
While diagnosing a live site, navigate to the Portal metric pages and see the Services Summary section to identify services that are actively used and/or are taking longer than expected. Click the Refresh icon next to the time stamp to refresh metrics with live data. Then, click the particular service and repeat these steps to determine which specific operation in the service is taking long. If needed, navigate to application pages that use the service and set the application to trigger the runtime metrics to get more data.
The Performance Metrics page is divided into the following four tabs:
For more information, refer to the Enterprise Manager Online Help.
Page Metrics Tab
The Page Metrics tab (shown in Figure 8-8) gives the following information:
Provides statistics on the percentage of HTTP Response Codes generated by the PPE.
Page Engine Statistics like number of pages accessed, average page response time per milliseconds, process requests, since startup and recent history.
Cache Metrics Tab
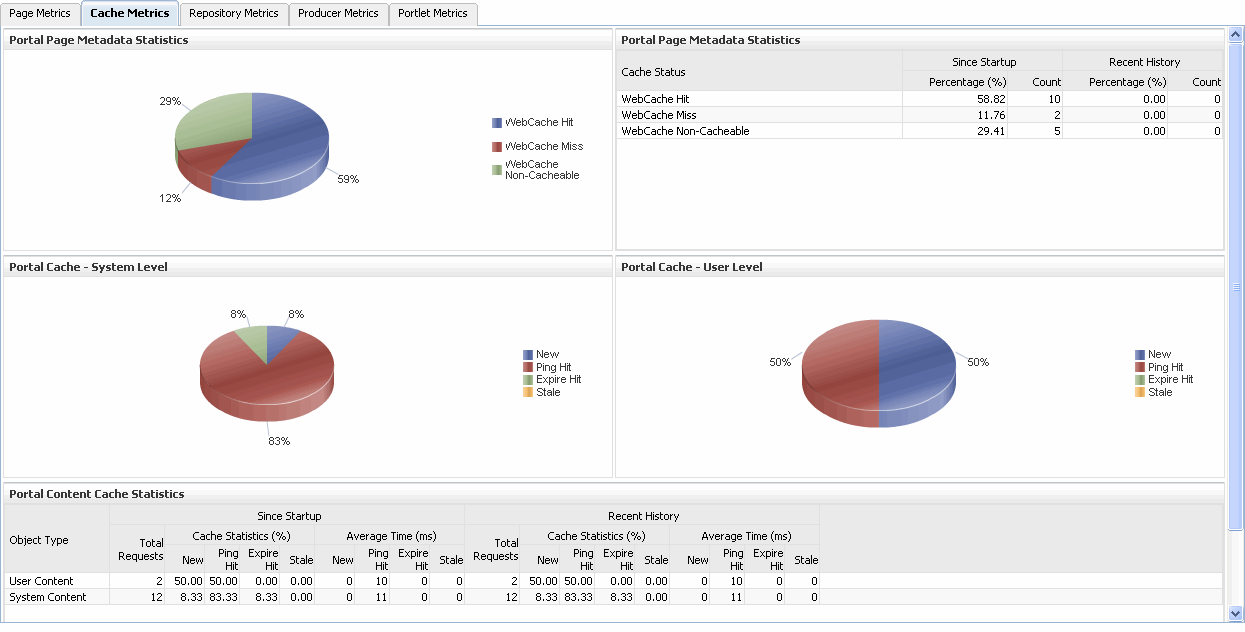
The Cache Metrics tab (shown in Figure 8-9) contains three portlets that display connection pool and Portal cache statistics.
Figure 8-9 Oracle Fusion Middleware - Cache Metrics Tab
Repository Metrics Tab
Repository Metrics tab (shown in Figure 8-10) shows metrics for the Portal database repository requests, such as repository response code statistics and database connection pool.
Figure 8-10 Oracle Fusion Middleware - Repository Metrics Tab
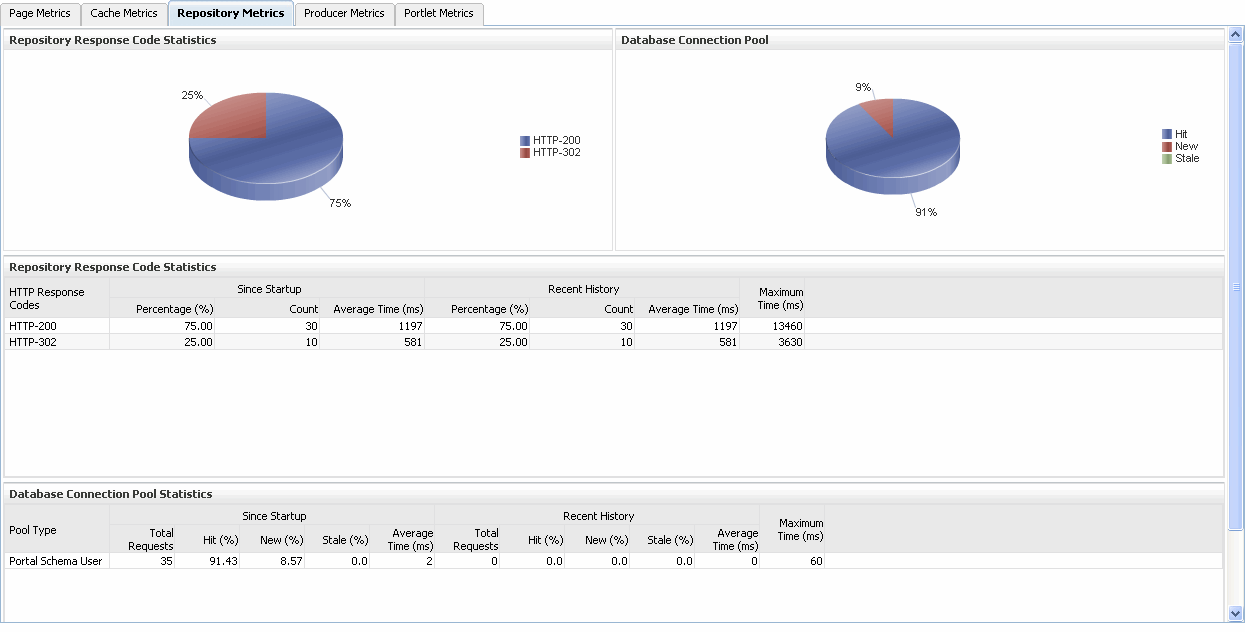
Database Connection Pool: Shows the status of the database connection pool.
The Repository Response Code Statistics portlet gives the following information:
The type of type HTTP response code.
The number of invocations in percentage and count, by the HTTP response code, since startup and last 15 minutes.
A HTTP-2xx and HTTP-3xx status codes typically mean successful responses.
A HTTP-499 is a special code which means that the requested resource is protected and you need a login access.
A HTTP-470 means that a logout operation has been performed.
The average time each HTTP response code takes to process requests, since startup and recent history.
The maximum time taken to process HTTP requests.
Producer Metrics Tab
The Producer Metrics tab (shown in Figure 8-11) contains three portlets that display the most popular producers based on access counts, their response times and a table containing data for all the producers.
Figure 8-11 Oracle Fusion Middleware - Producer Metrics Tab
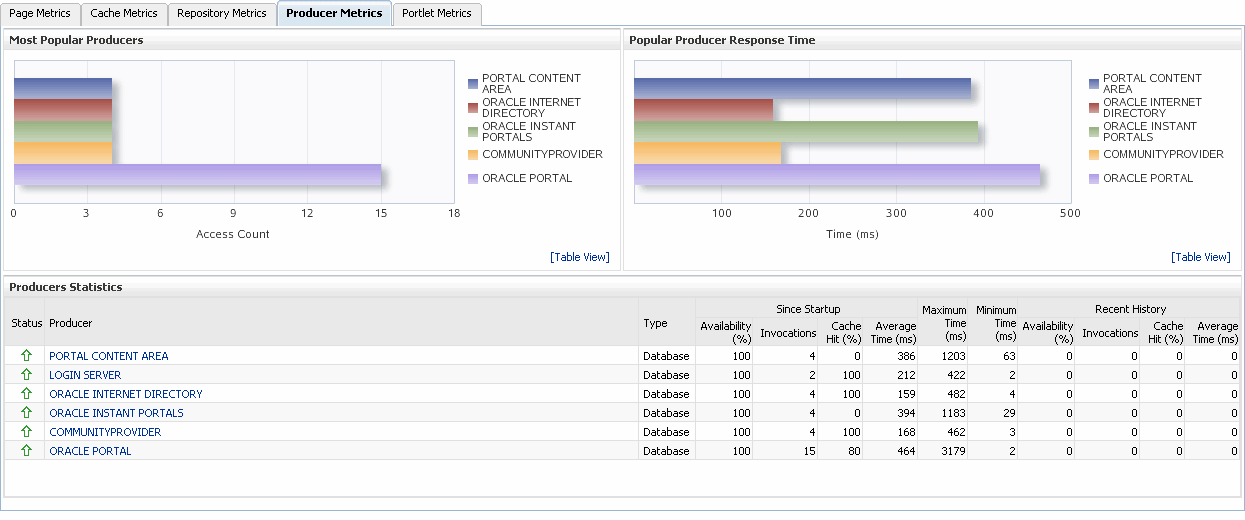
The Most Popular Producers portlet gives the following information:
The number of invocations per producer (displayed on a chart).
The highest value on the chart indicates which portlet producer is used the most and the lowest value indicates which portlet producer is used the least.
The Popular Producer Response Time gives the following information:
The average time each portlet producer takes to process producer requests since the Portal application started up (displayed on a chart).
The highest value on the chart indicates the worst performing portlet producer and the lowest value indicates which portlet producer is performing the best.
The Producer Statistics portlet gives the following information:
The name of the portlet producer being monitored:
Click the name of a portlet producer to view more information about each portlet that the application uses.
The current status of each portlet producer:
Up (Green Up Arrow) indicates that the portlet producer is up and running and Down (Red Down Arrow) indicates that the portlet producer is currently unavailable. The producer instance might be down, or there could be some network connectivity issues.
The percentage of producer invocations that succeeded, since startup and recent history.
The number of invocations, for each producer, since startup and recent history.
The percentage of cache hits, since startup and recent history.
By sorting the Average Time (ms) table, you can find the most frequently accessed portlet producer in your Portal application and the average time each portlet producer takes to process producer requests, regardless of the result, since startup and recent history. Use this metric to detect non-performant portlet producers. If you use this metric in conjunction with the Invocations metric, then you can prioritize which producer to focus on.
The maximum and minimum time taken to process producer requests.
Portlet Metrics Tab
The Portlet Metrics tab (shown in Figure 8-15) contains three portlets that display the most popular portlets based on access counts, portlet response times and other portlet metrics.
Figure 8-12 Oracle Fusion Middleware - Producer Metrics Tab
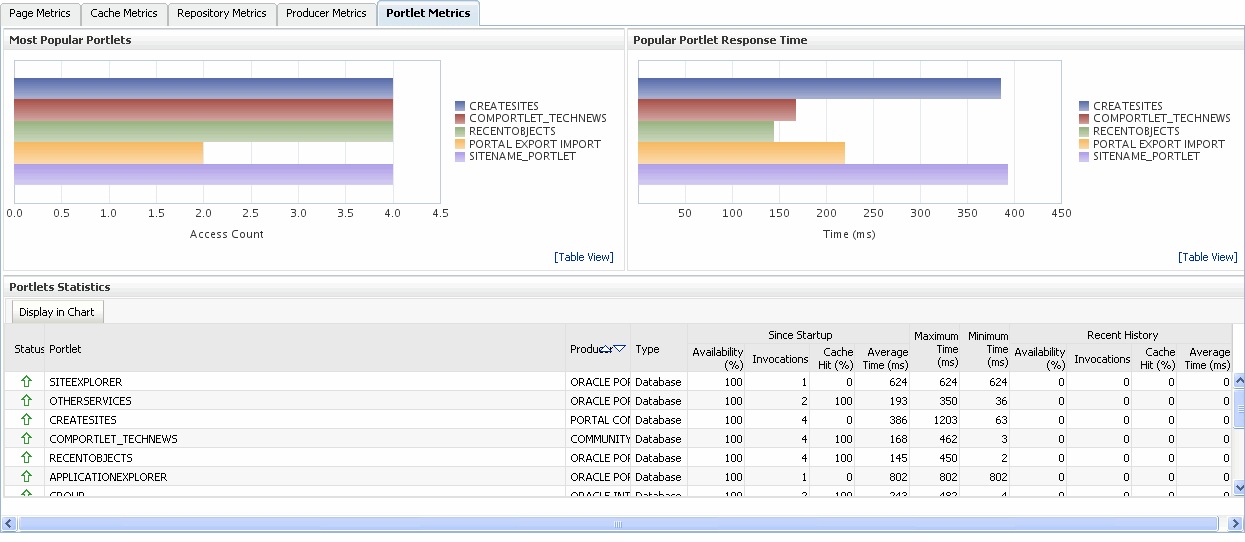
The Most Popular Portlets portlet gives the following information:
The number of invocations per portlet (displayed on a chart).
The highest value on the chart indicates which portlet is used the most and the lowest value indicates which portlet is used the least.
The Popular Portlet Response Time gives the following information:
The average time each portlet takes to process requests since the the Portal application started up (displayed on a chart).
The lowest value on the chart indicates which portlet is performing the best.
The highest value indicates the worst performing portlet.
The Portlet Statistics portlet gives the following information:
The current status of each portlet.
Up (Green Up Arrow) indicates that portlet is up and running and Down (Red Down Arrow) indicates that the portlet is currently unavailable. The producer instance might be down, or there could be some network connectivity issues.
The name of the portlet being monitored.
The name of the portlet producer through which the portlet is accessed.
The portlet producer type: Web, or WSRP.
Web portlet producer - deployed to a J2EE application server, which is often remote and communicates through Simple Object Access Protocol (SOAP) over HTTP.
WSRP portlet producer - Web Services for Remote Portlets (WSRP) is a Web services standard that allows interoperability between a standards enabled container and any WSRP application.
The percentage of producer invocations that succeeded, since startup and recent history. If Successful Invocations (%) is below 100%, check the diagnostic logs to establish why service requests are failing.
The number of invocations, per producer, since startup and recent history.
The percentage of cache hits, since startup and recent history.
By sorting the Average Time (ms) table, you can find the most frequently accessed portlet in your Portal application and the average time each portlet takes to process requests, regardless of the result, since startup and last 15 minutes. Use this metric to detect non-preforming portlet. If you use this metric in conjunction with the Invocations metric, then you can prioritize which portlet to focus on.
The maximum and minimum time taken to process portlet requests.
Use the Performance Summary page to display metrics for Oracle Portal and Oracle Portal components. Oracle Fusion Middleware automatically and continuously measures run-time performance. The performance metrics are automatically enabled; you do not need to set options or perform any extra configuration to collect them.If you encounter a problem, such as an application that is running slowly or is hanging, you can view particular metrics to find out more information about the problem.
From the Portal home page's Portal menu, click Monitoring > Performance Summary to display the Performance Summary page shown in Figure 8-13.
Figure 8-13 Oracle Fusion Middleware - Performance Summary Page
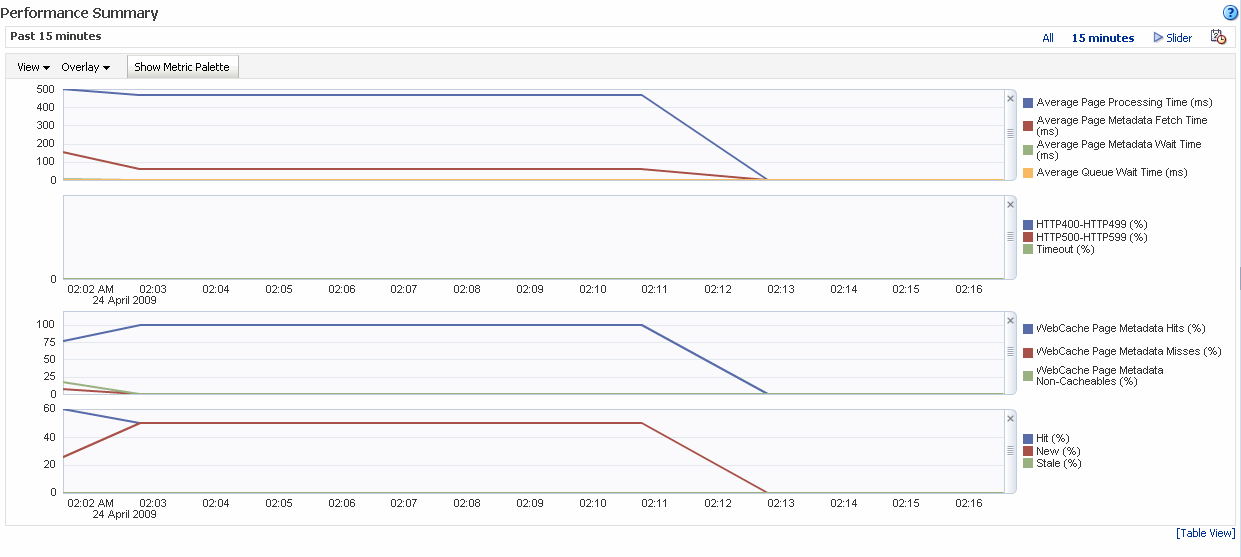
From the Performance Summary page you can:
Select the time range for which to view metrics using the options on the Time Range Selection bar.
Set display options, such as metric thresholds, using the View options.
View metrics in table format using the Table View option.
Select the metrics to view using the Metric Palette.
Time Range Selection Options
The Time Range Selection Bar (shown in Figure 8-14) contains options for selecting the time range for which metrics are displayed.
View Options
Use the View options to select metric thresholds for the selected metrics.
Overlay Option
Use the Overlay option to view metrics of another portal application.
Show Metric Palette Option
Use the Show Metric Palette option to display the Metric Palette (shown in Figure 8-15) from where you can select the metrics to view.
In Fusion Middleware Control, you can add, edit or delete the DAD (Database Access Descriptor) for an Oracle Portal instance. From the Portal home page's Portal menu, click Settings > Database Access Descriptor to display the Configure Database Access Descriptor page shown in Figure 8-16.
See Section 5.6.4, "Configuring a Portal DAD Using Fusion Middleware Control" for more information.
Figure 8-16 Oracle Fusion Middleware Control - Configure Database Access Descriptor Page

You can edit or view DAD settings from the Edit Database Access Descriptor page. From the Configure Database Access Descriptor page, select the DAD and click Edit to display the Edit Database Access Descriptor page shown in Figure 8-17. For information on adding and deleting a DAD, and for more information on editing a DAD, refer to Section 5.6.4, "Configuring a Portal DAD Using Fusion Middleware Control"
Note:
If you make any changes on the Edit DAD pages, you must restart Oracle HTTP Server and WLS_PORTAL.Figure 8-17 Oracle Fusion Middleware Control - Edit Database Access Descriptor Page

In the Edit Database Access Descriptor page, you can modify the DAD settings detailed in Table 8-1, "DAD Settings":
Table 8-1 DAD Settings
| Setting | Description |
|---|---|
|
Database Access Descriptor Name or Location |
Specify a path that points to the Portal DAD (for example, /pls/portal). The path must start with /pls, must not contain any special characters or spaces, and may not exceed 64 characters. Note: When editing a Portal DAD, this field is read-only. |
|
Portal Schema Name |
Enter the schema name for the Portal instance. |
|
Portal Schema Password |
Enter the schema password for the Portal instance. Tip: To obtain the schema password, refer to Section 5.6.10, "Retrieving the Portal Schema Password". Use this field to set the password for a nondefault Oracle Portal instance. For the default Oracle Portal instance, we recommend that you set the password, refer to Section 6.10, "Changing the Oracle Portal Schema Password" for more information. |
|
Database Connect String |
Enter the connection string (if the database is remote). If you are editing a Portal DAD, use the Connection String Format property below to specify the format of the connect string you have entered here. |
|
Connection String Format |
Specify the format used for the Database Connect String property. The options are:
|
|
Database NLS Language |
Enter the NLS language of the Oracle Portal database represented by this DAD. This setting overrides the NLS_LANG environment variable for a database session and defines some important NLS properties of the response, including the response character set. For Oracle Portal, this setting should match the NLS_LANG of the back-end database. For example, if you set this parameter is to JAPANESE_JAPAN.JA16SJIS, content is transferred from the database in the JA16SJIS character set. Tip: To obtain the settings of this parameter, query the nls_database_parameters table as follows: select value, parameter from nls_database_parameters where parameter in ('NLS_LANGUAGE', 'NLS_TERRITORY','NLS_CHARACTERSET'); Refer to the Oracle Fusion Middleware Administrator's Guide for Oracle HTTP Server, for more details on the mod_plsql parameter PlsqlNLSLanguage. |
|
Request Validation Function |
Specifies an application-defined PL/SQL function that can provide further processing of a requested procedure. This enables you to implement tight security for your PL/SQL application. For example, you can block package/procedure calls which must not be executed from this DAD. Use the following format for the PL/SQL function: boolean function_name (procedure_name IN varchar2) On invocation, the procedure_name argument contains the name of the procedure that the request is trying to execute. For example, if all PL/SQL application procedures callable from a browser are inside the package mypkg, you could implement the following function: boolean my_validation_check (procedure_name varchar2) is begin if (upper(procedure_name) like upper ('myschema.mypkg%')) then return TRUE; else return FALSE; end if; end; Use the following syntax to specify this property: plsqlRequestValidationFunction <string> For example: PlsqlRequestValidationFunction myschema.mypkg.my_validation_check Tips: By default, mod_plsql restricts direct URL access to certain schemas/packages. For more information, see the Exclusion List property described below. It is highly recommended that you provide an implementation for this function that only allows requests that belong to your application and are callable from a browser. Since this function is called for every request, ensure that this function is as performant as possible. Here are some recommendations:
|
|
Exclusion List |
Specify the procedures/packages/schema names which are forbidden to be directly executed from a browser. This is a comma separated list in which each string in the list is case insensitive and can accept wildcards. If this parameter is not specified, the default procedures are used. The default list is: sys.*, dbms_*, utl_*, owa_*, owa.*, htp.*, htf.*. If this parameter is overridden, the defaults still apply. Therefore, you do not have to explicitly add the default list to the list of excluded patterns. If you wish to have spaces in the pattern specified for PlsqlCGIExclusionList, enclose the exclusion list in double quotes. Setting this directive to #NONE# disables all protection and poses a security risk. This setting is not recommended for a live site and is reserved for debugging purposes only. |
|
Session Cookie Name |
This parameter applies only to Oracle Portal installations that participate in a distributed environment. In most cases leave this field blank as this parameter automatically defaults to the DAD name. |
|
Select Session State Management |
Portal Default (StatelessWithResetPackageState)No value is set for the Session State Management property. The default setting assigned by mod_plsql is used. |
|
CGI Environment List |
Specify overriding and/or new CGI environment variables. This is a comma separated list of names and value pairs which can override existing environment variables listed below or add new ones. If no value is specified for the parameters below, the value is obtained from the Oracle HTTP Server:
|
|
Error Style |
Specify whether error messages are displayed on pages generated by mod_plsql or the Oracle HTTP Server. Specify this parameter at the DAD level or at the global level by manually editing the file dads.conf. ApacheStyle (default) - mod_plsql indicates to the Oracle HTTP Server which HTTP errors are encountered and the Oracle HTTP Server generates the error page. This can be used in conjunction with the Oracle HTTP Server Error Document directive to produce customized error messages. modplsqlStyle - error pages are generated by mod_plsql. Typically, the error page contains a short message indicating the PL/SQL error encountered, for example, scott.foo PROCEDURE NOT FOUND. DebugStyle - error pages are generated by mod_plsql and they contain additional information such as the URL, parameters, and server configuration information. This mode is for debugging purposes only. Do not use this option in a production system since displaying internal server variables is a security risk. Note: If the PL/SQL application generates its own error page, this option is ignored. |
|
Document Table |
Enter the name of the database table where files uploaded through a Web browser are stored. Use the format: <Schema>.wwdoc_document |
|
Document Path |
Enter a path in the URL installation to indicate a document is being referenced. In the following URL, docs (which is the default value) is the Document Path. http://myapp.myserver.com:2000/pls/my_site/docs/folder1/presentation |
|
Path Aliasing |
Used by PL/SQL applications for Direct Access URLs. The default is url. Everything after the keyword url is sent to the invoked procedure. |
|
Path Alias Procedure |
Used by PL/SQL applications for Direct Access URLs. |
|
Always Describe Procedures |
Specify On or Off. mod_plsql must know the data type of the parameters being passed in. Based on the data type, mod_plsql binds each parameter as an array or as a scalar. This can be done two ways: Off - Default for mod_plsql. If this option is chosen, mod_plsql uses the following heuristics:
Note: If someone tries to pass a single value for an array parameter, it fails. A Describe call is then made, requiring two database trips (one for the failed execute and the other for the Describe call). On - One way to know the data type is to describe the procedures before executing it. This approach can be inefficient since every procedure has to be described before execution |
|
Before Procedure |
A user-defined procedure is called before invoking the target procedure. Use this option to generate headers or start enabling SQL traces. |
|
After Procedure |
A user-defined procedure is called after invoking the target procedure. Use this option to generate footers or stop SQL traces. |
|
Fetch Buffer Size (rows) |
Specify how many rows of PL/SQL response data mod_plsql fetches in each round trip to the database. The default is 200 rows. |
In Oracle Fusion Middleware Control, you can specify the Oracle Web Cache settings that Oracle Portal should use. From the Oracle Portal home page's Portal menu, select Settings > Portal Cache to display the Portal Cache Configuration page shown in Figure 8-18.
Figure 8-18 Fusion Middleware Control - Portal Web Cache Settings
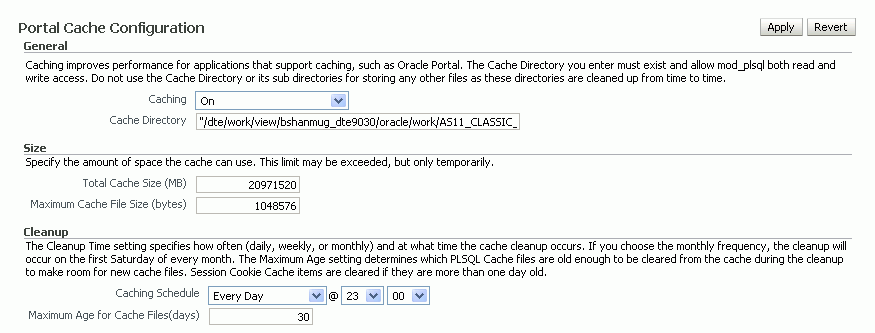
In the Portal Web Cache Settings page, you can modify the settings detailed in Table 8-2:
Table 8-2 Portal Cache Settings
| Setting | Description |
|---|---|
|
Caching |
Enables (On) or disables (Off) portal content and session caching. |
|
Cache Directory |
The directory path to where cached content is stored. Note: Ensure that this directory exists and that it is accessible (read/write access required). |
|
Total Cache Size |
The total amount of disk space (in megabytes) that the portal cache can use. The maximum value allowed is 4 GB. Note: This setting is not a hard limit. The cache may exceed this limit temporarily. |
|
Maximum Cache File Size |
The maximum size (in bytes) for all cached files. The maximum value allowed is 4 GB. Any dynamically generated content that exceeds this limit is not cached. |
|
Caching Schedule |
The time at which to start the cleanup of the cache storage. Use the format: The frequency can be set as daily, weekly, and monthly. The default is
|
|
Maximum Age for Cache Files(days) |
The maximum age for cached files. This setting ensures the cache system does not contain any old content. Old cache files are removed to make space for new cache files. The default is Note: This setting only affects items in the Portal content cache. Session cookie cache items are cleaned if they are in the cache for more than 1 day. |
Refer to Section 5.6.6, "Configuring the Portal Cache Using Fusion Middleware Control" for more information on how to configure the Portal Cache.
Use the Configure Page Engine page to analyze the performance of the Parallel Page Engine (PPE) that Oracle Portal is using. From the Oracle Portal home page's Portal menu, select Settings > Page Engine to display the Page Engine Configuration page shown in Figure 8-18.
Figure 8-19 Oracle Fusion Middleware Control - Portal Parallel Page Engine Settings
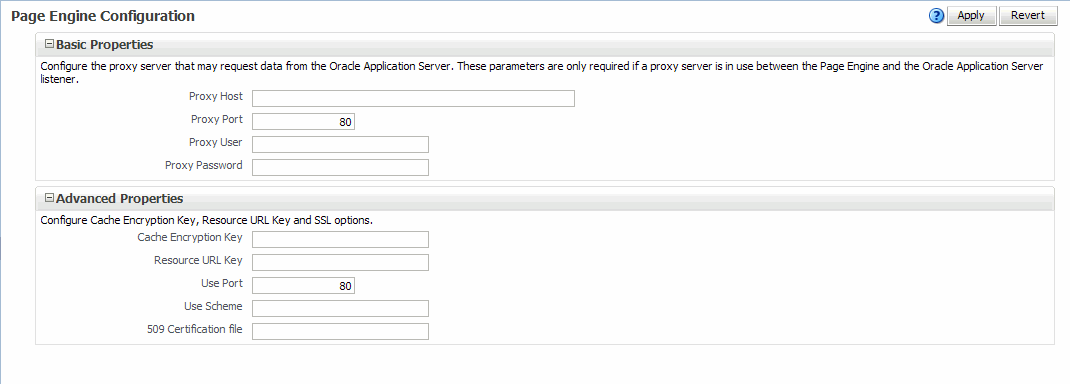
In the Portal Parallel Page Engine Settings page, you can modify the settings detailed in Table 8-3:
Table 8-3 Portal Parallel Page Engine Settings
| Setting | Description |
|---|---|
|
Proxy Host |
This is the host name of a proxy server that may be required to request data from the Oracle Fusion Middleware. These parameters are only required if a proxy server is in use between PPE and the Oracle Fusion Middleware listener. |
|
Proxy Port |
This is the port number of the proxy server specified by Proxy Host. |
|
Proxy User |
This is the user of the proxy server specified by Proxy Host. |
|
Proxy Password |
This is the password of the proxy server specified by Proxy Host. |
|
Cache Encryption Key |
This key is used to obscure the headers used for caching using Oracle Web Cache. This allows for a more secure cache key, and makes retrieving a cached object more difficult for unwanted requests. This key is not used if you are running 11g Release 1 (11.1.1) of the Portal repository or later, and is provided only for backward compatibility when you use an 11.1.1 middle tier with an earlier release of the Portal repository. |
|
Resource URL Key |
This key is used by the PPE to calculate checksums for URLs that are requested by WSRP and JPDK resource proxying. For WSRP resource proxying to work, the key must be set to an alpha-numeric value of 10 characters or more. In addition, for JPDK proxying, a JNDI environment variable called |
|
Use Port |
Overrides the port used when the PPE makes requests to the Portal. The default, if not specified, is to always use the page request port. Note: You must set the You need to specify these in scenarios where public access is through https on port A, and you want to set PPE requests to use a faster http connection on port B. |
|
Use Scheme |
Overrides the scheme (HTTP or https) used when the PPE makes requests to the Portal. The default, if not specified, is to always use the page request scheme. Note: You must set the You need to specify these in scenarios where public access is through https on port A, and you want to set PPE requests to use a faster http connection on port B. |
|
509 Certification file |
Specifies a file containing a list of certificates to be implicitly trusted by HTTPClient. These certificates are added as trust points to all connections made by HTTPClient using SSL. Once this setting is in use, all SSL connections must be trusted. Otherwise, HTTPClient will throw an exception in the PPE. SSL connections are made from the PPE for two reasons and this configuration affects both:
Note: The file specified here can be obtained from a wallet by exporting all trusted certificates, but the comments in the resultant file must be removed. Alternatively, it can be created manually. |
Refer to Section 5.6.9, "Configuring the Portal Parallel Page Engine" for more information on how to configure the Parallel Page Engine.
Use the Portal Wire Configuration page to configure Portal Midtier and to configure Web Cache and Oracle Internet Directory (OID) for a database access descriptor. From the Oracle Portal home page's Portal menu, select Settings > Wire Configuration to display the Portal Wire Configuration page shown in Figure 8-18.
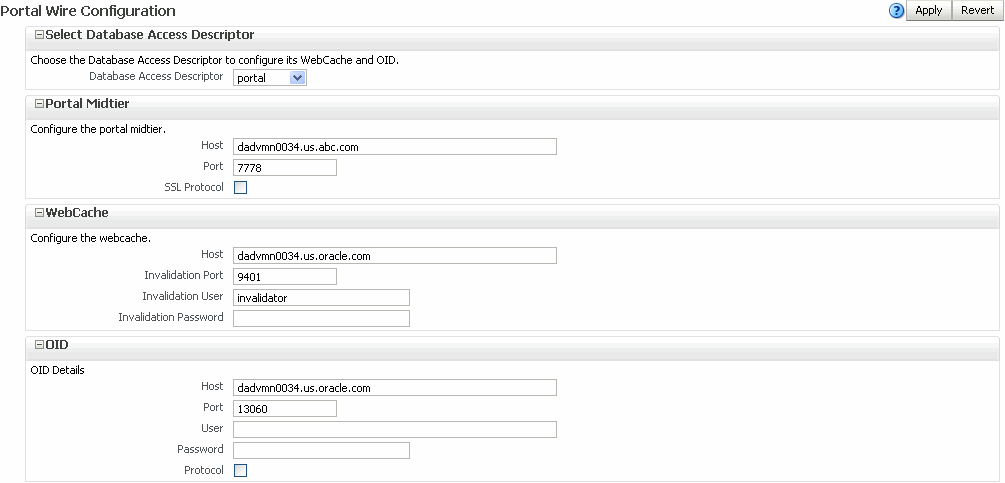
The page is arranged in the following sections:
Select Database Descriptor
This field specifies the database access descriptor to be configured.
Portal Midtier
| Element | Description |
|---|---|
| Host | Specifies the <hostname> of the Portal URL. In the High Availability context, this host name is the host name of the load balancer. In standalone setups, this host name is the host name of Web Cache. If you access a Portal from a browser using the url https://www.myportal.com:4443 then the Host value will be www.myportal.com. |
| Port | Specifies the <port> of the Portal URL. It is the listen port of the load balancer host name in HA setups. In standalone setups, this port is the listen port of Web Cache. If you access a Portal from a browser using the url https://www.myportal.com:4443 then the Port value will be 4443. |
| SSL Protocol | Specifies the protocol of the Portal URL. It can be either HTTP (non-SSL) or HTTPS (SSL). If you access a Portal from a browser using the url https://www.myportal.com:4443 then the SSL Protocol will be enabled. |
WebCache
| Element | Description |
|---|---|
| Host | Specifies the host name to be used by Portal for contacting Web Cache. By default, it matches the Portal middle tier host property, and this default value is used in most configurations. |
| Invalidation Port | Specifies the port number to be used by Portal for contacting Web Cache to perform invalidations. In non-High Availability environments, this property is configured to match the Oracle Web Cache invalidation port. In High Availability environments, this property is mapped to a port on an LBR which acts as a load balancing traffic across the individual invalidation ports. |
| Invalidation User | Specifies the invalidation user name. See Oracle Fusion Middleware Administrator's Guide for Oracle Web Cache for more information. |
| Invalidation password | Specifies the invalidation password, this is the invalidation password to be used by Portal for invalidating content in Web Cache. This password must match the password in Web Cache. If it does not match the Portal becomes unusable. |
When you set Oracle Web Cache properties on this page, the Oracle Portal schema is updated.
Notes:
When you change Oracle Web Cache properties in the Portal Web Cache Settings page, it impacts the property cached with Portal. Navigate to the Web Cache Administration page, in Fusion Middleware Control, to make the appropriate changes to Web Cache. Refer to theOracle Fusion Middleware Administrator's Guide for Oracle Web Cache for more information about Oracle Web Cache.
Changing Oracle Web Cache settings can impact Web Providers (such as OmniPortlet and Web Clipping) if the Oracle Web Cache and the Web Provider are running on the same middle tier. In this case, you must make corresponding cache configuration changes for the Web Providers. See "Defining the OracleAS Web Cache Invalidation Port" in the Oracle Fusion Middleware Developer's Guide for Oracle Portal.
OID
| Element | Description |
|---|---|
| Host | Specifies the host name of the OID server. |
| Port | Specifies the OID port number. |
| User | Specifies the OID user name. |
| Password | Specifies the OID password. |
| Protocol | Specifies the protocol to be used. Select this check box to use the HTTPS protocol. |
Log Message Page
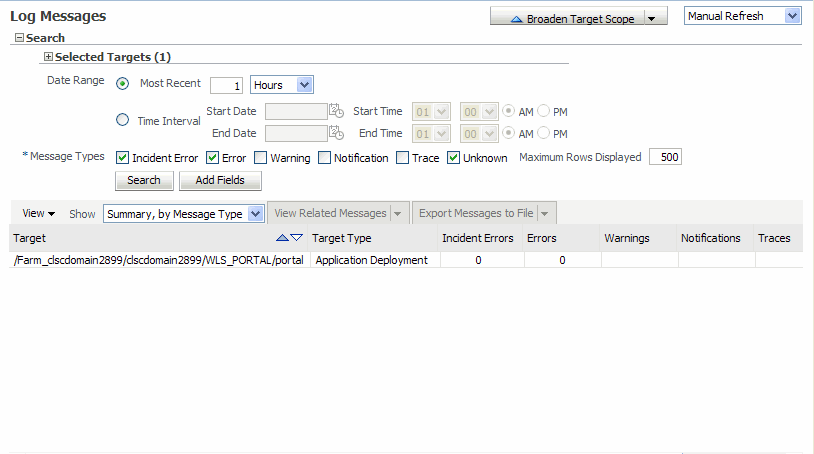
Use the Log Messages page to view detailed diagnostic information for that Oracle Portal instance. From the Portal home page's Portal menu, click Log > View Log Messages to display the Log Messages page shown in Figure 8-20. For more information, refer to the Enterprise Manager Online Help.
Figure 8-20 Oracle Fusion Middleware Control - Log Messages Page
See Appendix G, "Troubleshooting Oracle Portal" for more information.
Logs Configuration Page
In Fusion Middleware Control, you can specify the log settings that Oracle Portal should use. From the Oracle Portal home page's Portal menu, select Logs > Log Configuration to display the Log Configuration page shown in Figure 8-21.
A Topology tab is displayed at the top of every Fusion Middleware component home page. Click the Topology link to display a graphical representation of your Oracle Fusion Middleware environment, including the Oracle Fusion Middleware processes that are running Oracle Portal instances, such as, Web Cache, WLS_Portal and HTTP Server.
You can choose how objects and actions are logged in Oracle Portal and generate reports for analyzing the data. For example, you can add an entry into the Activity Log tables every time Oracle Portal users create, edit or delete a particular page.
Any authorized user can view the Oracle Portal Log Registry records. However, only the portal administrator can set up what information is to be logged. See Section 8.3.2, "Choosing Which Events Are Logged" for more information.
Note:
With the introduction of Oracle Web Cache into the Oracle Portal architecture, some actions logged in Oracle Portal Activity Log tables have become inaccurate. These actions include View, Execute (for Reports, Charts, and Hierarchies), and Show. The Activity Log tables and views still remain in the Oracle Metadata Repository, as all other logged actions remain accurate.Table 8-4 lists the events that can be logged for portal objects.
Table 8-4 Logged Events for Oracle Portal Objects
| Portal Object | Event |
|---|---|
|
Pages |
Create, Edit, Delete, Personalize |
|
Items |
Create, Edit, Delete, Move, Check Out, Check In |
|
Application Components |
Create, Edit, Delete, Execute (except for Reports, Charts, and Hierarchies), Copy, Export, Rename, Generate, Access Control, Manage, Insert, Update, Save |
|
Portlets |
Add to Page, Delete from Page |
|
Portlet Instances |
Hide, Personalize |
|
Searches |
Search |
Note:
User and Group actions such as Create, Edit, and Delete are logged by Oracle Internet Directory and may be viewed from Oracle Directory Manager, if logging is enabled. For more information, refer to theOracle Fusion Middleware Administrator's Guide for Oracle Internet Directory.You can choose which events are logged in Oracle Portal Log Registry records.
In the Services portlet, click Log Registry Administration.
Note:
By default, the Services portlet is on the Portal subtab of the Administer tab on the Portal Builder page.The Administer Log Registry page is displayed as shown in Figure 8-22.
Figure 8-22 shows two logging requests. The first creates an entry in the Activity Log every time a portlet is personalized. The second creates an entry every time a page is created. If you want to log all possible requests, choose % for each field.
Do one of the following:
Click Add New Log Registry Record to create a new Log Registry record and specify logging criteria.
Or,
Edit logging criteria for an existing Log Registry record. To do this, perform the following steps:
Click the Edit icon to edit logging criteria for an existing Log Registry record (under Edit/Delete Log Registry Record).
The Edit Log Registry Record page is displayed as shown in Figure 8-23.
Figure 8-23 Edit Log Registry Record page
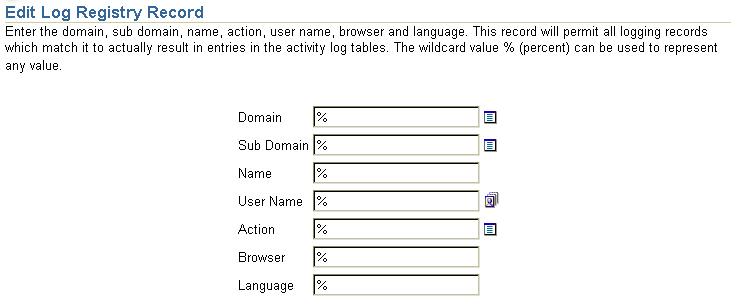
Choose the objects that you wish to log, from the Sub Domain list. Valid objects are listed in Table 8-4.
Choose which actions (or events) you want to log, from the Action list. Valid actions are listed in Table 8-4.
Specify other logging criteria as required.
Click OK.
Several Activity Log views are available (named wwlog_*). These views exist in the schema in which Oracle Portal is installed. These views are granted to public; however, the logs are secure according to the object's security. For example, information about pages is available only on pages for which the user has access privileges.
Table 8-5 lists all the Activity Log views and their descriptions. You can create simple Oracle Portal DB Provider reports and charts based on these views if required.
Table 8-5 Activity Log Views
| Log View | Description |
|---|---|
|
wwlog_portal_admin_logs |
All logs (only has records if the user is the portal administrator). |
|
wwlog_user_logs |
All logs created by current user. |
|
wwlog_all_portlet_logs |
Portlet instances on pages that the current user can view. |
|
wwlog_all_document_logs |
Documents that the current user can view. |
|
wwlog_all_search_logs |
Searches that the current user can view. |
|
wwlog_all_item_logs |
Items that the current user can view. |
|
wwlog_all_component_logs |
Components that the current user can view. |
|
wwlog_all_object_logs |
Summary view, which encompasses all the preceding views. |
You can also access information in the Activity Log views from outside of the Oracle Portal browser-based interface, that is, using SQL*Plus, OracleAS Reports Services, and so on. To do this, you must first set the portal security context for your database session using the wwctx_api.set_context API:
wwctx_api.set_context (
   p_user_name => 'portal_username',
   p_password  => 'portal_pw'
);
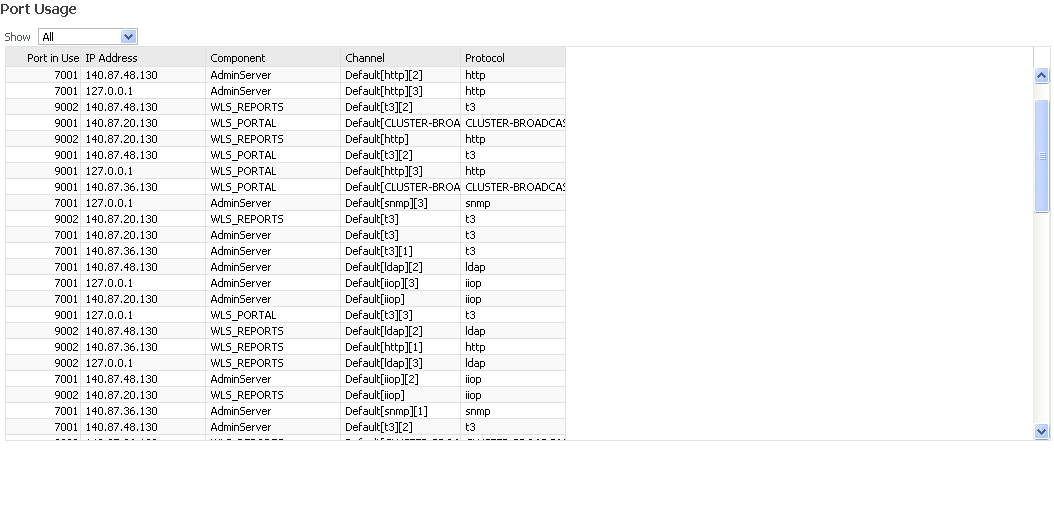
In Oracle Fusion Middleware Control, the Ports Usage page shows a list of all the ports currently in use by the components of a particular Oracle Fusion Middleware instance. This page is important when you are troubleshooting port conflicts among the various Oracle Fusion Middleware components.
Whenever possible, Oracle Fusion Middleware Control provides a link to the appropriate Oracle Enterprise Manager 11g configuration page where you can modify the port settings for the component.
To access port usage information for your Oracle Fusion Middleware:
From the navigation pane, expand the farm and then WebLogic Domain.
Select the domain.
From the WebLogic Domain menu, choose Port Usage.
The Port Usage page is displayed, as shown in Figure 8-24.
Figure 8-24 Oracle Fusion Middleware Ports Page
For information on managing ports, refer to the Oracle Fusion Middleware Administrator's Guide.
In 11g Release 1 (11.1.1), Oracle Enterprise Manager supports three kinds of administration roles: Administrator, Operator and Monitor. An Administrator role has full privilege for performing any operations, including security-related operations. Whereas, an Operator has a few privileges and the monitor has a limited set of privileges. If a user doesn't have permission, the functionality is either invisible or greyed out. The following table describes the privileges:
| Action | Administrator | Operator | Monitor |
|---|---|---|---|
| Start Up and Shut Down | Yes | Yes | No |
| View Metrics | Yes | Yes | Yes |
| View Log Messages | Yes | Yes | Yes |
| Log Configuration | Yes | No | No |
| Cache Settings Configuration | Yes | Permission to view only | Permission to view only |
| PPE Configuration | Yes | Permission to view only | Permission to view only |
| Portal Wiring Configuration | Yes | Permission to view only | Permission to view only |
| DAD Configuration Table | Yes | Permission to view only | Permission to view only |
| DAD Configuration : Add Action | Yes | No | No |
| DAD Configuration : Edit Action | Yes | No | No |
| DAD Configuration : Delete Action | Yes | No | No |
The Oracle Fusion Middleware System MBean Browser is a part of Oracle Fusion Middleware Control, and it is used to update configuration settings for middle tier components. A managed bean (MBean) is a Java object that represents a JMX manageable resource in a distributed environment, such as an application, a service, a component or a device. MBeans are defined in the Java EE Management Specification (JSR-77), which is part of Java Management Extensions, or JMX, a set of specifications that allow standard interfaces to be created for managing applications in a Java EE environment.
This section contains the following topics:
You use the System MBean Browser to enter or modify Oracle Portal configuration settings that are not available in Fusion Middleware Control Oracle Portal pages.
Note:
You should not use the System MBean Browser unless you are an advanced middle tier administrator.Configuration MBeans are defined for each of the Oracle Portal configuration files. Table 8-6 lists the configuration MBeans for Oracle Portal.
Table 8-6 Portal Configuration MBeans
| Configuration Mbean | Associated Configuration File |
|---|---|
|
Portal DAD MBean (Config) |
portal_dads.conf |
|
Portal Cache MBean (Config) |
portal_cache.conf |
|
Portal plsql MBean (Config) |
portal_plsql.conf |
|
Portal Midtier MBean (Config) |
appConfig.xml |
|
Portal Wiring MBean (Runtime) |
No associated configuration file. |
Note:
All Portal environment variables that are set in the registry are not exposed using MBeans. However, if they are specified in the server configuration file ENVID, the environment variables are exposed byPortalServerConfigMXBean.