| Oracle® Fusion Middleware Administrator's Guide for Oracle SOA Suite and Oracle Business Process Management Suite 11g Release 1 (11.1.1.5.0) Part Number E10226-08 |
|
|
View PDF |
| Oracle® Fusion Middleware Administrator's Guide for Oracle SOA Suite and Oracle Business Process Management Suite 11g Release 1 (11.1.1.5.0) Part Number E10226-08 |
|
|
View PDF |
This chapter describes how to monitor Decision Service Components. Decision Service components are also called Business Rules service components in the Oracle Fusion Middleware documentation. The Business Rules service engine does not support any user level configuration.
This chapter includes the following topics:
Section 18.1, "Monitoring Business Rules Service Engine Instances and Faults"
Section 18.2, "Monitoring Business Rules Service Engine Statistics"
Section 18.3, "Monitoring Business Rules Service Engine Instances"
Section 18.4, "Monitoring Business Rules Service Engine Faults"
Section 18.5, "Monitoring Business Rules Service Engine Deployed Components"
Section 18.6, "Monitoring Decision Service Component Instances from a Composite Application"
Using the Business Rules service engine home page Dashboard page, you can monitor recent instances and faults of Decision Service components running in the SOA Infrastructure. These Decision Service components can be part of separate SOA composite applications. Decision Service Components are also called Business Rules components in the Oracle Fusion Middleware documentation.
To monitor business rules service engine instances and faults:
Access the Business Rules service engine home page through one of the following options:
| From the SOA Infrastructure Menu... | From the SOA Folder in the Navigator... |
|---|---|
|
|
Click Dashboard.
The Recent Instances section of the Dashboard page displays recent instances of all Decision Service components, including the instance ID of the Decision Service component, the Decision Service component name, the SOA composite application of which the Decision Service component is a part, the state of the instance (for example, completed successfully or faulted, the instance start time, the last modification time, and a Logs icon (clicking the Logs icon shows the Log Messages page with filtered messages specific to that instance)).
Note:
To see the state with the correct information, you must set the Capture Composite Instance State property. You can change this setting on the SOA Administration Common Properties page. Turning this feature on allows for separate tracking for running instances. However, this may impact performance. For information on setting this property, see Section 3.1, "Configuring SOA Infrastructure Properties."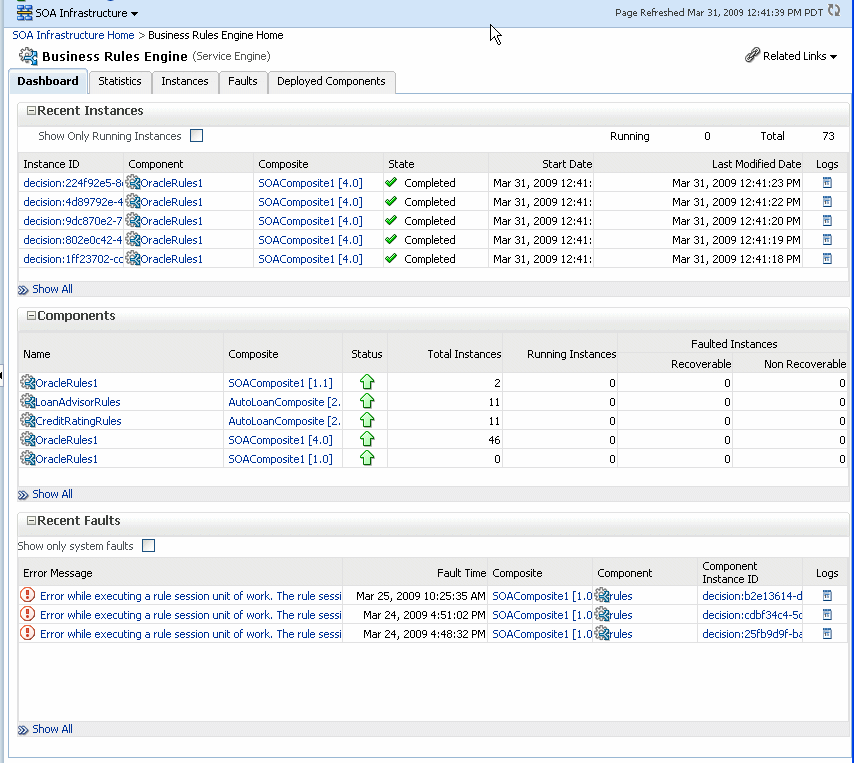
In the Instance ID column, click an instance ID for a Decision Service component to view its audit trail.
Note:
The contents of the audit trail page depends on the Audit Level settings. When the Audit Level property is set to Production, the audit trail shows only the activity names. When the Audit Level is set to Development mode, the audit trail shows the Decision Service instance payload details. In other modes, for example Off, the audit trail does not show Decision Service details. You can change the Audit Level on the SOA Infrastructure Common Properties page. Additionally, this option can be set for a specific composite from the home page for the composite.In the Component column, click a specific Decision Service component to access its home page.
In the Composite column, click a specific SOA composite application to access its home page.
In the Logs column, click a specific log to access the Log Messages page with filtered messages specific to that instance.
Click Show All to access the Instances page of the service engine.
The lower section of the Dashboard page displays the following:
The Components section shows the Decision Service components deployed on the Business Rules service engine across SOA composites. It also shows the status of the SOA composites and the instance count information in the respective instance state columns.
The Recent Faults section lists the recent faults in the service engine, including the error message, the time at which the fault occurred, the SOA composite application in which the fault occurred, the Decision Service component, the instance ID of the Decision Service component, and a Logs icon (clicking the Logs icon shows the Log Messages page with filtered messages specific to that instance).
For more information, see Section 1.2.4, "Introduction to Service Components and Service Component Instances."
Using the Business Rules service engine Statistics page, you can monitor Business Rules service engine performance and metrics. This page shows service engine-level, not component-level, details. Business Rules service components are also called Decision Service Components in the Oracle Fusion Middleware documentation.
To monitor business rules service engine statistics:
Access the Business Rules service engine statistics page through one of the following options:
| From the SOA Infrastructure Menu... | From the SOA Folder in the Navigator... |
|---|---|
| Select Service Engines > Business Rules. |
|
Click Statistics.
The Statistics page displays the following:
Average Request Processing Time: This chart displays the average request processing time of the Business Rules service engine since server startup. That is, how many requests were processed by the service engine per unit of time.
Business Rules Cache Statistics: This section provides details about the service engine cache. This section lists the types of caches used by the service engine and the object count in each of the caches. All these metrics are based on the object count since server startup.
Business Rules Operation Statistics: This section shows the operation statistics. Using the operation statistics, you can determine the number of calls to Oracle Business Rules decision functions since server startup, and determine the total time spent in Decision Functions since server startup.
Note:
When you view Business Rules operation statistics for composite applications created with Oracle Fusion Middleware 11g Release 1 (11.1.1), the only operation shown is the callFunction operation. In this release, the Decision Service only calls Oracle Business Rules using decision functions, and this operation is indicated with values for the operation named callFunction (with Count and Average(ms) fields). With composite applications that were migrated from older releases, the Decision Service performs callFunction operations and the other operations listed in the Business Rules Operation Statistics section. For these migrated projects, you can debug the flow of the request through various important operations within the service engine. Also, you can find any long-running operations and take the necessary actions. These metrics also are since server startup.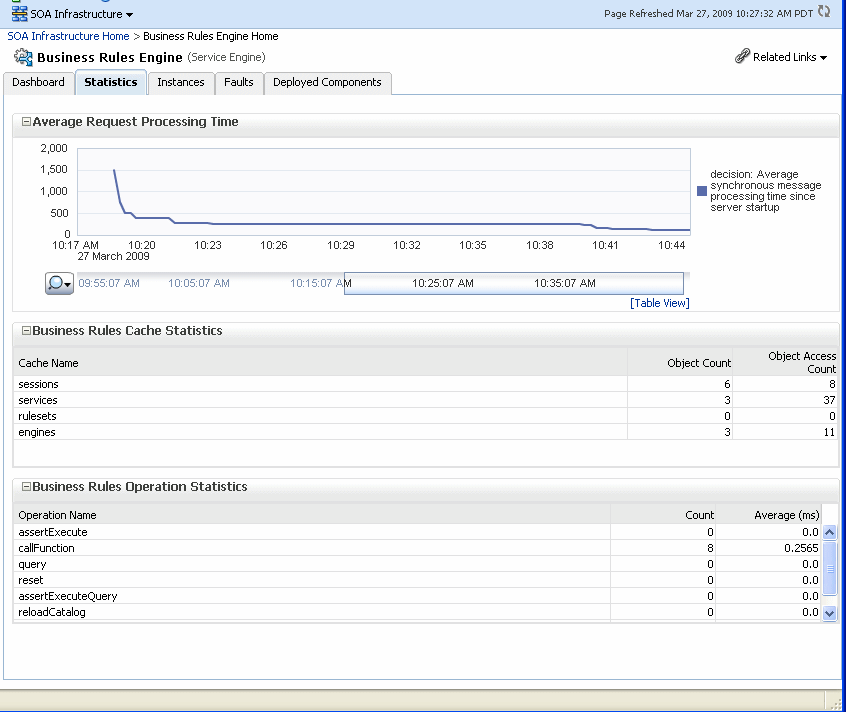
Using the Business Rules service engine Instances page, you can monitor all Decision Service component instances. These Decision Service components can be part of separate SOA composite applications. Decision Service components are also called Business Rules service components in the Oracle Fusion Middleware documentation.
To monitor business rule service engine instances:
Access the Business Rules service engine Instances page through one of the following options:
| From the SOA Infrastructure Menu... | From the SOA Folder in the Navigator... |
|---|---|
| Select Service Engines > Business Rules. |
|
Click Instances.
The Instances page displays the following:
A utility for searching for a specific instance by specifying criteria and clicking Search.
A list of instances, including the instance ID of the Decision Service component, the Decision Service component name, the SOA composite application name, the state of the instance (for example, completed successfully, running, or faulted), the instance start time, the last modification time, and a Logs icon (clicking the Logs icon shows the instance log messages).
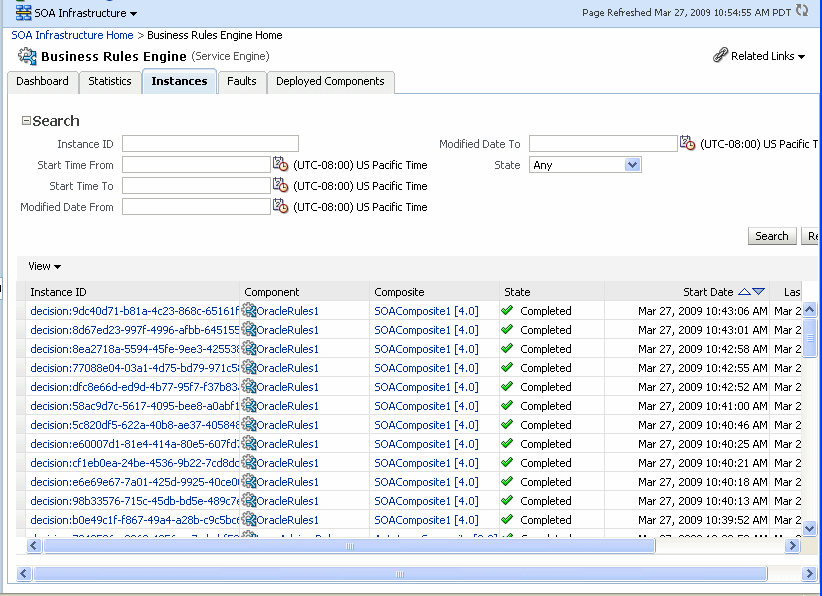
In the Instance ID column, click an instance ID for a Decision Service component to view its audit trail details.
Note:
The contents of the audit trail page depends on the Audit Level settings. When the Audit Level property is set to Production, the audit trail shows only the activity names. When the Audit Level is set to Development mode, the audit trail shows the Decision Service instance payload details. You can change the Audit Level on the SOA Infrastructure Common Properties page. Additionally, this option can be set for a specific composite from the home page for the composite.In the Component column, click a specific Decision Service component to access its home page.
In the Composite column, click a specific SOA composite application to access its home page.
In the Logs column, click a specific log to access the Log Messages page with filtered messages specific to that instance.
For more information, see Section 1.2.4, "Introduction to Service Components and Service Component Instances."
Using the Business Rules service engine Faults page, you can monitor all Decision Service component faults. The Faults page shows this information for Decision Service components that can be part of separate SOA composite applications. Decision Service Components are also called Business Rules components in the Oracle Fusion Middleware documentation.
To monitor business rules service engine faults:
Note:
Decision Service component faults are always nonrecoverable.Access the Business Rules service engine Faults page through one of the following options:
| From the SOA Infrastructure Menu... | From the SOA Folder in the Navigator... |
|---|---|
| Select Service Engines > Business Rules. |
|
Click Faults.
The Faults page displays the following:
A utility for searching for a specific fault by specifying criteria and clicking Search. Click the Help icon for details.
A list of faults that occurred in the Decision Service component, including the error message, the time at which the fault occurred, the SOA composite application and Decision Service component in which the fault occurred, the Decision Service component instance ID, and a Logs icon (clicking the Logs icon shows the instance log messages).
Decision Service component instance faults cannot be recovered.
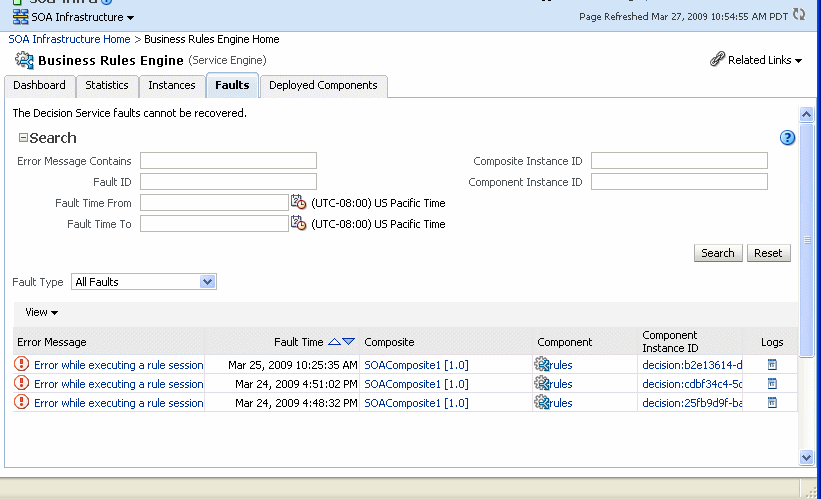
You can perform the following monitoring tasks from within the Faults page:
From the Fault Type list, select to display all Faults, system faults, business faults, or Oracle Web Services Manager faults in the Faults page.
From the View list, select Columns > Fault ID to display the fault IDs for each fault. The fault ID is automatically generated and uniquely identifies a fault. The fault ID is also displayed when you click an error message.
In the Component column, click a specific Decision Service component to access its home page.
In the Component Instance ID column, click a specific Decision Service component instance ID to view the audit trail.
Note:
The contents of the audit trail page depend on the Audit Level settings. When the Audit Level property is set to Production, the audit trail shows only the activity names. When the Audit Level is set to Development mode, the audit trail shows the Decision Service instance payload details. You can change the Audit Level on the SOA Infrastructure Common Properties page. Additionally, this option can be set for a specific composite from the home page for the composite.In the Logs column, click a specific log to access the Log Messages page with filtered messages specific to the instance. Clicking the Log link shows the faults and error messages related to that faulted instance.
In the Error Message column, click to view the fault details.
For more information, see Section 1.2.4, "Introduction to Service Components and Service Component Instances."
Using the Business Rules service engine home page Deployed Components page, you can monitor all Decision Service components deployed across SOA composite applications. Decision Service Components are also called Business Rules components in the Oracle Fusion Middleware documentation.
To monitor business rule service engine deployed components:
Access the Business Rules service engine Deployed Components page through one of the following options:
| From the SOA Infrastructure Menu... | From the SOA Folder in the Navigator... |
|---|---|
| Select Service Engines > Business Rules. |
|
Click Deployed Components.
The Deployed Components page displays the following:
A utility for searching for a specific component by specifying criteria and clicking Search.
A list of components, including the name, the SOA composite application name, the status (up or down), and the instances count (total, running, and faulted).
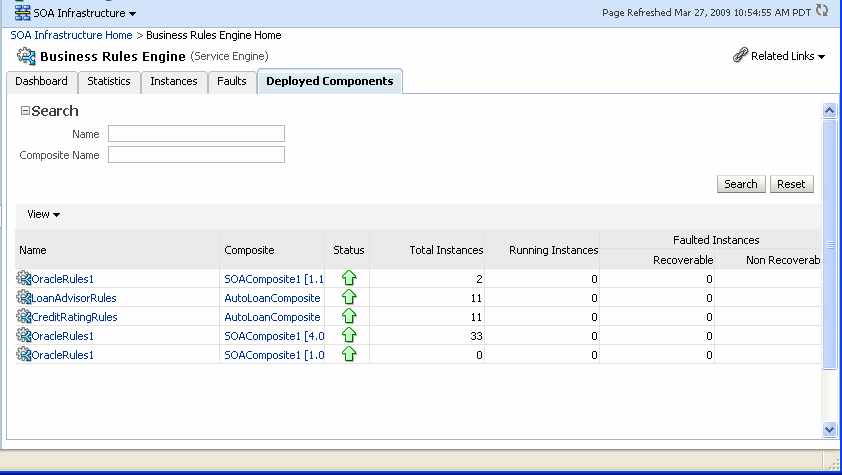
In the Name column, click a name to navigate to the Component home page and view component details.
In the Composite column, click a specific SOA composite application to access its home page.
For more information, see Section 1.2.4, "Introduction to Service Components and Service Component Instances."
You can monitor Decision Service component instances from a composite application. Each Decision Service component instance has its own unique instance ID. This ID is in addition to the instance ID of the overall SOA composite application of which this Decision Service component is a part. Decision Service components are also called Business Rules components in the Oracle Fusion Middleware documentation.
Note:
To see the state with the correct information, you must set the Capture Composite Instance State option. You can change this setting on the SOA Infrastructure Common Properties page. Turning this feature on allows for separate tracking for running instances. However, this may impact performance. For information on setting the option, see Section 3.1, "Configuring SOA Infrastructure Properties."To monitor Decision Service component instances from a composite application:
Access a Decision Service component from a composite application through one of the following options:
| From the SOA Infrastructure Menu... | From the SOA Folder in the Navigator... |
|---|---|
|
|
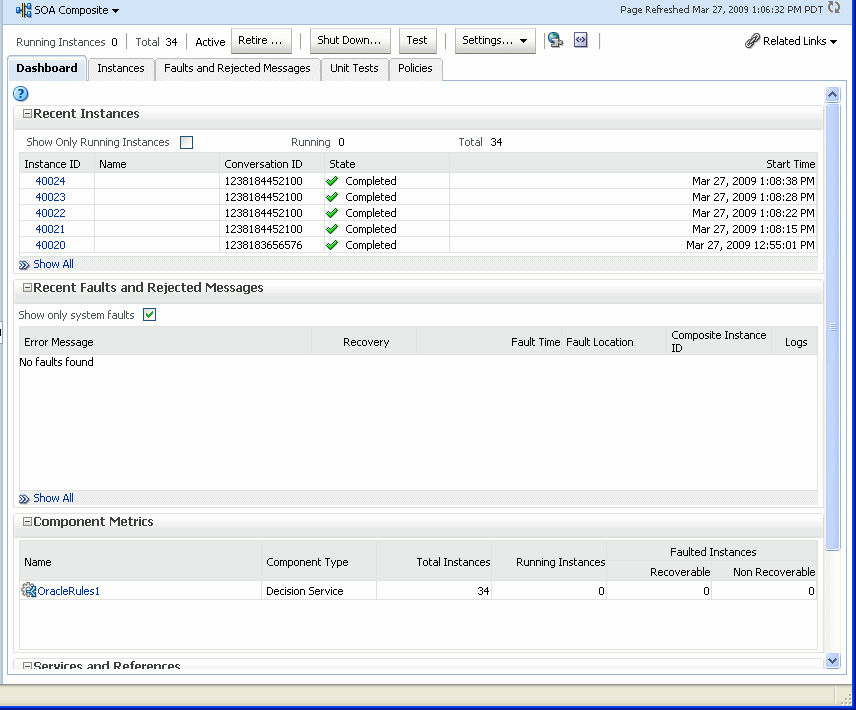
The Component Metrics section on the composite dashboard provides a high-level overview of each Decision Service component. This table includes columns showing the Component Type, the Total Instances, the Running Instances, and the Faulted Instances (recoverable and nonrecoverable).
Select a Decision Service component in the Component Metrics section to display the corresponding Decision Service Component page.
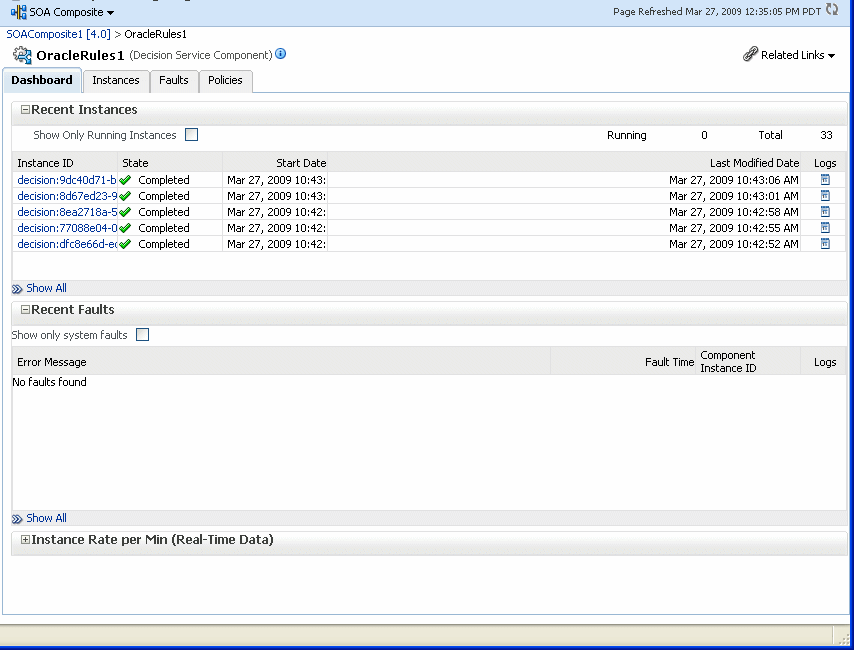
For more information, see Section 1.2.3, "Introduction to SOA Composite Application Instances."
You can use Oracle Enterprise Manager Fusion Middleware Control to perform rule execution tracing. For more information about accessing and using Fusion Middleware Control, see Chapter 2, "Getting Started with Administering Oracle SOA Suite and Oracle BPM Suite."
A rule execution trace is a mechanism of tracing Oracle Business Rules service engine events that occur during the evaluation of rules. The types of events traced are:
Fact operations (assert, retract, and modify)
Rules execution
Rule activation
Ruleset stack changes
Rule compilation
Reset (required for maintaining state during analysis)
Each trace contains information about the event that it traces. For example, a rule trace entry for an executed rule consists of:
Rule name (RL name)
Execution sequence number
List of fact IDs for the facts that matched this rule
Timestamp in milliseconds
Rule execution trace audit levels are the same as the audit levels supported in the SOA Infrastructure:
Off: Rule execution tracing is disabled. The decision component instance is not created at all.
Development: Full rule execution tracing that contains all the details about facts (listing, operations such as modify and assert), rule activation, pop or push rulesets, and so on. It also provides a list of fact IDs on which the executed rules are matched. See Section 18.7.1, "Tracing Rule Execution at the Development Audit Level" for an example.
Production: The executed rules are traced. All the details about facts, rule activation, pop or push ruleset are not available. The trace do not contain a list of the matching facts IDs. See Section 18.7.2, "Tracing Rule Execution at the Production Audit Level" for an example.
You can set audit levels either at the SOA Infrastructure level or at the composite level. See Section 3.1, "Configuring SOA Infrastructure Properties" for SOA Infrastructure audit level configuration information. See Section 1.4.1.1, "Introduction to the Order of Precedence for Audit Level Settings" for a discussion about audit level precedence when set at the SOA Infrastructure level and the composite level. The following sections discuss setting audit levels at the composite level for the purposes of rule execution tracing.
Setting the audit level to Development enables you to view all the details pertaining to a rule that has been executed.
To perform a development-level rule execution trace:
Open the composite application in Oracle Enterprise Manager Fusion Middleware Control.
A list of the recent composite instances is shown on the composite Dashboard page.
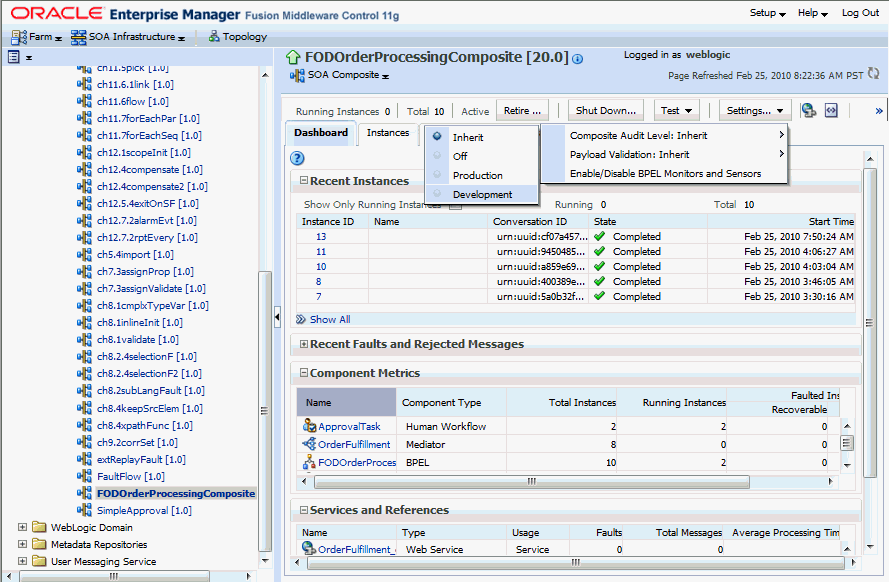
Click the Settings list, select Composite Audit Level, > Development to set the trace level as Development at the composite level.
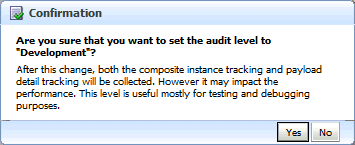
Click Yes in the Confirmation dialog.
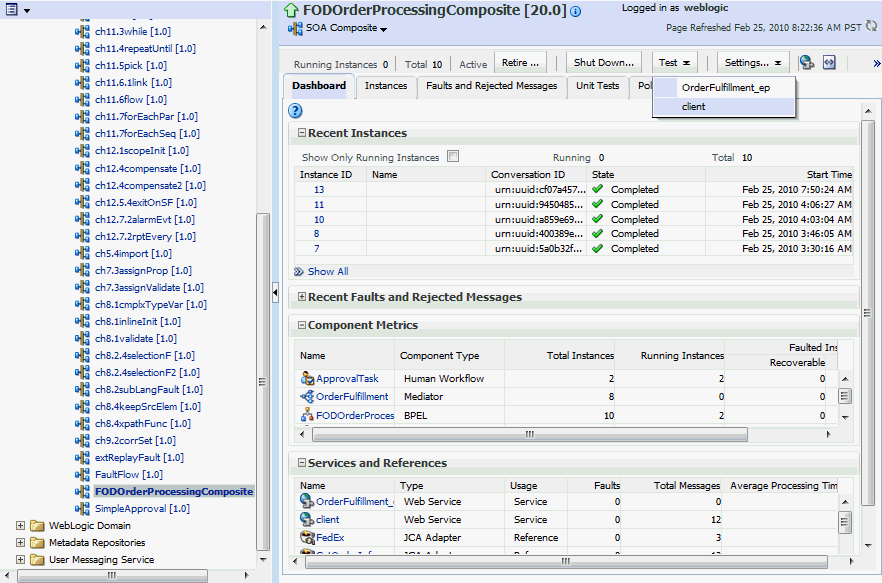
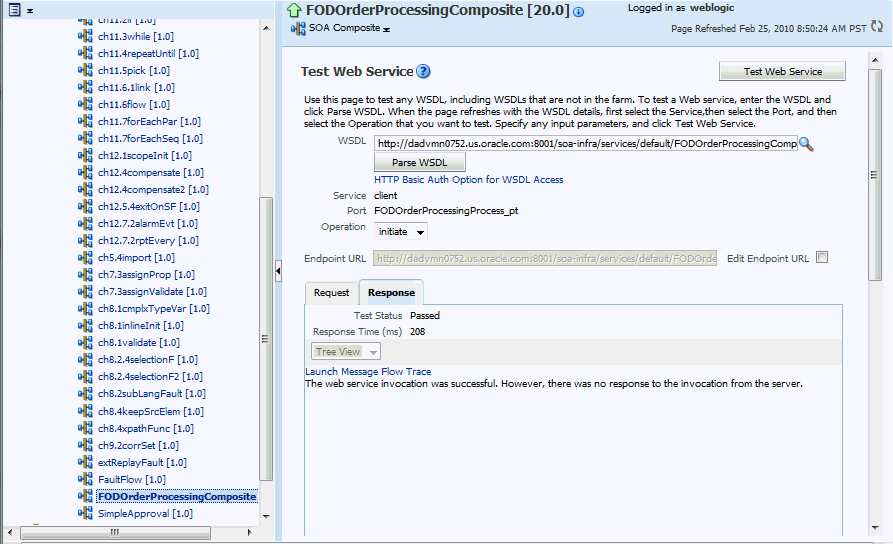
Click Test and then client to invoke a test instance of the composite to view the decision traces corresponding to different input parameters, such as the Order ID.
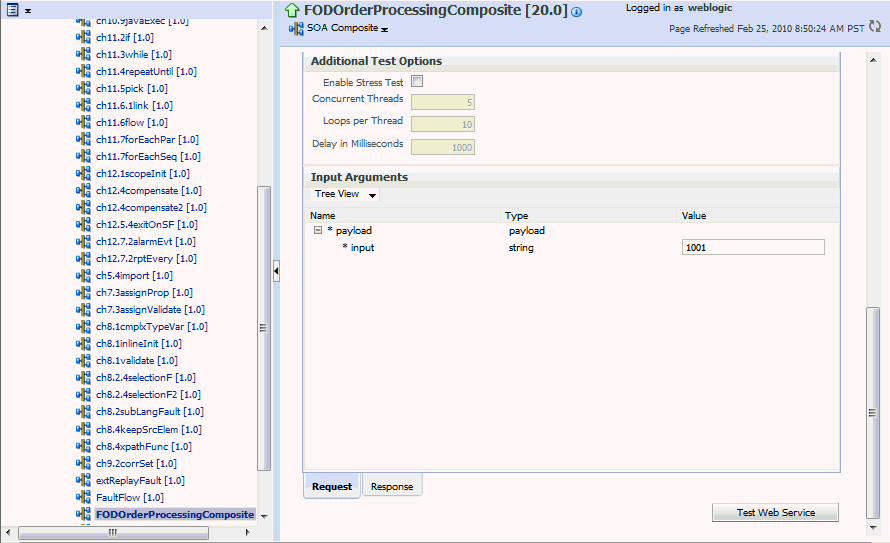
Enter an Order ID, for example 1001, in the Value field in the Input Arguments section on the Test Web Service page and click the Test Web Service button.
Based on the input Order ID, the service invokes a BPEL process instance containing the details of the Order ID, and the rule that is relevant to the order details is executed.
Click Launch Message Flow Trace under the Response tab to open the Flow Trace page.
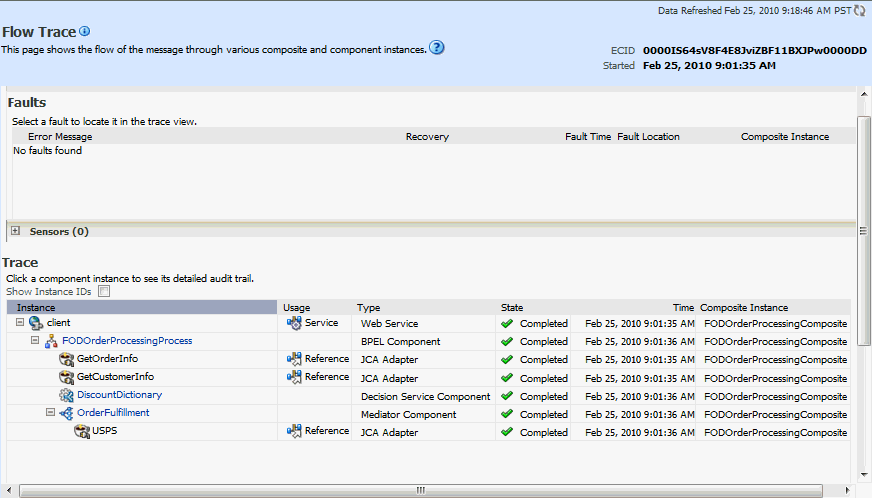
Click the Decision Service component instance called DiscountDictionary in the Trace section to view the actual rule execution trace.
Note:
You can also view the values of composite variables before and after invocation of business rule component. You need to click the BPEL process component instance in the Flow Trace page, and then click the relevant payload. In this case, the BPEL component name is FODOrderProcessingProcess.The following graphic shows the execution trace for the Decision Service component called DiscountDictionary.
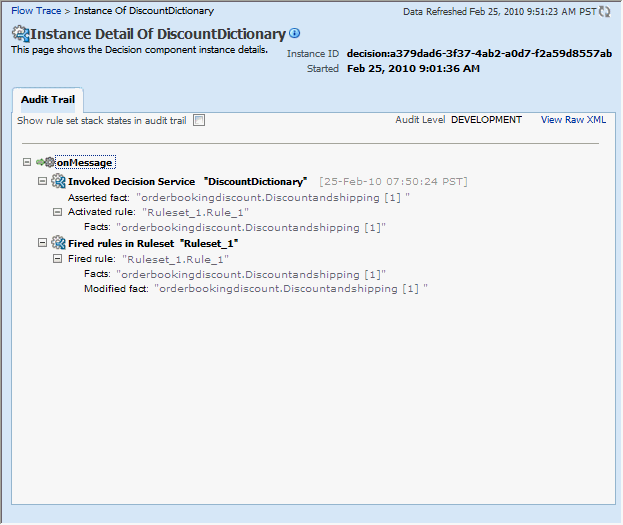
Click the Show rule set stack states in audit trail checkbox to view further details of the rule execution.
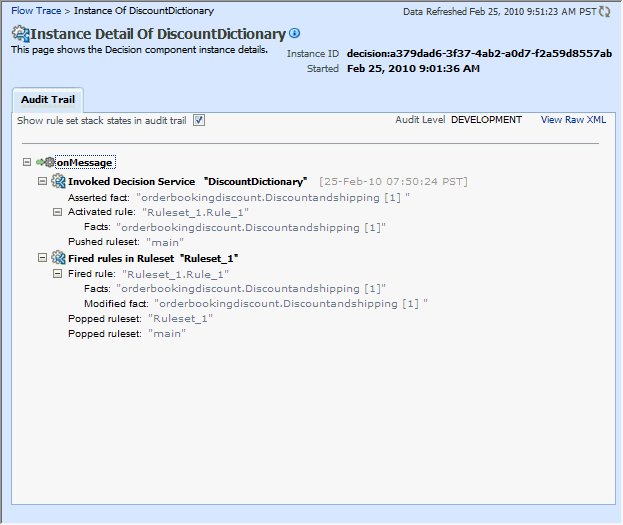
The development-level trace report displays the fact name, activated rule, as well as the pushed and popped ruleset names.
The following table lists the entries of the trace report:
Notes:
The entryInvoked Decision Service Name appears differently in different scenarios:
For AS10.1.3.x to AS11 upgraded rules dictionaries with AssertExecuteWatch patterns, the entry appears in the trace report as Invoked Decision Service.
For AS10.1.3.x to AS11 upgraded rules dictionaries with CallFunction patterns, the entry appears in the trace report as Invoked Decision Function.
For AS11 created dictionaries, the entry is displayed as Invoked Decision Function.
Setting the audit level to Production provides a truncated report on the rule execution trace. It only displays the ruleset and the rules that have been fired and does not display details about facts, rule activation, and so on.
The process of production-level tracing is similar to the development-level tracing. However, for Production-level tracing, you need to do the following:
In Fusion Middleware Control, after opening the composite, select Production from the Composite Audit Level of the Settings menu.
The following graphic shows the Flow Trace page that displays the trace report.
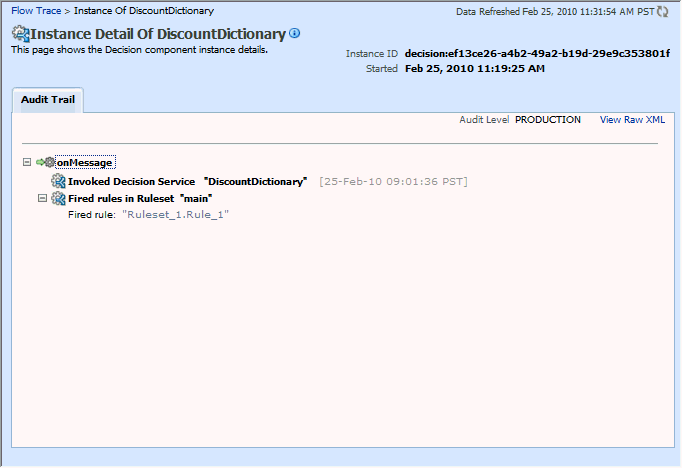
The Production-level trace report contains only the name of the ruleset and the rules that were fired. In addition, the Show rule set stack states in audit trail checkbox that provides a drill-down detailed trace report is unavailable in the Production-level trace report.
You can monitor Decision Service component logs. Decision Service components are also called Business Rules service components in the Oracle Fusion Middleware documentation.
To view decision service component logs:
In the navigation tree, select and right-click soa-infra.
Select Logs > View Log Messages. This displays the Log Messages page.
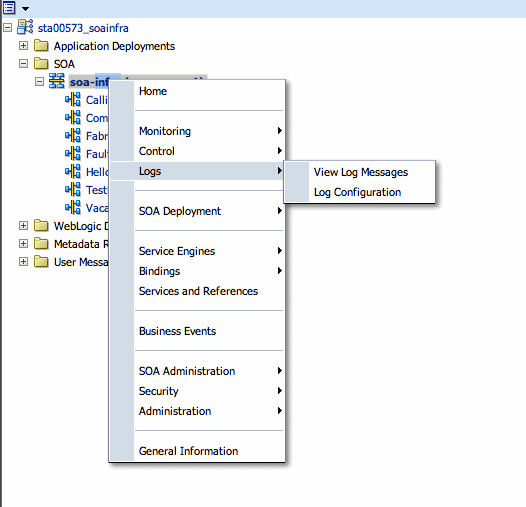
The Log Messages page opens. Use this page to select target log files.
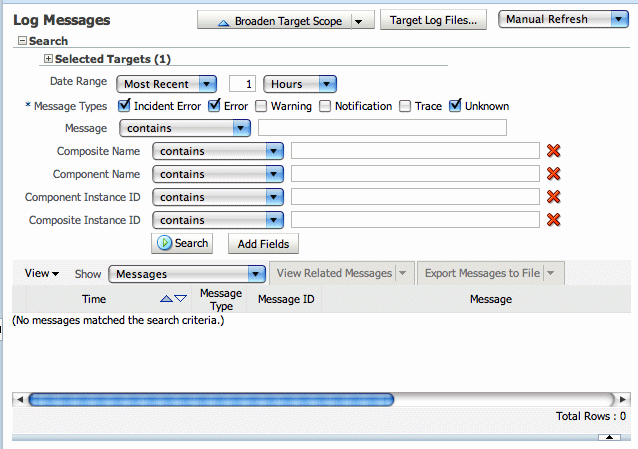
To access a prefiltered list of log files for each instance or fault, click in the Logs column from any specific page (for example, in the Decision Service engine or component's faults or instances tables).
For example, from the Faults table, click the Logs column.

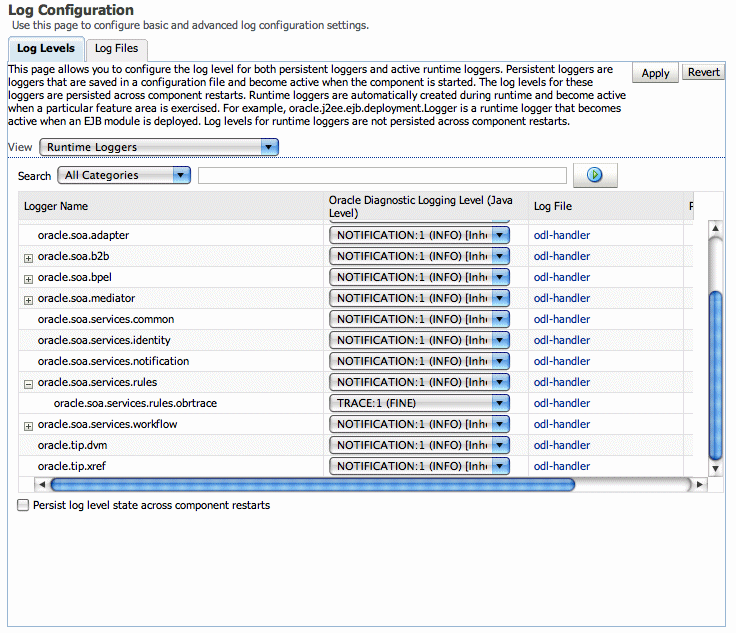
Use the Log Configuration page to configure the logging level.
To set the diagnostic logging level with a log configuration:
Right-click soa-infra, and select Logs > Log Configuration.
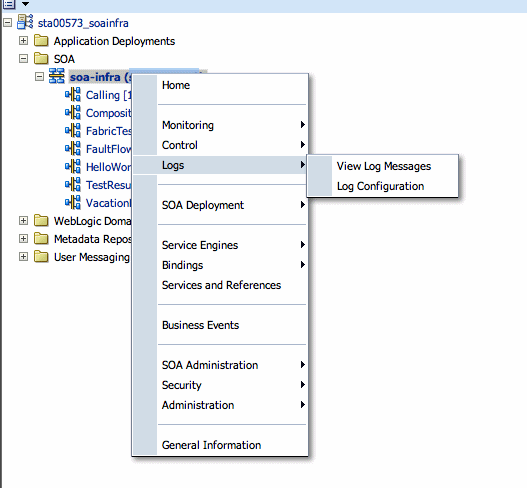
To configure the Decision Service component logging level, expand the oracle.soa.service.rules and the oracle.soa.services.rules.obrtrace loggers and set the notification level.
