|
Oracle® Application Server 10g Licensing Information
10g (9.0.4) Part No. B13696-01 |
|
|
|
|
Oracle® Application Server 10g Licensing Information
10g (9.0.4) Part No. B13696-01 |
|
|
|
This chapter describes the separately licensed Oracle Application Server 10g options, management packs, and other products you can purchase to enhance the capabilities of Oracle Application Server 10g in specific application environments. This chapter contains the following sections:
You may not use the options, packs, or products described below without separately purchased licenses. The fact that these options, packs, or products may be included in product CDs or downloads or described in documentation that you receive does not authorize you to use them without purchasing appropriate licenses.
Currently, Oracle Application Server 10g has only one option, the Identity Management Option. The Identity Management Option can be purchased with Oracle Application Server Standard Edition. Oracle Identity Management is included with Oracle Application Server Enterprise Edition.
Oracle Identity Management is an integrated infrastructure that provides distributed security services for Oracle products and the enterprise. The Oracle Identity Management Infrastructure includes the following components:
Oracle Internet Directory, an LDAP compliant directory service implemented on the Oracle9i Database.
Oracle Directory Integration and Provisioning, part of Oracle Internet Directory, which permits synchronization between Oracle Internet Directory and other directories, user repositories, automatic provisioning services, and applications.
Oracle Delegated Administration Services, part of Oracle Internet Directory, which provides trusted proxy-based administration of directory information by users and application administrators.
Oracle Application Server Single Sign-On, which provides single sign-on access to Oracle and third-party Web applications.
Oracle Application Server Certificate Authority, which generates and publishes X.509 certificates to support PKI-based (strong) authentication methods.
The sections that follow describe the two Oracle Management Packs for Oracle Application Server: the Oracle Application Server Diagnostics Pack and the Oracle Application Server Configuration Management Pack. The management packs can be purchased with any of the Oracle Application Server editions.
The features in the two management packs are accessible through Oracle Enterprise Manager 10g Grid Control. All Oracle Enterprise Manager 10g Application Server Control functionality is free with any of the Oracle Application Server editions.
The Oracle Application Server Diagnostics Pack provides automatic performance diagnostic and advanced system monitoring functionality. The Oracle Application Server Diagnostics Pack includes the following features:
Historical/trending data (Application Server and host)
Interactive transaction tracing
Page performance
Event notifications: notification methods, rules, and schedules
Event history/metric history (Application Server and host)
Blackouts
In order to use the features listed above, you must purchase licenses for the Oracle Application Server Diagnostics Pack. The following list itemizes the Enterprise Manager links and areas that require licensing of the Diagnostics Pack.
|
Note: All Oracle Enterprise Manager 10g Application Server Control functionality is free and included with each edition of Oracle Application Server. The links and areas that require the Diagnostics Pack are all part of Oracle Enterprise Manager 10g Grid Control, and are listed in bold. |
All of the Grid Control pages have a set of four links in the top right corner: Setup, Preferences, Help, and Logout.
When you click the Preferences link, there are three links on the Preference page that are part of the Diagnostics Pack. These links are on the left side of the page, under the heading Notification:
My Rules
Public Rules
Schedule
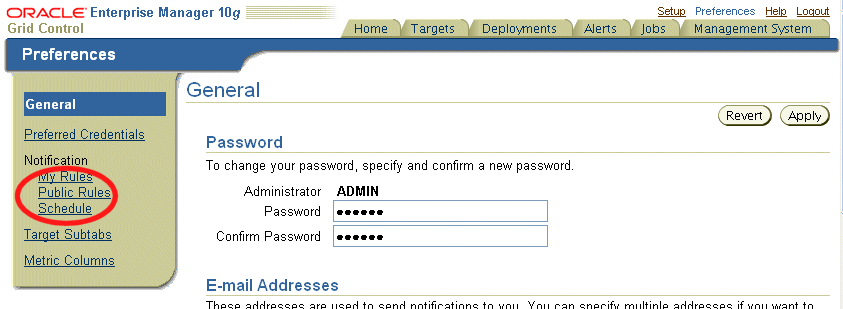
When you click on the Setup link, there are two links on the Setup page that are part of the Diagnostics Pack. These links are on the left side of the page.
Notification Methods
Blackouts

When you choose the Targets tab in the Grid Control Console, you get a row of sub-tabs categorizing the targets.
When you choose the Application Servers sub-tab, you get a table that lists your application servers and various information about each one.
In the Availability column of the table, there are icons indicating the availability status of each application server. The icons are links, and the links are part of the Diagnostics Pack.
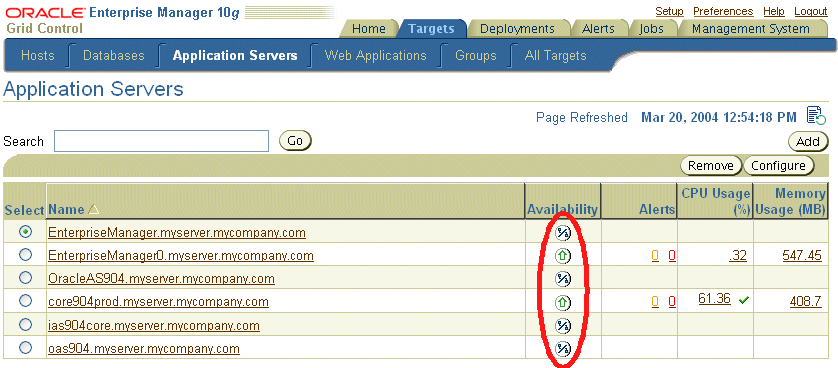
When you choose the Web Applications sub-tab, you get a table that lists your deployed applications and various information about each one.
In the Status column of the table, there are icons indicating the condition of each application. The icons are links, and the links are part of the Diagnostics Pack.
In the Availability column of the table, there are percentages indicating the availability of each application. These percentages are links, and the links are part of the Diagnostics pack.
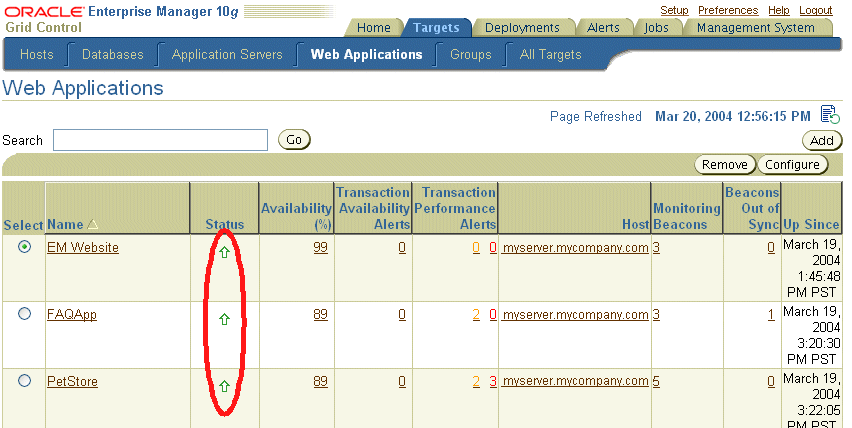
When you choose the Alerts tab in the Grid Control Console, you get a row of sub-tabs categorizing the alerts.
When you choose any of the sub-tabs, you get a table that lists all targets in the sub-tab category and various information about each one.
Each table has a Message column. The Message column contains a brief statement about the target. These statements are links, and the links are part of the Diagnostics Pack.

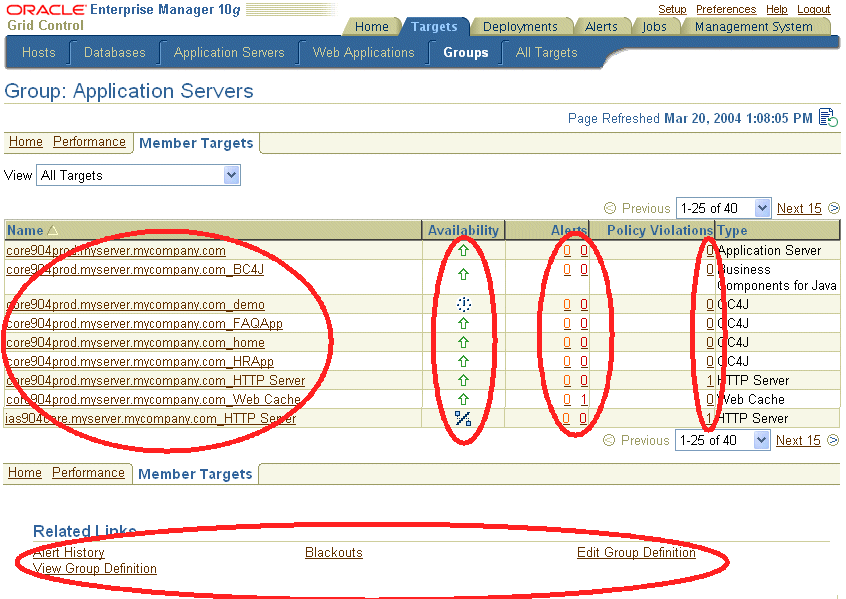
When you choose the Targets tab, then the Groups sub-tab, there is a table that lists your targets by group. When you choose the Application Server group link from the table, it takes you to the Application Server Group Home Page.
On the Home sub-tab, there is an Alerts section.
In the Alerts section, there are icons and links that indicate the type and number of alerts. The icons are also links, and both of these sets of links are part of the Diagnostics Pack.
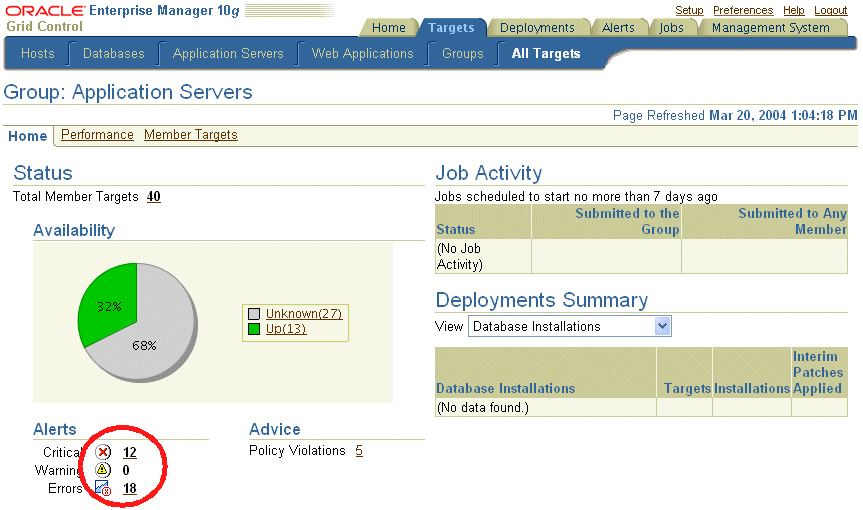
At the bottom of the Home sub-tab, there is a Related Links section. Three of the links in this section are part of the Diagnostics Pack:
Alert History
Blackouts
Summary Metrics

When you choose the Targets tab, then the Groups sub-tab, there is a table that lists your targets by group. When you choose the Application Server group link from the table, it takes you to the Application Server Group Home Page.
When you choose the Member Targets sub-tab of the Application Server Group Home Page, there is a table that lists that application server’s components and various information about each one.
All of the links on the Member Targets page are part of the Diagnostics Pack. This includes links in the Availability, Alerts, and Policy Violations columns.
You can access application server home pages from the Application Servers sub-tab of the Targets tab. From an application server home page, you can access the component home pages for each component of that application server.
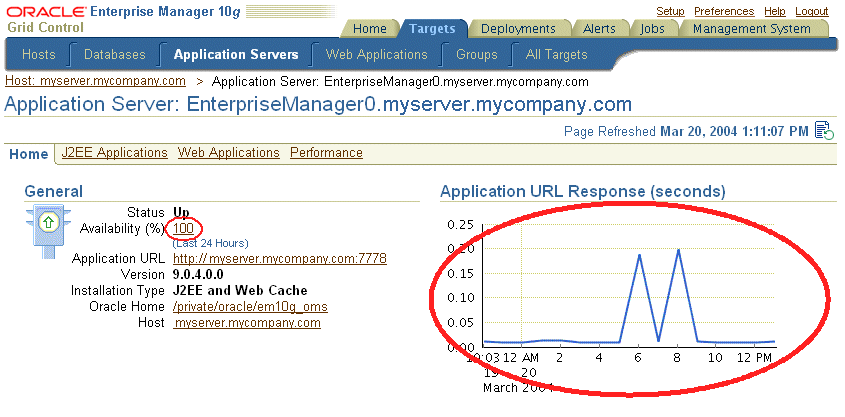
On the application server or component home page, there is a General section at the top of the page.
The General section lists the Availability % for the application server. This number is a link, and the link is part of the Diagnostics Pack.
Next to the General section on the home page is a chart. For application servers this is the Application URL Response chart, and for components it is a specific component-level performance overview chart.
The chart on each page is a link, and the link is part of the Diagnostics Pack.
On the application server home page, there is a Components section that lists the application server components and their current status.
In the Current Status column, the icons that indicate the status are links, and the link are part of the Diagnostics Pack.
On the application server and component home pages, there is an Alerts section. The Metric column contains a brief statement describing the alert.
In the Metric column, the alert statement is a link, and the link is part of the Diagnostics Pack.

At the bottom of the application server and component home pages, there is a Related Links section. Two of the links in this section are part of the Diagnostics Pack:
Alert History
Blackouts

Additionally, when you choose the Manage Metrics link in this section, the Metric Baselines sub-tab on the Manage Metrics page is part of the Diagnostics Pack.

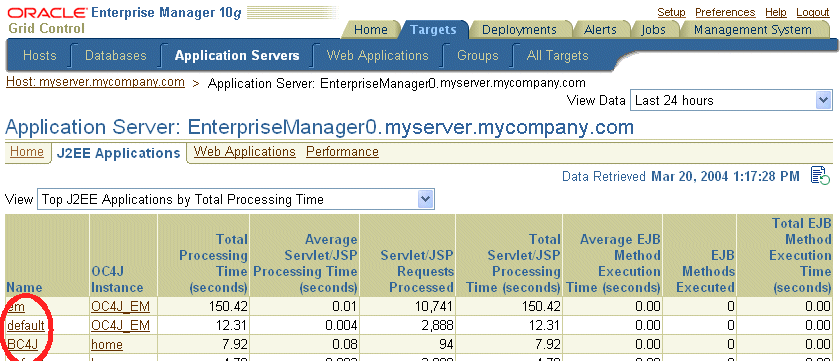
You can access application server home pages from the Application Servers sub-tab of the Targets tab. The J2EE Applications sub-tab is located on these pages.
On the J2EE Applications page there is a table that lists all of your J2EE applications and various information about each one.
In the J2EE Applications table, in the Name column, the name of each application is a link. These links are part of the Diagnostics Pack.
You can access the application server home pages from the Application Servers sub-tab of the Targets tab. The Web Applications sub-tab is located on these pages.
On the Web Applications page there is a table that lists all of your Web applications and their status.
In the table, all of the links in both the Status and Name columns are part of the Diagnostics Pack.

You can access the application server home pages from the Application Servers sub-tab of the Targets tab. The Performance sub-tab is located on these pages.
The entire Performance page and all of the links contained on it are part of the Diagnostics Pack.

You can access the application server home pages from the Application Servers sub-tab of the Targets tab. The Components section of the application server home page has a link to the OC4J component home page.
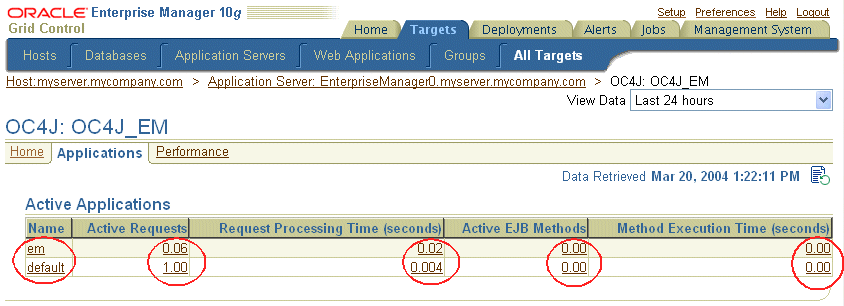
On the OC4J component home page, there is an Applications sub-tab.
All links on the Applications page are part of the Diagnostics Pack.
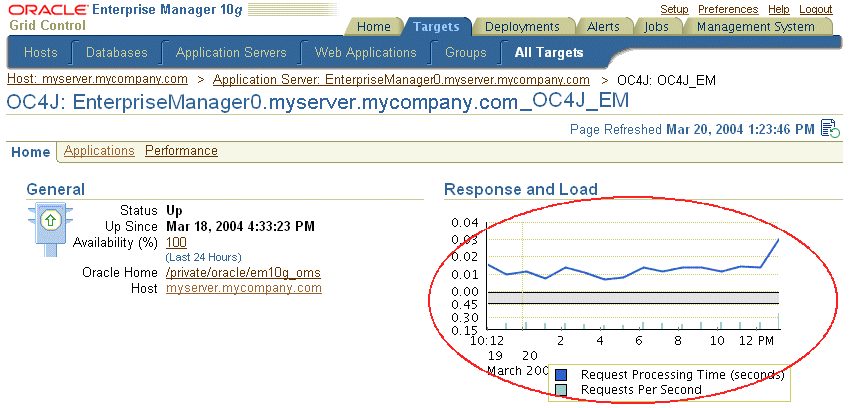
There is a Response and Load section on the OC4J component home page that displays a chart.
The chart is a link, and the link is part of the Diagnostics Pack.
On the OC4J component home page, there is an Alerts section. The Metric column contains a brief statement describing the alert.
In the Metric column, the alert statements are links, and the links are part of the Diagnostics Pack.

At the bottom of the OC4J home page, there is a Related Links section. Two of the links in this section are part of the Diagnostics Pack:
Alert History
Blackouts

Additionally, when you choose the Manage Metrics link in this section, the Metric Baselines sub-tab on the Manage Metrics page is part of the Diagnostics Pack.

You can access Web application home pages from the Web Applications sub-tab of the Targets tab. From a Web application home page, you can access the application home page for each application.
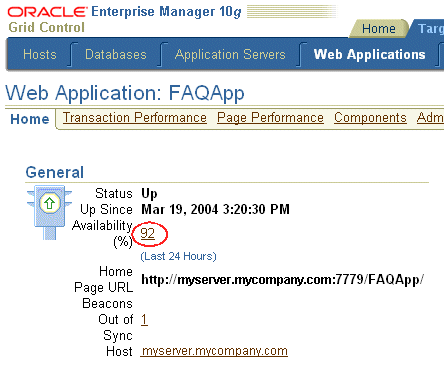
On the application home page, there is a General section at the top of the page.
The General section lists the Availability % for the application. This number is a link, and the link is part of the Diagnostics Pack.
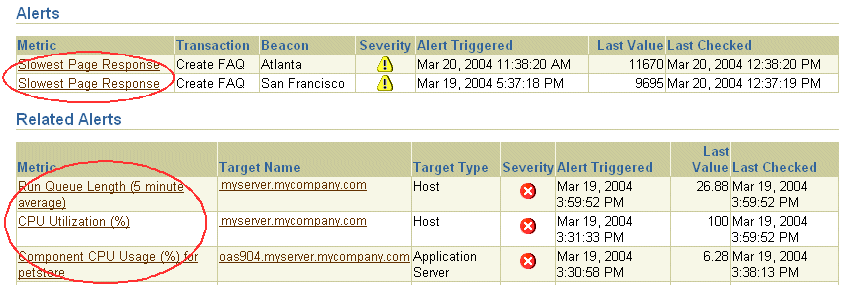
On the application home page, there is an Alerts section. The Metric column contains a brief statement describing the alert.
In the Metric column, the alert statement is a link, and the link is part of the Diagnostics Pack.
On the application home page, there is a Related Alerts section. The Metric column contains a brief statement describing the alert.
In the Metric column, the alert statement is a link, and the link is part of the Diagnostics Pack.
At the bottom of the application home page, there is a Related Links section. Two of the links in this section are part of the Diagnostics Pack:
Alert History
Blackouts

You can access Web application home pages from the Web Applications sub-tab of the Targets tab. The Transaction Performance sub-tab is located on these pages.
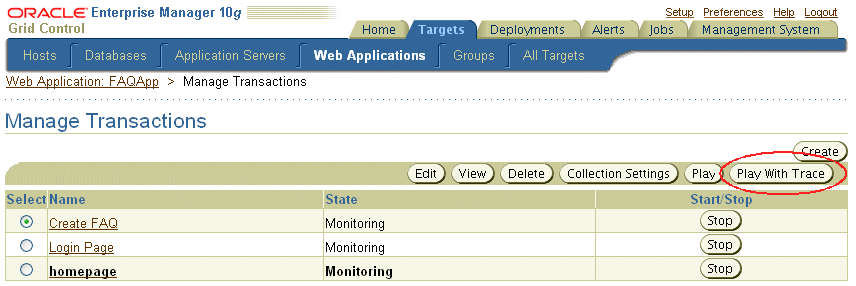
At the bottom of the Web application home page there is an All Transactions section. In this section there is a Manage Transactions button, which takes you to the Manage Transactions page.
On the Manage Transactions page, the Play with Trace button is part of the Diagnostics Pack.
You can access Web application home pages from the Web Applications sub-tab of the Targets tab. The Page Performance sub-tab is located on these pages.
The entire Page Performance page is part of the Diagnostics Pack.

When you choose the Targets tab, then the Groups sub-tab, there is a table that lists your targets by group. When you choose the Application Hosts group link from the table, it takes you to the Application Hosts Group Home Page. To access a particular host home page, choose the Member Targets sub-tab and click the name of the host you want to view.
On the host home page, there is a General section at the top of the page.
The General section lists the Availability % for the host. This number is a link, and the link is part of the Diagnostics Pack.
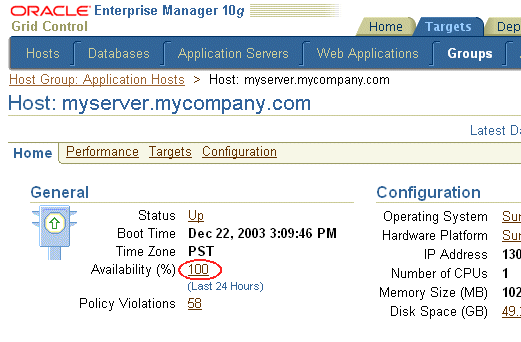
On the application home page, there is an Alerts section. The Metric Name column contains a brief statement describing the alert.
In the Metric Name column, the alert statement is a link, and the link is part of the Diagnostics Pack.

At the bottom of the application home page, there is a Related Links section. Four of the links in this section are part of the Diagnostics Pack:
All Metrics
Alert History
Blackouts
User Defined Metrics

Additionally, when you choose the Manage Metrics link in this section, the Metric Baselines sub-tab on the Manage Metrics page is part of the Diagnostics Pack.

From the host home page, you can access the Performance sub-tab for that host.
The entire Performance page is part of the Diagnostics Pack.

From the host home page, you can access the Targets sub-tab for that host.
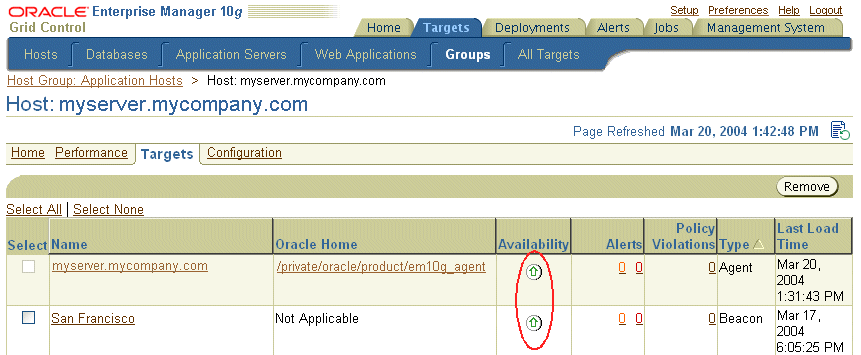
On the host targets page, there is a table that lists the current host’s targets and various information about each one.
In the Availability column, the icons that indicate the availability are links, and the links are part of the Diagnostics Pack.
The Oracle Application Server Configuration Management Pack enables application server administrators to track hardware and software configuration information for hosts and software managed by Enterprise Manager. That information can then be browsed, searched, compared, exported, and tracked historically. The pack also offers policy management and patch management capabilities based on the configuration information. Finally, to facilitate deployments, cloning functionality for application server instances is also provided. The Configuration Management Pack provides configuration management features in the following areas:
Application Servers and hosts
Deployments
Patch Database and View Patch Cache
Staging patches
Cloning
Search configuration
Compare Hosts
Compare Application Servers
Policies
In order to use the features listed above, you must purchase licenses to the Oracle Application Server Configuration Management Pack. The following list itemizes the Enterprise Manager links that require licensing of the Configuration Management Pack.
|
Note: All Oracle Enterprise Manager 10g Application Server Control functionality is free and included with each edition of Oracle Application Server. The links and areas that require the Configuration Management Pack are all part of Oracle Enterprise Manager 10g Grid Control, and are listed in bold. |
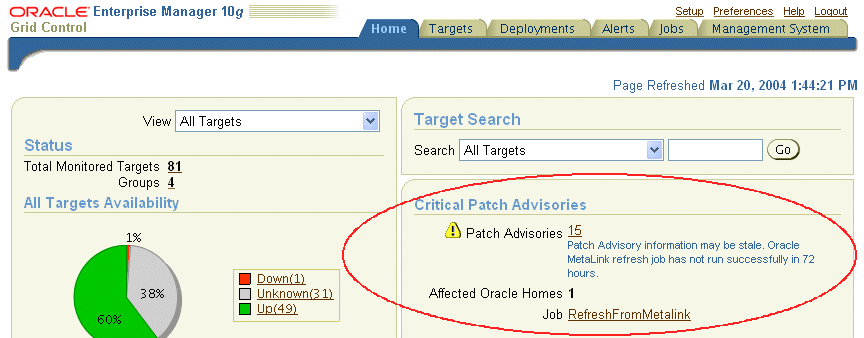
On the Grid Control Home Page, there is a Critical Patch Advisories section.
All of the links in the Critical Patch Advisories section are part of the Configuration Management Pack.
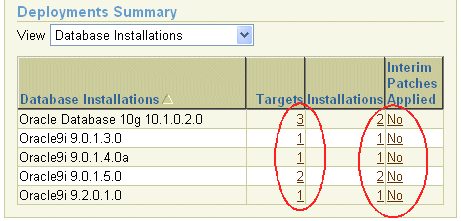
There is also a Deployments Summary section on the Grid Control Home Page.
All of the links in the Deployments Summary section are part of the Configuration Management Pack.
On the Grid Control Home Page, there is a Deployments tab.
The entire Deployments page is part of the Configuration Management Pack.

When you choose the Targets tab in the Grid Control Console, you get a row of sub-tabs categorizing the targets.
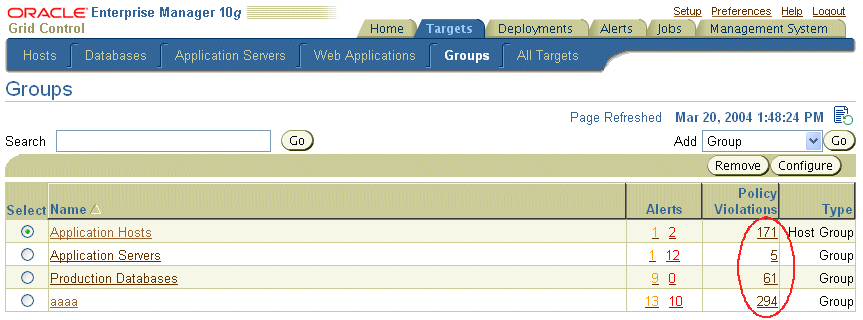
When you choose the Groups sub-tab, you get a table that lists your targets in groups, with information about each one.
In the Policy Violations column of the table, there are links indicating the number of policy violations for each group. These links are part of the Configuration Management Pack.
You can access application server home pages from the Application Servers sub-tab of the Targets tab.
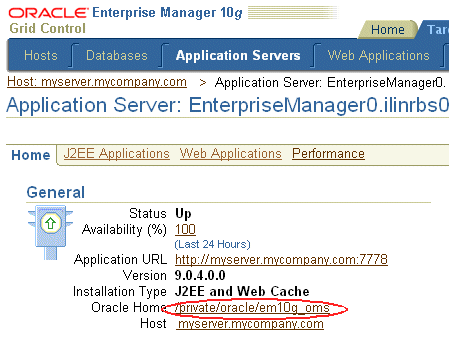
On the application server home page, there is a General section at the top of the page.
The General section shows the Oracle Home for the application server. The path to the Oracle Home is a link, and the link is part of the Diagnostics Pack.
From the Targets page, when you choose the All Targets sub-tab, you can access the home page for all of your application hosts.
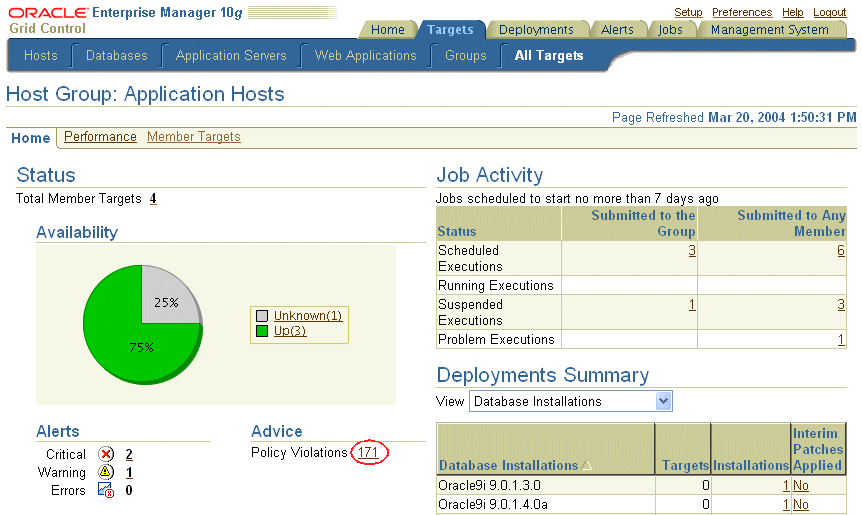
On the Hosts Group page, there is an Advice section.
The Advice section lists the number of Policy Violations for the host group. This number is a link, and the link is part of the Configuration Management Pack.
From the Host Group page, you can choose the Member Targets sub-tab to list all of the application hosts in the group. Click the name of the host to go to the individual host home page.
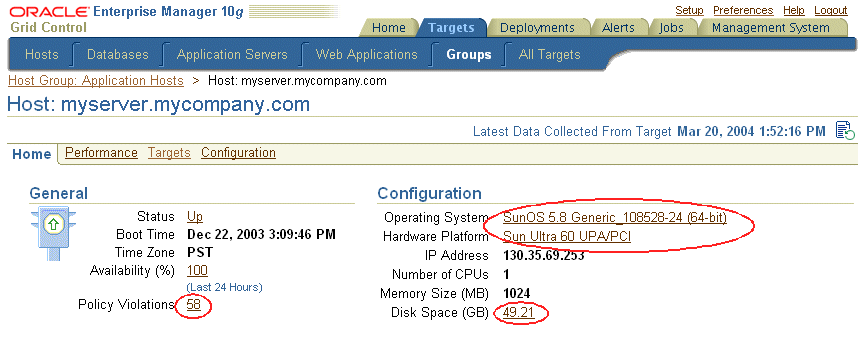
On the right side of the host home page there is a Configuration section.
All of the links in the Configuration section are part of the Configuration Management Pack.
On the left side of the host home page there is a General section.
The General section lists the number of Policy Violations for the host. The number is a link, and the link is part of the Configuration Management Pack.
At the bottom of the host home page, there is a Related Links section. Three of the links in this section are part of the Configuration Management Pack:
Deployments
User Defined Metrics
Blackouts

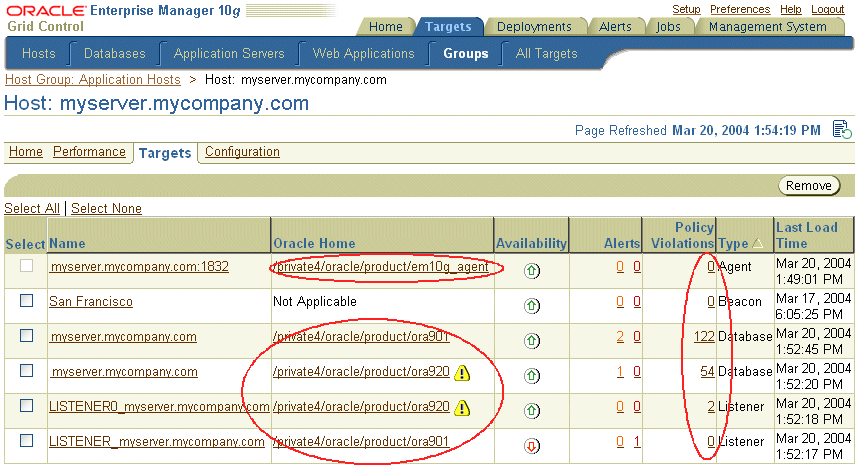
When you choose the Targets sub-tab on the host home page, there is a table that lists all of the targets for the host and various information about each one.
In the table there is an Oracle Home column that lists the location of the target.
The links in the Oracle Home column are part of the Configuration Management Pack.
There is also a Policy Violations column in the table.
The links in the Policy Violations columns are part of the Configuration Management Pack.
On the host home page, there is a Configuration sub-tab.
The entire Configuration page is part of the Configuration Management Pack.
