| Oracle® Enterprise Manager Cloud Control Extensibility Programmer's Reference 12c Release 2 (12.1.0.2) Part Number E25161-06 |
|
|
PDF · Mobi · ePub |
| Oracle® Enterprise Manager Cloud Control Extensibility Programmer's Reference 12c Release 2 (12.1.0.2) Part Number E25161-06 |
|
|
PDF · Mobi · ePub |
You can extend Enterprise Manager to monitor Web services and JMX-instrumented applications for critical events, performance problems, error conditions, and statistics.
Enterprise Manager's ability to monitor WSDL and JMX-enabled targets enables you to consolidate monitoring and management operations. When added to the Enterprise Manager framework, Enterprise Manager functionality, such as notifications, jobs, and reporting, is automatically extended to these targets.
This chapter contains the following topics:
Monitoring JMX Applications Deployed on Oracle Application Servers (OC4J)
Monitoring a Standalone JMX-instrumented Java Application or JVM Target
Monitoring JMX Applications Deployed on Oracle WebLogic Application Servers
Using Enterprise Manager to monitor targets that expose a Web services management interface, JMX-instrumented applications and servers, and standalone Java Virtual Machine (JVM) targets entails defining a new target type via metadata plug-ins.
Creating a metadata plug-in consists of four basic steps:
Generate the target metadata and default collection files to be added to the plug-in.
Create an Oracle Plug-in Archive containing the target definition files for one or more plug-ins. A single archive may contain more than one plug-in.
Import the plug-in into Enterprise Manager.
Deploy the plug-in to the appropriate Management Agents.
For more information about each of these steps, see Chapter 13, "Validating, Packaging, and Deploying the Plug-in".
Procedural information for the monitoring targets can be found in the following sections:
Section 16.2 discusses software components exposing an external interface that communicate across a network using a standard messaging protocol.
Section 16.4 discusses J2EE applications running on an OC4J that are instrumented using JMX MBeans.
Section 16.5 discusses standalone Java applications running on J2SE5.0 or higher that are instrumented using JMX MBeans.
Section 16.6 discusses JMX applications running on Oracle WebLogic Application Servers 9.x or above.
Section 16.4 and Section 16.5 explain how to generate metadata and default collection files for your custom JMX-enabled application by guiding you through the MBeans for which you are interested in collecting data, and helping you define the MBeans as metrics in Enterprise Manager. Even if your standalone Java application is not instrumented through JMX, you can still monitor the JVMs it is running on by directly creating the built-in JVM target instances as defined in Section 16.7.3.
After the metadata and default collection files are created, you can follow the normal metadata plug-in mechanism to deploy your plug-in and create target instances of your Java application target type.
Web services are loosely coupled software components that expose an external interface via the Web Service Definition Language (WSDL). These components communicate across a network using a standard messaging protocol called Simple Object Access Protocol (SOAP). The Management Agent's Web service Fetchlet (with ID WSF) supports SOAP communication.
Note:
For more information about the Web services standard, see the World Wide Web Consortium (W3C) website:http://www.w3.org
Management Agent version 12.1.0.0.0 or later installed on that host.
Oracle Management Server (OMS) version 12.1.0.0.0 or later with which the Management Agent communicates.
Defining a target type to be monitored through a Web services interface includes creating the requisite target definition files, which are required to collect metrics from resources that support the WSDL interface:
Target Metadata
Default Collection
Enterprise Manager provides an easy-to-use Web services command-line tool that simplifies creating plug-ins by automatically generating these requisite files. Information retrieval is achieved through the Web services fetchlet that is integrated with the Management Agent.
The command-line tool works by parsing a specified WSDL file for all operations, and enables you to select one or more operations to be invoked. If multiple port types are specified in the WSDL file, the tool prompts you to select one of them. Operations are listed along with their parameters. A Web service operation can be one of four types:
One Way
Request Response
Solicit Response
Notification
The Request Response operation type is particularly useful: The selected operation could have primitive or complex parameters and results. The result of Web service invocation is displayed in a table (the tool prompts you to provide labels for the table columns). You can also filter result attributes by specifying an Xpath expression (see the RowType property in the generated target metadata, Example 16-3). Filter attributes can be useful for complex return types from which only few attributes are interesting.
The Web services command-line tool supports Web services with the following binding and encoding styles:
DOC/literal
DOC/Wrapped
RPC/encoded
The Web services CLI command-line tool syntax is as follows:
emctl wscli [-metadata | -help] [-options]
The command accepts the following options:
-wsdl=file | URL: WSDL file or URL (mandatory)
-username=user ID: user name if the WSDL is protected
The command-line tool requires a WSDL file name or URL to locate the WSDL for a Web service. For example, for a Calculator service Web service, a WSDL URL would be as follows:
http://localhost:44861/CalWS/CalculatorPort?WSDL
The command tool script requires access to the Enterprise Manager home directory (EM_HOME) to run. The tool defaults to ORACLE_HOME (ensure this environment variable is set properly before using this tool).
The tool parses specified WSDL for all the port types and binding (supported protocols such as HTTP get/post, SOAP) to list all the operations. If there are multiple port types in WSDL, you will first be prompted to choose a port type.
The command-line tool generates metadata required by Enterprise Manager for target monitoring purposes through the WSDL file. When you run this tool, you only require read permission on the WSDL file or URL and permission to save generated files to the appropriate directory.
Example 16-1 shows a sample WSDL file passed to the command-line tool to generate the target metadata and collection files.
Example 16-1 Sample WSDL File CalculatorService.wsdl
<?xml version="1.0" encoding="UTF-8"?>
<!-- Published by JAX-WS RI at http://jax-ws.dev.java.net. RI's version is Oracle JAX-WS 2.1.5. -->
<wsdl:definitions xmlns:wsdl="http://schemas.xmlsoap.org/wsdl/"
xmlns:tns="http://tests.jaxws.oracle.com/"
xmlns:ns0="http://www.oracle.com/jaxws/tests"
xmlns:xsd="http://www.w3.org/2001/XMLSchema"
xmlns:mime="http://schemas.xmlsoap.org/wsdl/mime/"
xmlns:soap="http://schemas.xmlsoap.org/wsdl/soap/"
xmlns:soap12="http://schemas.xmlsoap.org/wsdl/soap12/" name="CalculatorService" targetNamespace="http://tests.jaxws.oracle.com/">
    <wsdl:types>
        <xs:schema xmlns:xs="http://www.w3.org/2001/XMLSchema" version="1.0" targetNamespace="http://www.oracle.com/jaxws/tests/types">
            <xs:complexType name="calculatorFaultInfo">
                <xs:sequence>
                    <xs:element name="number" type="xs:int"/>
                    <xs:element name="reason" type="xs:string" minOccurs="0"/>
                </xs:sequence>
            </xs:complexType>
        </xs:schema>
        <xs:schema xmlns:ns1="http://www.oracle.com/jaxws/tests/types" xmlns:tns="http://www.oracle.com/jaxws/tests" xmlns:xs="http://www.w3.org/2001/XMLSchema" version="1.0" targetNamespace="http://www.oracle.com/jaxws/tests">
            <xs:import namespace="http://www.oracle.com/jaxws/tests/types"/>
            <xs:element name="CalculatorException" nillable="true" type="tns:CalculatorException"/>
            <xs:element name="CalculatorWrapperException" nillable="true" type="ns1:calculatorFaultInfo"/>
            <xs:complexType name="CalculatorException">
                <xs:sequence>
                    <xs:element name="Message" type="xs:string"/>
                    <xs:element name="Number" type="xs:int"/>
                    <xs:element name="Reason" type="xs:string"/>
                </xs:sequence>
            </xs:complexType>
        </xs:schema>
        <schema xmlns="http://www.w3.org/2001/XMLSchema" xmlns:xsd="http://www.w3.org/2001/XMLSchema" xmlns:tns="http://tests.jaxws.oracle.com/" targetNamespace="http://tests.jaxws.oracle.com/">
            <xsd:complexType name="add">
                <xsd:sequence>
                    <xsd:element name="arg0" type="xsd:int"/>
                    <xsd:element name="arg1" type="xsd:int"/>
                </xsd:sequence>
            </xsd:complexType>
            <xsd:element name="add" type="tns:add"/>
            <xsd:complexType name="addResponse">
                <xsd:sequence>
                    <xsd:element name="return" type="xsd:int"/>
                </xsd:sequence>
            </xsd:complexType>
            <xsd:element name="addResponse" type="tns:addResponse"/>
            <xsd:complexType name="square">
                <xsd:sequence>
                    <xsd:element name="arg0" type="xsd:int"/>
                </xsd:sequence>
            </xsd:complexType>
            <xsd:element name="square" type="tns:square"/>
            <xsd:complexType name="squareResponse">
                <xsd:sequence>
                    <xsd:element name="arg0" type="xsd:int"/>
                </xsd:sequence>
            </xsd:complexType>
            <xsd:element name="squareResponse" type="tns:squareResponse"/>
            <xsd:complexType name="checkNumber">
                <xsd:sequence>
                    <xsd:element name="arg0" type="xsd:int"/>
                </xsd:sequence>
            </xsd:complexType>
            <xsd:element name="checkNumber" type="tns:checkNumber"/>
            <xsd:complexType name="checkNumberResponse">
                <xsd:sequence>
                    <xsd:element name="return" type="xsd:boolean"/>
                </xsd:sequence>
            </xsd:complexType>
            <xsd:element name="checkNumberResponse" type="tns:checkNumberResponse"/>
        </schema>
    </wsdl:types>
    <wsdl:message name="addInput">
        <wsdl:part name="parameters" element="tns:add"/>
    </wsdl:message>
    <wsdl:message name="addOutput">
        <wsdl:part name="parameters" element="tns:addResponse"/>
    </wsdl:message>
    <wsdl:message name="squareInput">
        <wsdl:part name="parameters" element="tns:square"/>
    </wsdl:message>
    <wsdl:message name="squareOutput">
        <wsdl:part name="parameters" element="tns:squareResponse"/>
    </wsdl:message>
    <wsdl:message name="checkNumberInput">
        <wsdl:part name="parameters" element="tns:checkNumber"/>
    </wsdl:message>
    <wsdl:message name="checkNumberOutput">
        <wsdl:part name="parameters" element="tns:checkNumberResponse"/>
    </wsdl:message>
    <wsdl:message name="CalculatorWrapperException">
        <wsdl:part name="CalculatorWrapperException" element="ns0:CalculatorWrapperException"/>
    </wsdl:message>
    <wsdl:message name="CalculatorException">
        <wsdl:part name="CalculatorException" element="ns0:CalculatorException"/>
    </wsdl:message>
    <wsdl:portType name="Calculator">
        <wsdl:operation name="add">
            <wsdl:input xmlns:ns1="http://www.w3.org/2006/05/addressing/wsdl" message="tns:addInput" ns1:Action=""/>
            <wsdl:output xmlns:ns1="http://www.w3.org/2006/05/addressing/wsdl" message="tns:addOutput" ns1:Action=""/>
        </wsdl:operation>
        <wsdl:operation name="square">
            <wsdl:input xmlns:ns1="http://www.w3.org/2006/05/addressing/wsdl" message="tns:squareInput" ns1:Action=""/>
            <wsdl:output xmlns:ns1="http://www.w3.org/2006/05/addressing/wsdl" message="tns:squareOutput" ns1:Action=""/>
        </wsdl:operation>
        <wsdl:operation name="checkNumber">
            <wsdl:input xmlns:ns1="http://www.w3.org/2006/05/addressing/wsdl" message="tns:checkNumberInput" ns1:Action=""/>
            <wsdl:output xmlns:ns1="http://www.w3.org/2006/05/addressing/wsdl" message="tns:checkNumberOutput" ns1:Action=""/>
            <wsdl:fault name="CalculatorWrapperException" message="tns:CalculatorWrapperException"/>
            <wsdl:fault name="CalculatorException" message="tns:CalculatorException"/>
        </wsdl:operation>
    </wsdl:portType>
    <wsdl:binding name="CalculatorSoapHttp" type="tns:Calculator">
        <soap:binding style="document" transport="http://schemas.xmlsoap.org/soap/http"/>
        <wsdl:operation name="add">
            <soap:operation soapAction=""/>
            <wsdl:input>
                <soap:body use="literal"/>
            </wsdl:input>
            <wsdl:output>
                <soap:body use="literal"/>
            </wsdl:output>
        </wsdl:operation>
        <wsdl:operation name="square">
            <soap:operation soapAction=""/>
            <wsdl:input>
                <soap:body use="literal"/>
            </wsdl:input>
            <wsdl:output>
                <soap:body use="literal"/>
            </wsdl:output>
        </wsdl:operation>
        <wsdl:operation name="checkNumber">
            <soap:operation soapAction=""/>
            <wsdl:input>
                <soap:body use="literal"/>
            </wsdl:input>
            <wsdl:output>
                <soap:body use="literal"/>
            </wsdl:output>
            <wsdl:fault name="CalculatorWrapperException">
                <soap:fault name="CalculatorWrapperException" use="literal" encodingStyle=""/>
            </wsdl:fault>
            <wsdl:fault name="CalculatorException">
                <soap:fault name="CalculatorException" use="literal" encodingStyle=""/>
            </wsdl:fault>
        </wsdl:operation>
    </wsdl:binding>
    <wsdl:service name="CalculatorService">
        <wsdl:port name="CalculatorPort" binding="tns:CalculatorSoapHttp">
            <soap:address location="http://localhost:8888/CalWSBA/CalculatorPort"/>
        </wsdl:port>
    </wsdl:service>
</wsdl:definitions>
Example 16-2 uses the WSDL file shown in Example 16-1, "Sample WSDL File CalculatorService.wsdl". First, the tool parses the WSDL for all port types and bindings (supported protocols such as HTTP get/post or SOAP) to list all the operations. If there are multiple port types in the WSDL, the tool first prompts you to select a port type.
To start the command-line tool:
Go to the $AGENT_HOME/bin directory.
Run the following command:
$ emctl wscli -metadata -wsdl=/tmp/CalculatorWS.wsdl
Once invoked, the command-line tool automatically prompts you for the requisite information, as shown in Example 16-2, "Sample Web Services Command-Line Tool Session". If you need to quit a command-line tool session, you can press Ctrl+C at any point to exit. Session information will not be saved.
Example 16-2 Sample Web Services Command-Line Tool Session
Oracle Enterprise Manager 12c Release 1 Cloud Control 12.1.0.1.0
Copyright (c) 1996, 2011 Oracle Corporation.  All rights reserved.

OracleHome : /oracle/oms/agent
EMDROOT    : /oracle/oms/agent

Generate Metric Metadata for Web Service Monitoring

Reading WSDL Document at /tmp/CalculatorWS.wsdl...done.

==> Enter the metadata file name [/tmp/target/metadata/CalculatorService.xml] :

* Selected Service: CalculatorService

* Selected Port: CalculatorPort

All operations for the selected Port "CalculatorPort":
[1]   squareResponse square(int arg0)
[2]   checkNumberResponse checkNumber(int arg0)
[3]   addResponse add(int arg0, int arg1)

==> Enter the index [1-3] of operation to select: 1
* Selected Operation:
    squareResponse square(int arg0)

Define new metric group:
==> Enter the name for this metric group [square]:

Return value(s) for the selected operation:
[1]   //ns0:squareResponse/arg0 <int>

==> Enter the index [1-1] of metric to display: 1
==> Enter the name for this metric [arg0]: SquareResult
==> Enter the label for this metric [SquareResult]:
==> Is this a key metric <y/n>? [n] :
==> Do you want to create threshold for this item <y/n>? [n] :


Setup operation Argument: square.arg0 <type:int>
==>   Enter value [%square.arg00001%] :

==> Do you want to use jps-config-jse.xml <y/n>? [n] :

==> Do you want to add User/Password Credential <y/n>? [n] : y
==> Enter the name for User/Password credential set [UserCredentialSet01] :

==> Do you want to add SSL TrustStore Credential <y/n>? [n] :

==> Do you want to add SSL KeyStore Credential <y/n>? [n] :

==> Do you want to add KeyStore Credential <y/n>? [n] :

==> Do you want to add Encryption Key Credential <y/n>? [n] :

==> Do you want to add Signature Key Credential <y/n>? [n] :

==> Is this metric group for periodic collection <y/n>? [y] :
The following units are for collection frequency:
[1]   Min
[2]   Hr
[3]   Day

==> Enter the index [1-3] of unit for this collection: 1
==> Enter the frequency of collection in Min: 30

==> Do you want to add another metric group <y/n>? [n] :

Files Generated:
- Target Metadata file: /tmp/target/metadata/CalculatorService.xml
- Target Collection file: /tmp/target/metadata/CalculatorServiceCollection.xml
The command-line tool generates the metadata required to monitor the CalculatorService target type as shown in Example 16-3.
Example 16-3 CalculatorService Target Metadata File
<!DOCTYPE TargetMetadata SYSTEM "../dtds/TargetMetadata.dtd">
<TargetMetadata META_VER="1.0" TYPE="CalculatorService">
  <Display>
    <Label NLSID="NLSID_CALCULATOR_SERVICE">CalculatorService</Label>
    <ShortName NLSID="NLSID_CALCULATOR_SERVICE">CalculatorService</ShortName>
    <Description NLSID="NLSID_CALCULATOR_SERVICE">CalculatorService</Description>
  </Display>
  <Metric NAME="square" TYPE="TABLE">
    <Display>
      <Label NLSID="NLSID_SQUARE">square</Label>
    </Display>
    <TableDescriptor>
      <ColumnDescriptor IS_KEY="FALSE" NAME="SquareResult" TYPE="STRING">
        <Display>
          <Label NLSID="COL_SQUARE_RESULT">SquareResult</Label>
        </Display>
      </ColumnDescriptor>
    </TableDescriptor>
    <QueryDescriptor FETCHLET_ID="WSF">
      <Property NAME="ProxyHost" SCOPE="INSTANCE" OPTIONAL="TRUE">ProxyHost</Property>
      <Property NAME="ProxyPort" SCOPE="INSTANCE" OPTIONAL="TRUE">ProxyPort</Property>
      <Property NAME="SecurityPolicy" SCOPE="INSTANCE" OPTIONAL="FALSE">square.SecurityPolicy</Property>
      <Property NAME="ServiceEndpoint" SCOPE="INSTANCE" OPTIONAL="FALSE">square.ServiceEndpoint</Property>
      <Property NAME="ServiceName" SCOPE="GLOBAL" OPTIONAL="FALSE">ns0:CalculatorService</Property>
      <Property NAME="PortName" SCOPE="GLOBAL" OPTIONAL="FALSE">ns0:CalculatorPort</Property>
      <Property NAME="OperationName" SCOPE="GLOBAL" OPTIONAL="FALSE">square</Property>      <Property NAME="MessageType" SCOPE="GLOBAL" OPTIONAL="FALSE">SOAP</Property>
      <Property NAME="SOAPBindingStyle" SCOPE="GLOBAL" OPTIONAL="FALSE">DOCUMENT</Property>
      <Property NAME="SOAPBindingUse" SCOPE="GLOBAL" OPTIONAL="FALSE">LITERAL</Property>
      <Property NAME="ParameterStyle" SCOPE="GLOBAL" OPTIONAL="FALSE">WRAPPED</Property>
      <Property NAME="SOAPVersion" SCOPE="GLOBAL" OPTIONAL="FALSE">SOAP_1_1</Property>
      <Property NAME="Namespace" SCOPE="GLOBAL" OPTIONAL="FALSE"><![CDATA[[ns0="http://tests.jaxws.oracle.com/"]]]></Property>
      <Property NAME="RowType" SCOPE="GLOBAL" OPTIONAL="FALSE">//ns0:squareResponse/arg0</Property>
      <Property NAME="ColType" SCOPE="GLOBAL" OPTIONAL="FALSE">SquareResult:STRING</Property>
      <Property NAME="Payload" SCOPE="GLOBAL" OPTIONAL="FALSE"><![CDATA[<soap:Envelope xmlns:soap="http://schemas.xmlsoap.org/soap/envelope/">
            <soap:Body xmlns:ns1="http://tests.jaxws.oracle.com/">
              <ns1:square>
                <arg0>%square.arg00001%</arg0>
              </ns1:square>
            </soap:Body>
          </soap:Envelope>]]></Property>
      <Property NAME="UserCredential" SCOPE="GLOBAL" OPTIONAL="FALSE">UserCredentialSet01</Property>
      <CredentialRef NAME="UserCredentialSet01">UserCredentialSet01</CredentialRef>
    </QueryDescriptor>
  </Metric>
  <CredentialInfo>
    <CredentialType NAME="CSFKeyCredential">
      <Display>
        <Label NLSID="CRED_TYPE">CSF-Key Credential Type</Label>
      </Display>
      <CredentialTypeColumn NAME="CSFKey">
        <Display>
          <Label NLSID="CRED_C_S_F_KEY">Alias CSF Key</Label>
        </Display>
      </CredentialTypeColumn>
    </CredentialType>
    <CredentialType NAME="AliasCredential">
      <Display>
        <Label NLSID="CRED_TYPE">Alias Credential Type</Label>
      </Display>
      <CredentialTypeColumn NAME="Alias">
        <Display>
          <Label NLSID="CRED_ALIAS">Alias (i.e. username, encryption key, signature key, etc)</Label>
        </Display>
      </CredentialTypeColumn>
      <CredentialTypeColumn NAME="Password">
        <Display>
          <Label NLSID="CRED_PASSWORD">Password for the alias</Label>
        </Display>
      </CredentialTypeColumn>
    </CredentialType>
    <CredentialSet NAME="UserCredentialSet01" USAGE="MONITORING">
      <AllowedCredType TYPE="CSFKeyCredential"/>
      <AllowedCredType TYPE="AliasCredential"/>
    </CredentialSet>
  </CredentialInfo>
  <InstanceProperties>
    <InstanceProperty NAME="ProxyHost" CREDENTIAL="FALSE" OPTIONAL="TRUE">
      <Display>
        <Label NLSID="PROP_PROXY_HOST">Proxy Server Name</Label>
      </Display>
    </InstanceProperty>
    <InstanceProperty NAME="ProxyPort" CREDENTIAL="FALSE" OPTIONAL="TRUE">
      <Display>
        <Label NLSID="PROP_PROXY_PORT">Proxy Server Port</Label>
      </Display>
    </InstanceProperty>
    <InstanceProperty NAME="square.SecurityPolicy" CREDENTIAL="FALSE" OPTIONAL="FALSE">
      <Display>
        <Label NLSID="PROP_SQUARE_SECURITY_POLICY">[square] Authentication/Web Service Policy</Label>
      </Display>
    </InstanceProperty>
    <InstanceProperty NAME="square.ServiceEndpoint" CREDENTIAL="FALSE" OPTIONAL="FALSE">
      <Display>
        <Label NLSID="PROP_SQUARE_SERVICE_ENDPOINT">[square] Web Service Endpoint URL</Label>
      </Display>
    </InstanceProperty>
    <InstanceProperty NAME="square.arg00001" CREDENTIAL="FALSE" OPTIONAL="FALSE">
      <Display>
        <Label NLSID="PROP_SQUARE_ARG00001">[square] square.arg0</Label>
      </Display>    </InstanceProperty>  </InstanceProperties></TargetMetadata>
The command-line tool also generates the requisite collection file as shown in Example 16-4.
Example 16-4 CalculatorService Default Collection File
<!DOCTYPE TargetCollection SYSTEM "../dtds/TargetCollection.dtd">
<TargetCollection TYPE="CalculatorService">
  <CollectionItem NAME="square">
    <Schedule>
      <IntervalSchedule TIME_UNIT="Min" INTERVAL="30"/>
    </Schedule>
  </CollectionItem>
</TargetCollection>
After the tool generates the target metadata and collection files, you can create the Oracle Plug-in archive. For more information, see Section 13.4, "Creating the Plug-in Archive".
Beginning with Enterprise Manager 12c, WS-Management (WS-MAN)-compliant resources can be monitored using the fetchlet WSManagementFetchlet.
The fetchlet communicates with the WS-MAN resources using WS-Transfer protocol, which defines a number of management operations that the managed resources should support. However, in the current release, the fetchlet only supports the operation WS-Transfer GET.
Note:
For more information about the monitor WS-Management standard, see the DMTF Web Services Management website:http://www.dmtf.org/standards/wsman
Management Agent version 12.1.0.0.0 or greater installed on that host.
Oracle Management Server (OMS) version 12.1.0.0.0 or greater with which the Management Agent communicates.
Enterprise Manager provides an easy-to-use WS-Management CLI command-line tool that simplifies creating new Management Plug-ins by automatically generating the requisite target metadata and default collection files. Information retrieval is achieved via the WSManagementFetchlet that is integrated with the Management Agent.
Resources, which support WS-Management interface, should describe their model-specific elements using XML Schema Definition (XSD) representation and expose the XSD as a public accessible link just like WSDL for Web services.
The command-line tool works by parsing a specified XSD file for the managed WS-MAN resource and then prompts you to select the interested resource properties to construct a monitoring metric.
The WS-Management CLI command-line tool syntax is as follows:
Usage: emctl wsmancli [-metadata | -help] [-options]
The command accepts the following options:
-schema=file | URL: Resource XSD file or URL [mandatory]
-username=user ID : User name if the schema is protected
The command-line tool requires a XSD file name or URL to locate the resource schema. For example, for a Traffic Light WS-Management service, a XSD URL would be as follows:
http://localhost:8888/TrafficLight?xsd
The command tool script requires access to the Enterprise Manager home directory (EM_HOME) to run. The tool defaults to ORACLE_HOME (ensure this environment variable is set properly before using this tool).
The command-line tool generates metadata required by Enterprise Manager for target monitoring purposes via the resource XSD. When you run this tool, you only need read permission on the XSD file or URL and permission to save generated files to the appropriate directory.
Example 16-5 shows a sample XSD file passed to the command-line tool to generate the target metadata and collection files.
Example 16-5 Sample XSD File TrafficLight.xsd
<?xml version="1.0" encoding="UTF-8"?><xs:schema targetNamespace="http://schemas.wiseman.dev.java.net/traffic/1/light.xsd" elementFormDefault="qualified" blockDefault="#all" xmlns:tl="http://schemas.wiseman.dev.java.net/traffic/1/light.xsd" xmlns:xs="http://www.w3.org/2001/XMLSchema">
        <xs:complexType name="TrafficLightType">
                <xs:sequence>
                        <xs:element name="name" type="xs:string"/>
                        <xs:element name="color" type="xs:string"/>
                        <xs:element name="x" type="xs:int"/>
                        <xs:element name="y" type="xs:int"/>
                </xs:sequence>
        </xs:complexType>
        <xs:element name="trafficlight" type="tl:TrafficLightType"/>
</xs:schema>
To start the command-line tool:
Go to the $AGENT_HOME/bin directory.
Execute the following command:
$ emctl wsmancli -metadata -schema= http://localhost:8080/Traffic?xsd
Once invoked, the command-line tool automatically prompts you for the requisite information, as shown in Example 16-6, "Sample WS-Management CLI Command-Line Tool Session". If you need to quit a command-line tool session, you can press Control+C at any point to exit. Session information will not be saved.
Example 16-6 Sample WS-Management CLI Command-Line Tool Session
Oracle Enterprise Manager 12c Release 1 Cloud Control 12.1.0.0.0
Copyright (c) 1996, 2011 Oracle Corporation.  All rights reserved.

OracleHome : /oracle/oms/agent
EMDROOT    : /oracle/oms/agent

Generate Metric Metadata for WS-Management Resource Monitoring

Reading Resource XSD Document at http://localhost:8080/Traffic?xsd...done.

==> Enter the name for this target type: TrafficLight

==> Enter the metadata file name [/tmp/target/metadata/TrafficLight.xml] :

Define new metric group name:
==> Enter the name for this metric group: trafficLight

WS-Addressing namespaces:
[1]   http://www.w3.org/2005/08/addressing
[2]   http://schemas.xmlsoap.org/ws/2004/08/addressing

==> Enter the index [1-2] to select: 1


SOAP Envelope namespaces:
[1]   http://www.w3.org/2003/05/soap-envelope
[2]   http://schemas.xmlsoap.org/soap/envelope/

==> Enter the index [1-2] to select: 1

Resource properties:
[1]   trafficlight:color
[2]   trafficlight:name
[3]   trafficlight:x
[4]   trafficlight:y

==> Enter the index [1-4] of property to display: 2
==> Enter the name for this metric [name]:
==> Enter the label for this metric [name]:
==> Is this a key metric <y/n>? [n] : y
==> Do you want to add another metric <y/n>? [n] : y

Resource properties:
[1]   trafficlight:color
[2]   trafficlight:x
[3]   trafficlight:y

==> Enter the index [1-3] of property to display: 1
==> Enter the name for this metric [color]:
==> Enter the label for this metric [color]:
==> Is this a key metric <y/n>? [n] :
==> Do you want to create threshold for this item <y/n>? [n] :
==> Do you want to add another metric <y/n>? [n] : y

Resource properties:
[1]   trafficlight:x
[2]   trafficlight:y

==> Enter the index [1-2] of property to display: 1
==> Enter the name for this metric [x]:
==> Enter the label for this metric [x]:
==> Is this a key metric <y/n>? [n] :
==> Do you want to create threshold for this item <y/n>? [n] :
==> Do you want to add another metric <y/n>? [n] : y

Resource properties:
[1]   trafficlight:y

==> Enter the index [1-1] of property to display: 1
==> Enter the name for this metric [y]:
==> Enter the label for this metric [y]:
==> Is this a key metric <y/n>? [n] :
==> Do you want to create threshold for this item <y/n>? [n] :


==> Enter comma-separated list of Selector elements: name

==> Do you want to add User/Password Credential <y/n>? [n] : y
==> Enter the name for User/Password credential set [UserCredentialSet01] :

==> Is this metric group for periodic collection <y/n>? [y] :
The following units are for collection frequency:
[1]   Min
[2]   Hr
[3]   Day

==> Enter the index [1-3] of unit for this collection: 1
==> Enter the frequency of collection in Min: 30

==> Do you want to add another metric group <y/n>? [n] :

Files Generated:
- Target Metadata file: /tmp/target/metadata/TrafficLight.xml
- Target Collection file: /tmp/target/metadata/TrafficLightCollection.xml
The command-line tool generates the metadata required to monitor the target type TrafficLight as shown in Example 16-7.
Example 16-7 TrafficLight Target Metadata File
<!DOCTYPE TargetMetadata SYSTEM "../dtds/TargetMetadata.dtd">
<TargetMetadata META_VER="1.0" TYPE="TrafficLight">
<Display>
<Label NLSID="NLSID_TRAFFIC_LIGHT">TrafficLight</Label>
<ShortName NLSID="NLSID_TRAFFIC_LIGHT">TrafficLight</ShortName>
<Description NLSID="NLSID_TRAFFIC_LIGHT">TrafficLight</Description>
</Display>
<Metric NAME="trafficLight" TYPE="TABLE">
<Display>
<Label NLSID="NLSID_TRAFFIC_LIGHT">trafficLight</Label>
</Display>
<TableDescriptor>
<ColumnDescriptor IS_KEY="TRUE" NAME="name" TYPE="STRING">
<Display>
<Label NLSID="COL_NAME">name</Label>
</Display>
</ColumnDescriptor>
<ColumnDescriptor IS_KEY="FALSE" NAME="color" TYPE="STRING">
<Display>
<Label NLSID="COL_COLOR">color</Label>
</Display>
</ColumnDescriptor>
<ColumnDescriptor IS_KEY="FALSE" NAME="x" TYPE="STRING">
<Display>
<Label NLSID="COL_X">x</Label>
</Display>
</ColumnDescriptor>
<ColumnDescriptor IS_KEY="FALSE" NAME="y" TYPE="STRING">
<Display>
<Label NLSID="COL_Y">y</Label>
</Display>
</ColumnDescriptor>
</TableDescriptor>
<QueryDescriptor FETCHLET_ID="WSManagementFetchlet">
<Property NAME="ProxyHost" SCOPE="INSTANCE" OPTIONAL="TRUE">ProxyHost</Property>
<Property NAME="ProxyPort" SCOPE="INSTANCE" OPTIONAL="TRUE">ProxyPort</Property>
<Property NAME="SecurityPolicy" SCOPE="INSTANCE" OPTIONAL="TRUE">trafficLight.SecurityPolicy</Property>
<Property NAME="ResourceURL" SCOPE="INSTANCE" OPTIONAL="FALSE">trafficLight.ResourceURL</Property>
<Property NAME="To" SCOPE="INSTANCE" OPTIONAL="FALSE">trafficLight.To</Property>
<Property NAME="OptionSet" SCOPE="INSTANCE" OPTIONAL="TRUE">trafficLight.OptionSet</Property>
<Property NAME="Locale" SCOPE="INSTANCE" OPTIONAL="TRUE">trafficLight.Locale</Property>
<Property NAME="MaxEnvelopeSize" SCOPE="INSTANCE" OPTIONAL="TRUE">trafficLight.MaxEnvelopeSize</Property>
<Property NAME="OperationTimeout" SCOPE="INSTANCE" OPTIONAL="TRUE">trafficLight.OperationTimeout</Property>
<Property NAME="Namespace" SCOPE="GLOBAL" OPTIONAL="FALSE"><![CDATA[[ns1="http://schemas.wiseman.dev.java.net/traffic/1/light.xsd"][ns0="http://www.w3.org/2001/XMLSchema"][wsa="http://www.w3.org/2005/08/addressing"][env="http://www.w3.org/2003/05/soap-envelope"]]]></Property>
<Property NAME="RowType" SCOPE="GLOBAL" OPTIONAL="FALSE">
//ns1:trafficlight/ns1:name,//ns1:trafficlight/ns1:color,//ns1:trafficlight/ns1:x,//ns1:trafficlight/ns1:y</Property>
<Property NAME="ColType" SCOPE="GLOBAL" OPTIONAL="FALSE">name:STRING,color:STRING,x:STRING,y:STRING</Property>
<Property NAME="ReplyTo" SCOPE="GLOBAL" OPTIONAL="FALSE">http://www.w3.org/2005/08/addressing/role/anonymous</Property>
<Property NAME="Action" SCOPE="GLOBAL" OPTIONAL="FALSE">http://schemas.xmlsoap.org/ws/2004/09/transfer/Get</Property>
<Property NAME="TransferOperation" SCOPE="GLOBAL" OPTIONAL="FALSE">GET</Property>
<Property NAME="SelectorSet" SCOPE="GLOBAL" OPTIONAL="FALSE">[name,%trafficLight.name%]</Property>
<Property NAME="UserCredential" SCOPE="GLOBAL" OPTIONAL="FALSE">UserCredentialSet01</Property>
<CredentialRef NAME="UserCredentialSet01">UserCredentialSet01</CredentialRef>
</QueryDescriptor>
</Metric>
<CredentialInfo>
<CredentialType NAME="CSFKeyCredential">
<Display>
<Label NLSID="CRED_TYPE">CSF-Key Credential Type</Label>
</Display>
<CredentialTypeColumn NAME="CSFKey">
<Display>
<Label NLSID="CRED_C_S_F_KEY">Alias CSF Key</Label>
</Display>
</CredentialTypeColumn>
</CredentialType>
<CredentialType NAME="AliasCredential">
<Display>
<Label NLSID="CRED_TYPE">Alias Credential Type</Label>
</Display>
<CredentialTypeColumn NAME="Alias">
<Display>
<Label NLSID="CRED_ALIAS">Alias (i.e. username, encryption key, signature key, etc)</Label>
</Display>
</CredentialTypeColumn>
<CredentialTypeColumn NAME="Password">
<Display>
<Label NLSID="CRED_PASSWORD">Password for the alias</Label>
</Display>
</CredentialTypeColumn>
</CredentialType>
<CredentialSet NAME="UserCredentialSet01" USAGE="MONITORING">
<AllowedCredType TYPE="CSFKeyCredential"/>
<AllowedCredType TYPE="AliasCredential"/>
</CredentialSet>
</CredentialInfo>
<InstanceProperties>
<InstanceProperty NAME="ProxyHost" CREDENTIAL="FALSE" OPTIONAL="TRUE">
<Display>
<Label NLSID="PROP_PROXY_HOST">Proxy Server Name</Label>
</Display>
</InstanceProperty>
<InstanceProperty NAME="ProxyPort" CREDENTIAL="FALSE" OPTIONAL="TRUE">
<Display>
<Label NLSID="PROP_PROXY_PORT">Proxy Server Port</Label>
</Display>
</InstanceProperty>
<InstanceProperty NAME="trafficLight.SecurityPolicy"
CREDENTIAL="FALSE" OPTIONAL="TRUE">
<Display>
<Label NLSID="PROP_TRAFFIC_LIGHT_SECURITY_POLICY">[trafficLight] Authentication/Web Service Policy</Label>
</Display>
</InstanceProperty>
<InstanceProperty NAME="trafficLight.ResourceURL" CREDENTIAL="FALSE" OPTIONAL="FALSE">
<Display>
<Label NLSID="PROP_TRAFFIC_LIGHT_RESOURCE_U_R_L">[trafficLight] Resource URL (wsman:ResourceURL)</Label>
</Display>
</InstanceProperty>
<InstanceProperty NAME="trafficLight.To" CREDENTIAL="FALSE" OPTIONAL="FALSE">
<Display>
<Label NLSID="PROP_TRAFFIC_LIGHT_TO">[trafficLight] Network Address of the service (wsa:To)</Label>
</Display>
</InstanceProperty>
<InstanceProperty NAME="trafficLight.OptionSet" CREDENTIAL="FALSE" OPTIONAL="TRUE">
<Display>
<Label NLSID="PROP_TRAFFIC_LIGHT_OPTION_SET">[trafficLight] Set of wsman:Option. Format: [<OptionName1>, value:<value1>, type:<type1>, mustComply:<true|false>][<OptionName2>, value:<value2>, type:<type>, mustComply:<true|false>][...]</Label>
</Display>
</InstanceProperty>
<InstanceProperty NAME="trafficLight.Locale" CREDENTIAL="FALSE" OPTIONAL="TRUE">
<Display>
<Label NLSID="PROP_TRAFFIC_LIGHT_LOCALE">[trafficLight] wsman:Locale (RFC 3066 language code). Format: e.g. en-US</Label>
</Display>
</InstanceProperty>
<InstanceProperty NAME="trafficLight.MaxEnvelopeSize"
CREDENTIAL="FALSE" OPTIONAL="TRUE">
<Display>
<Label NLSID="PROP_TRAFFIC_LIGHT_MAX_ENVELOPE_SIZE">[trafficLight] wsman:MaxEnvelopeSize in Octets. Format: e.g. 8192</Label>
</Display>
</InstanceProperty>
<InstanceProperty NAME="trafficLight.OperationTimeout"
CREDENTIAL="FALSE" OPTIONAL="TRUE">
<Display>
<Label NLSID="PROP_TRAFFIC_LIGHT_OPERATION_TIMEOUT">[trafficLight] wsman:OperationTimeout. Format: e.g. PT30S</Label>
</Display>
</InstanceProperty>
<InstanceProperty NAME="trafficLight.name" CREDENTIAL="FALSE" OPTIONAL="FALSE">
<Display>
<Label NLSID="PROP_TRAFFIC_LIGHT_NAME">[trafficLight] Value for the Selector "name"</Label>
</Display>
</InstanceProperty>
</InstanceProperties>
</TargetMetadata>
The command-line tool also generates the requisite collection file as shown in Example 16-8, "TrafficLight Default Collection File".
Example 16-8 TrafficLight Default Collection File
<!DOCTYPE TargetCollection SYSTEM "../dtds/TargetCollection.dtd">
<TargetCollection TYPE="TrafficLight">
  <CollectionItem NAME="trafficLight">
    <Schedule>
      <IntervalSchedule TIME_UNIT="Min" INTERVAL="30"/>
    </Schedule>
  </CollectionItem>
</TargetCollection>
After the command-line tool generates the target metadata and collection files, you can create the Metatdata Plug-in archive. See Section 13.4, "Creating the Plug-in Archive".
The Java Management Extensions (JMX) framework improves manageability of your JMX-instrumented applications by enabling you to see what is happening inside. You gain insight into your applications and infrastructure through modular plug-ins called Managed Beans (MBeans). MBeans integrate with your application, components (such as Enterprise Java-Beans), or other resources to expose attributes (values) and operations.
The OJMX fetchlet, supplied with 10.2 Management Agents, enables you to monitor key metrics in your JMX-instrumented applications deployed on Oracle Application Server 10.1.3 or above. The fetchlet extends monitoring capabilities via JMX to the J2EE 1.4-compliant Oracle containers for J2EE (OC4J) servers themselves.
Monitoring JMX-instrumented applications/servers with Enterprise Manager entails defining a new target type that Enterprise Manager can monitor via Management Plug-ins. As with the Web services wscli command-line tool, Enterprise Manager provides a jmxcli command-line tool to automate the generation of the target metadata and collection files.
Oracle Application Server 10.1.3 instance running on a specific host with a JMX-enabled application deployed on it that needs to be monitored as a target in Enterprise Manager.
Management Agent version 10.2.0.2 or greater installed on that host.
Oracle Management Server (OMS) version 10.2.0.2 or greater with which the Management Agent communicates.
Currently, the jmxcli tool and OJMX fetchlet only allow you to browse and monitor MBeans (system and application-defined) that are available on the default MBeanserver on the target OC4J instance. The jmxcli tool primarily handles attributes and parameter and return values for operations that are OpenTypes. Examples: SimpleTypes, CompositeTypes, TabularTypes, and arrays of SimpleTypes.
As with Web services, the JMX command-line tool (jmxcli) simplifies creating the requisite target definition files: metadata and the default collection file. The tool is an offline configuration utility that connects you to an MBeanServer and enables you to browse available MBeans. It can also append metrics to an existing set of files during a subsequent invocation of the tool.
During a command-line tool session, you select specific MBeans and then choose the desired attributes/statistical values or operations Enterprise Manager needs to retrieve or invoke periodically on these MBeans to collect these values. The tool helps define packaging for these collected values as one or more Enterprise Manager metrics (with columns), and also enables you to specify a metric collection interval.
The JMX command-line tool syntax is as follows for a JMX-enabled target on an OC4J: Note that usage has changed from earlier releases. The cli is now integrated with the emctl utility on the Management Agent.
cd Agent Instance Home/bin
emctl jmxcli TARGET_HOME
                [  -h hostname
                   -p port
                   -u username
                   -c credential/password
                   -w work directory
                   -e true/false
                   [-m MBeanName | -d jmx_domain | -s mBeanPattern]
                ]
TARGET_HOME is an Oracle Home directory 10.1.3 or later Oracle Application Server Container for J2EE (OC4J).
The jmxcli command accepts the following options:
-h Host name of the OC4J. Default: "localhost"
-p RMI/RMIS port of the OC4J. Default: "23791" From the ORACLE_HOME/opmn/bin directory of your Application Server 10.1.3.0 or later instance, run opmnctl status -1 to determine the RMI port for the OC4J for which MBeans were deployed.
-u Valid user name for the OC4J. Default: "oc4jadmin"
-c Password associated with the OC4J user specified by the -u option. Default: None. If you do not specify a password, you are prompted for the password.
-w Directory where the metadata and default collection files created by the JMX command-line tool are placed. Default: Current directory. When invoking the command-line tool, you must have write permission on this directory to create subdirectories and add files. If the metadata and default collection files already exist within that directory, you have the option of appending to or overwriting the original files.
-e Whether or not the RMIS connection to the OC4J is enabled (true or false). Default: false
You can also specify ONE of the following three parameters (-m, -d or -s) to retrieve a subset of MBeans available on the MBeanServer. By default, all MBeans on the MBeanServer are displayed for you to select from if none of these parameters are specified.
-m MBean ObjectName of the required MBean that needs to be retrieved and examined. If this is an ObjectName pattern-matching multiple MBeans, you are shown a list of all MBeans that match the pattern, and you can select one at a time to work on.
-d MBean domain of the required application whose MBeans need to be retrieved and examined. For example, you want to browse all MBeans for an application (myApp). MBeans for this application would be available in the JMX domain "myApp".
-s MBean pattern-matching an existing set of MBeans from which the metrics are to be defined. The -s parameter allows bulk retrieval of JMX Attributes/Statistics from multiple MBeans of a similar type.
If you specify the -s parameter, the resulting metrics created during this jmxcli session appear as a table in the Enterprise Manager console with multiple rows — one row representing each MBean that matches the specified pattern, and with the MBean ObjectName as a key column. For example, if you specify -s 'oc4j:j2eeType=Servlet,*' the resulting metric will have multiple rows, one for each servlet that matches the ObjectName pattern. Besides the MBean ObjectName column, other columns would be the attributes or fields from the return object of the operation, selected during the jmxcli session.
To start the JMX command-line tool:
Go to the $AGENT_HOME/bin directory.
Run the following command:
emctl jmxcli Oracle Home of the target 10.1.3 or greater OC4J [OPTIONS]
Once invoked, the command-line interface automatically prompts you for the requisite information, as shown in Example 16-10. If you need to quit a JMX command-line tool session, you can press Controll+C at any point to exit. Session information will not be saved.
Example 16-10 Sample JMXCLI Session
oracleHome=/ade/sparmesw_10202_ssm/oracle
targetHome=/scratch/shiphomes/oc4j/1013_SOA_M1/
The Port is 12404

Connecting to server: localhost:12404
Connecting as user: oc4jadmin
Enter the password:

Obtained 1 MBeans matching pattern oc4j:J2EEApplication=orabpel,name="ServerBean",*.

Enter the target type for this metric: [myJ2EEApp] myBPELApp
This is the target type for the new J2EE application as it should show up within Enterprise Manager.
Enter the target version: [1.0]

Enter the target metadata file: [./metadata/myBPELApp.xml]
This is the location of the metadata file that jmxcli generates. You must have write permission on the directories where the target metadata and default collection files are to be created.
Enter the default collections file: [./default_collection/myBPELApp.xml]
The file ./metadata/myBPELApp.xml already exists.
Do you want to overwrite the existing file, append to it, or quit <o/a/q>? [a] a
Appending to existing file: ./metadata/myBPELApp.xml.
The available targets are:
0: Identifies a deployed stateless session bean
        (oc4j:EJBModule="ejb_ob_engine",J2EEApplication=orabpel,J2EEServer=standalone,j2eeType=StatelessSessionBean,name="ServerBean")

Enter the index of target/MBean you wish to monitor or press <Ctrl-C> to quit: 0
If multiple MBeans matched the -m <MBean pattern> specified when jmxcli was invoked, all MBean ObjectNames matching the pattern are listed during this part of the command-line session, at which point you can select one among the list. You can choose another MBean from the above list after creating metrics for the first one without exiting this jmxcli session.
If you want to append metrics from another MBean that does not match the above -m pattern, you must exit and start another jmxcli session with the MBean ObjectName/Pattern of the latter MBean, and create metrics from this MBean which will be appended to the original target metadata and default collection files from the previous jmxcli session. Using this method, you can append metrics created from multiple jmxcli sessions to the same target metadata and default collection files, if necessary.
Following metric source types are available for selected target(s):
        0: JMX Attributes
        1: JMX Operations
        2: J2EE Statistics
Enter the index of your choice or press <Ctrl-C> to quit: 2

Statistics are:
        0: CreateCount
        1: ejbCreate()ClientActive
        2: ejbCreate()ClientTime
        3: ejbRemove()ClientActive
        4: ejbRemove()ClientTime
        5: MethodReadyCount
        6: RemoveCount
        7: setSessionContext(javax.ejb.SessionContext)ClientActive
        8: setSessionContext(javax.ejb.SessionContext)ClientTime
Select one or more items as comma-separated indices: 0,6

JavaBean is : CreateCount
        0: count
        1: description
        2: lastSampleTime
        3: name
        4: startTime
        5: unit
This indicates that the Statistic call CreateCount is not a simple data type, but has a JavaBean pattern with the above listed properties, of which some may interest you.
Select one or more items as comma-separated indices: 0
JavaBean is : RemoveCount
        0: count
        1: description
        2: lastSampleTime
        3: name
        4: startTime
        5: unit
Select one or more items as comma-separated indices: 0
Number of possible columns in the resultant metric are 2.

Enter the name for this metric column at index=0 : [countOfCreateCount] createCount
You can specify any meaningful name here. If you do not specify a name, the JMX command-line tool generates a default name that may not be appropriate in all cases.
Is this column a KEY Column <y/n>? [n]
In situations where multiple rows can be returned, as might be the case when the Attribute or return value of the Operation is TabularData, you need to specify one or more of your chosen metrics as "Key" columns.
Is this column for SUMMARY_UI <y/n>? [n]
Enter the label for column: [createCount]
Enter the NLSID for column: [createCount]
Enter the UNIT for column "createCount": [count]
Do you want to create a threshold for this column <y/n>? [n] y
Creating threshold!!
Following operators are available for creating thresholds:
 0: GT
 1: EQ
 2: LT
 3: LE
 4: GE
 5: CONTAINS
 6: NE
 7: MATCH
If you want to create a threshold on this column, you can specify an operator and then a value that would trigger a CRITICAL or WARNING alert.
Enter the index of your choice or press <Ctrl-C> to quit: 0
Enter the CRITICAL threshold: [NotDefined] 100
Enter the WARNING threshold: [NotDefined] 85
Enter the number of occurrences that trigger threshold: [6] 3
This is the number of consecutive occurrences of above CRITICAL or WARNING values that would trigger an alert.
Enter the message to be used when threshold is triggered: [createCount is %value%
and has crossed warning (%warning_threshold%) or critical (%critical_threshold%) threshold.]
Enter NLSID for the message used when threshold is triggered: [createCount_cond]
Enter the name for this metric column at index=1 : [countOfRemoveCount] removeCount
Is this column a KEY Column <y/n>? [n]
Is this column for SUMMARY_UI <y/n>? [n]
Enter the label for column: [removeCount]
Enter the NLSID for column: [removeCount]
Enter the UNIT for column "removeCount": [count]
Do you want to create a threshold for this column <y/n>? [n]
Enter the name of this metric: ServerBeanStats
Enter the label for this metric: [ServerBeanStats]

Do you want periodic collection for this metric <y/n>? [n] y
If the metric does not have to be collected periodically, as would be the case with real-time-only metrics, you can specify "no".
Enter the collection interval in seconds: 60
Periodic collection interval is: 60 seconds.

Do you want to create another metric <y/n>? [n] y
The available targets are:
0: Identifies a deployed stateless session bean
        (oc4j:EJBModule="ejb_ob_engine",J2EEApplication=orabpel,J2EEServer=standalone,j2eeType=StatelessSessionBean,name="ServerBean")

Enter the index of target/MBean you wish to monitor or press <Ctrl-C> to quit: 0
If multiple MBeans match the MBean pattern for the -m option (specified when jmxcli was invoked) you can select a different MBean from the above list for the next iteration of this command-line session.
Following metric source types are available for selected target(s):
        0: JMX Attributes
        1: JMX Operations
        2: J2EE Statistics

Enter the index of your choice or press <Ctrl-C> to quit: 0

Attributes are:         0: activeInstances       Return Value: int
        1: activeInstancesHighWaterMark  Return Value: int
        2: eventProvider         Return Value: boolean
        3: maxInstances  Return Value: int
        4: minInstances  Return Value: int
        5: ObjectName    Return Value: javax.management.ObjectName
        6: stateManageable       Return Value: boolean
        7: statisticsProvider    Return Value: boolean
        8: stats         Return Value: javax.management.j2ee.statistics.Stats
        9: transactionTimeout    Return Value: int
Select one or more items as comma-separated indices: 0,3,4

Number of possible columns in the resultant metric are 3.
Enter the name for this metric column at index=0 : [activeInstances]
Is this column a KEY Column <y/n>? [n]
Is this column for SUMMARY_UI <y/n>? [n]
Enter the label for column: [activeInstances]
Enter the NLSID for column: [activeInstances]
Enter the UNIT for column "activeInstances": [millisec, kb etc.. ] Do you want to create a threshold for this column <y/n>? [n]
Enter the name for this metric column at index=1 : [maxInstances]
Is this column a KEY Column <y/n>? [n]
Is this column for SUMMARY_UI <y/n>? [n]
Enter the label for column: [maxInstances]
Enter the NLSID for column: [maxInstances]
Enter the UNIT for column "maxInstances": [millisec, kb etc.. ]
Do you want to create a threshold for this column <y/n>? [n]

Enter the name for this metric column at index=2 : [minInstances]
Is this column a KEY Column <y/n>? [n]
Is this column for SUMMARY_UI <y/n>? [n]
Enter the label for column: [minInstances]
Enter the NLSID for column: [minInstances]
Enter the UNIT for column "minInstances": [millisec, kb etc.. ]
Do you want to create a threshold for this column <y/n>? [n]

Enter the name of this metric: ServerBeanCount
Enter the label for this metric: [ServerBeanCount]

Do you want periodic collection for this metric <y/n>? [n] y
Enter the collection interval in seconds: 300
Periodic collection interval is: 300 seconds.

Do you want to create another metric <y/n>? [n] n
Written the metadata xml file: ./metadata/myBPELApp.xml.
Updated the default collection file for myBPELApp at location ./default_collection/myBPELApp.xml.
Exiting...
After the JMX command-line tool generates the target metadata and collection files, you can create the Oracle Plug-in archive. A sample of each generated file from the command-line tool session above is shown in Example 16-11 and Example 16-12.
Example 16-11 Generated Target Metadata File
<!DOCTYPE TargetMetadata SYSTEM "../dtds/TargetMetadata.dtd">
<TargetMetadata META_VER="1.0" TYPE="myBPELApp" CATEGORY
_PROPERTIES="VersionCategory">
   <Display>
      <Label NLSID="myBPELAppNLSID">myBPELApp</Label>
      <ShortName NLSID="myBPELAppShortName">myBPELApp</ShortName>
      <Description NLSID="myBPELAppDescription">myBPELApp</Description>
   </Display>

   <Metric NAME="ServerBeanStats" TYPE="TABLE">
      <Display>
         <Label NLSID="ServerBeanStats">ServerBeanStats</Label>
      </Display>
      <TableDescriptor>
         <ColumnDescriptor NAME="createCount" TYPE="NUMBER">
            <Display>
               <Label NLSID="createCount">createCount</Label>
               <Unit NLSID="count">count</Unit>
            </Display>
         </ColumnDescriptor>
         <ColumnDescriptor NAME="removeCount" TYPE="NUMBER">
            <Display>
               <Label NLSID="removeCount">removeCount</Label>
               <Unit NLSID="count">count</Unit>
            </Display>
         </ColumnDescriptor>
      </TableDescriptor>
      <QueryDescriptor FETCHLET_ID="OJMX">
         <Property NAME="machine" SCOPE="INSTANCE">HTTPMachine</Property>
         <Property NAME="OracleHome" SCOPE="INSTANCE">OracleHome</Property>
         <Property NAME="oc4jInstanceName" SCOPE="INSTANCE"  OPTIONAL="TRUE">OC4JInstanceName</Property>
         <Property NAME="jvmId" SCOPE="INSTANCE" OPTIONAL="TRUE">JVMId</Property>
         <Property NAME="mgmtWebSite" SCOPE="INSTANCE" OPTIONAL="TRUE">MgmtWebSite</Property>
         <Property NAME="authuser" SCOPE="INSTANCE" OPTIONAL="TRUE">authUser</Property>
         <Property NAME="authpwd" SCOPE="INSTANCE" OPTIONAL="TRUE">authPasswd</Property>
         <Property NAME="metric" SCOPE="GLOBAL">ServerBeanStats</Property>
         <Property NAME="delimiter" SCOPE="GLOBAL">|</Property>
         <Property NAME="name" SCOPE="GLOBAL">getStatistics</Property>
         <Property NAME="signature" SCOPE="GLOBAL">objectName,statNames,languageCode,countryCode</Property>
<Property NAME="returnType" SCOPE="GLOBAL">arrayOfComplexObjectBean</Property>
         <Property NAME="dontAddDefaultRowKey" SCOPE="GLOBAL">true</Property>
         <Property NAME="columnOrder" SCOPE="GLOBAL">/CreateCount/count,/RemoveCount/count</Property>
         <Property NAME="arguments" SCOPE="GLOBAL">
            <![CDATA[<arguments>
   <argument>
      <value>oc4j:EJBModule="ejb_ob_engine",J2EEApplication=orabpel,J2EEServer=standalone,j2eeType=StatelessSessionBean,name="ServerBean"</value>
   </argument>
   <argument>
      <value>CreateCount</value>
      <value>RemoveCount</value>
   </argument>
   <argument>
      <value>en</value>
   </argument>
   <argument>
      <value>US</value>
   </argument>
</arguments>]]>
         </Property>
      </QueryDescriptor>
   </Metric>

<Metric NAME="ServerBeanCount" TYPE="TABLE">
      <Display>
         <Label NLSID="ServerBeanCount">ServerBeanCount</Label>
      </Display>
      <TableDescriptor>
         <ColumnDescriptor NAME="activeInstances" TYPE="NUMBER">
            <Display>
               <Label NLSID="activeInstances">activeInstances</Label>
            </Display>
         </ColumnDescriptor>
         <ColumnDescriptor NAME="maxInstances" TYPE="NUMBER">
            <Display>
               <Label NLSID="maxInstances">maxInstances</Label>
            </Display>
         </ColumnDescriptor>
         <ColumnDescriptor NAME="minInstances" TYPE="NUMBER">
            <Display>
               <Label NLSID="minInstances">minInstances</Label>
            </Display>
         </ColumnDescriptor>
      </TableDescriptor>
      <QueryDescriptor FETCHLET_ID="OJMX">
         <Property NAME="machine" SCOPE="INSTANCE">HTTPMachine</Property>
         <Property NAME="OracleHome" SCOPE="INSTANCE">OracleHome</Property>
         <Property NAME="oc4jInstanceName" SCOPE="INSTANCE" OPTIONAL="TRUE">OC4JInstanceName</Property>
         <Property NAME="jvmId" SCOPE="INSTANCE" OPTIONAL="TRUE">JVMId</Property>
         <Property NAME="mgmtWebSite" SCOPE="INSTANCE" OPTIONAL="TRUE">MgmtWebSite</Property>
         <Property NAME="authuser" SCOPE="INSTANCE" OPTIONAL="TRUE">authUser</Property>
         <Property NAME="authpwd" SCOPE="INSTANCE" OPTIONAL="TRUE">authPasswd</Property>
         <Property NAME="metric" SCOPE="GLOBAL">ServerBeanCount</Property>
         <Property NAME="delimiter" SCOPE="GLOBAL">|</Property>
         <Property NAME="name" SCOPE="GLOBAL">getAttributes</Property>
         <Property NAME="signature" SCOPE="GLOBAL">objectName,attributeNames,languageCode,countryCode</Property>
         <Property NAME="returnType" SCOPE="GLOBAL">arrayOfComplexObjectBean</Property>
         <Property NAME="dontAddDefaultRowKey" SCOPE="GLOBAL">true</Property>
         <Property NAME="columnOrder" SCOPE="GLOBAL">/activeInstances,/maxInstances,/minInstances</Property>
<Property NAME="arguments" SCOPE="GLOBAL">
            <![CDATA[<arguments>
   <argument>      <value>oc4j:EJBModule="ejb_ob_engine",J2EEApplication=orabpel,J2EEServer=standalone,j2eeType=StatelessSessionBean,name="ServerBean"</value>
   </argument>
   <argument>
      <value>activeInstances</value>
      <value>maxInstances</value>
      <value>minInstances</value>
   </argument>
   <argument>
      <value>en</value>
   </argument>
   <argument>
      <value>US</value>
   </argument>
</arguments>]]>
         </Property>
      </QueryDescriptor>
   </Metric>

<Metric NAME="Response" TYPE="TABLE">
      <Display>
         <Label NLSID="Response">Response</Label>
      </Display>
      <TableDescriptor>
         <ColumnDescriptor NAME="Status" TYPE="NUMBER">
            <Display>
               <Label NLSID="Status">Status</Label>
            </Display>
         </ColumnDescriptor>
      </TableDescriptor>
      <QueryDescriptor FETCHLET_ID="OJMX">
         <Property NAME="machine" SCOPE="INSTANCE">HTTPMachine</Property>
         <Property NAME="OracleHome" SCOPE="INSTANCE">OracleHome</Property>
         <Property NAME="oc4jInstanceName" SCOPE="INSTANCE" OPTIONAL="TRUE">OC4JInstanceName</Property>
         <Property NAME="jvmId" SCOPE="INSTANCE" OPTIONAL="TRUE">JVMId</Property>
         <Property NAME="mgmtWebSite" SCOPE="INSTANCE" OPTIONAL="TRUE">MgmtWebSite</Property>
         <Property NAME="authuser" SCOPE="INSTANCE" OPTIONAL="TRUE">authUser</Property>
         <Property NAME="authpwd" SCOPE="INSTANCE" OPTIONAL="TRUE">authPasswd</Property>
         <Property NAME="metric" SCOPE="GLOBAL">Response</Property>
         <Property NAME="delimiter" SCOPE="GLOBAL">|</Property>
         <Property NAME="name" SCOPE="GLOBAL">getAttributes</Property>
         <Property NAME="signature" SCOPE="GLOBAL">objectName,attributeNames,languageCode,countryCode</Property>
         <Property NAME="returnType" SCOPE="GLOBAL">arrayOfComplexObjectBean</Property>
         <Property NAME="dontAddDefaultRowKey" SCOPE="GLOBAL">true</Property>
         <Property NAME="columnOrder" SCOPE="GLOBAL">/state</Property>
         <Property NAME="arguments" SCOPE="GLOBAL">
            <![CDATA[<arguments>
   <argument>
      <value>oc4j:J2EEServer=standalone,j2eeType=J2EEApplication,name=orabpel</value>
   </argument>
   <argument>
      <value>state</value>
   </argument>
   <argument>
      <value>en</value>
   </argument>
   <argument>
      <value>US</value>
   </argument>
</arguments>]]>
         </Property>
      </QueryDescriptor>
   </Metric>

   <InstanceProperties>
      <InstanceProperty NAME="HTTPMachine">
         <Display>
            <Label NLSID="dms_HTTPMachine_iprop">Machine name</Label>
         </Display>
      </InstanceProperty>
      <InstanceProperty NAME="OracleHome">
         <Display>
            <Label NLSID="dms_OracleHome_iprop">Oracle home path</Label>
         </Display>
      </InstanceProperty>
<InstanceProperty NAME="OC4JInstanceName" OPTIONAL="TRUE"><Display><Label NLSID="OC4JInstanceNameiprop">OC4JInstanceName</Label></Display>home</InstanceProperty>
      <InstanceProperty NAME="JVMId" OPTIONAL="TRUE"><Display><Label NLSID="JVMId_iprop">JVMId</Label></Display>1</InstanceProperty>
      <InstanceProperty NAME="MgmtWebSite" OPTIONAL="TRUE"><Display><Label NLSID="MgmtWebSite_iprop">MgmtWebSite</Label></Display>default-web-site</InstanceProperty>
      <InstanceProperty NAME="URI" OPTIONAL="TRUE"><Display><Label NLSID="URI">URI</Label></Display>/JMXSoapAdapter/JMXSoapAdapter</InstanceProperty>
      <InstanceProperty NAME="authUser" OPTIONAL="TRUE">
         <Display>
            <Label NLSID="dms_authUser_iprop">Username for Basic authorization</Label>
         </Display>
      </InstanceProperty>
      <InstanceProperty NAME="authPasswd" OPTIONAL="TRUE" CREDENTIAL="TRUE">
         <Display>
            <Label NLSID="dms_authPasswd_iprop">Password for Basic authorization</Label>
         </Display>
      </InstanceProperty>
      <InstanceProperty NAME="Version" OPTIONAL="TRUE"><Display><Label NLSID="oc4j_version_iprop">Version of myBPELApp</Label></Display>1.0</InstanceProperty>
   </InstanceProperties>
</TargetMetadata>
Example 16-12 Generated Metric Collection File
<!DOCTYPE TargetCollection SYSTEM "../dtds/TargetCollection.dtd">
<!-- This file is generated by Collector at 2011-04-28 12:11:55 -->

<TargetCollection TYPE="myBPELApp" INCLUDE_DEFAULT="TRUE">
        <CollectionItem NAME="ServerBeanStats" UPLOAD="YES">
                <Schedule>
                        <IntervalSchedule INTERVAL="60" TIME_UNIT="Sec"/>
                </Schedule>
                <MetricColl NAME="ServerBeanStats">
                        <Condition COLUMN_NAME="createCount" CRITICAL="100"           WARNING="85" OPERATOR="GT" OCCURRENCES="3" MESSAGE="createCount is %value% and has crossed warning (%warning_threshold%) or critical (%critical_threshold%) threshold." MESSAGE_NLSID="createCount_cond"/>
                </MetricColl>
        </CollectionItem>
        <CollectionItem NAME="ServerBeanCount" UPLOAD="YES">
                <Schedule>
                        <IntervalSchedule INTERVAL="300" TIME_UNIT="Sec"/>
                </Schedule>
                <MetricColl NAME="ServerBeanCount">
                </MetricColl>
        </CollectionItem>

        <CollectionItem NAME="Response" UPLOAD="YES">
                <Schedule>
                        <IntervalSchedule INTERVAL="30" TIME_UNIT="Sec"/>
                </Schedule>
                <MetricColl NAME="Response">
                        <Condition COLUMN_NAME="Status" CRITICAL="1" WARNING="NotDefined" OPERATOR="NE" OCCURRENCES="2" MESSAGE="Status is %value% and has crossed warning (%warning_threshold%) or critical (%critical_threshold%) threshold." MESSAGE_NLSID="Status_cond"/>
                </MetricColl>
        </CollectionItem>
</TargetCollection>
For the status information of your targets to appear correctly within the Enterprise Manager console, you must define a metric, called Response, that has a column, named Status, with a critical threshold set. The status of target instances of this type appears in the console as "Up" (available) if the metric value is below the critical threshold. When the threshold is exceeded, the target status appears as "Down" in the console.
You can create the Response metric in another jmxcli session (append the metric to the metadata and collection files created in an earlier session). Example 16-13 illustrates adding a Response metric to previously generated metadata and collection files from a new command-line session.
Example 16-13 Adding a Response Metric
./emctl jmxcli /scratch/shiphomes
//oc4j/1013_PRODUCTION/ -p 12403 -c welcome1 -m 'oc4j:j2eeType=J2EEApplication,n
ame=orabpel,*'

oracleHome=/ade/sparmesw_10202_ssm/oracle
targetHome=/scratch/shiphomes//oc4j/1013_PRODUCTION/
The Port is 12403

Connecting to server: localhost:12403
Connecting as user: oc4jadmin

Obtained 1 MBeans matching pattern oc4j:j2eeType=J2EEApplication,name=orabpel,*.

Enter the target type for this metric: [myJ2EEApp] myBPELApp

Enter the target version: [1.0]

Enter the target metadata file: [./metadata/myBPELApp.xml]

Enter the default collections file: [./default_collection/myBPELApp.xml]
The file ./metadata/myBPELApp.xml already exists.

Do you want to overwrite the existing file, append to it, or quit <o/a/q>? [a] a
Appending to existing file: ./metadata/myBPELApp.xml.
The available targets are:
0: Identifies a J2EE application EAR that has been deployed
        (oc4j:J2EEServer=standalone,j2eeType=J2EEApplication,name=orabpel)

Enter the index of target/MBean you wish to monitor or press <Ctrl-C> to quit: 0
Following metric source types are available for selected target(s):
        0: JMX Attributes
        1: JMX Operations

Enter the index of your choice or press <Ctrl-C> to quit: 0

Attributes are:
        0: allAccessibleGroups   Return Value: java.util.Set
        1: allAccessibleUsers    Return Value: java.util.Set
        2: applicationRootDirectoryPath  Return Value: java.lang.String
        3: archivePath   Return Value: java.lang.String
        4: childApplicationNames         Return Value: [Ljava.lang.String;
        5: childApplications     Return Value: [Ljavax.management.ObjectName;
        6: dataSourcesDescriptor         Return Value: java.lang.String
        7: deploymentDescriptor  Return Value: java.lang.String
        8: ejbClassLoaderPath    Return Value: java.lang.String
        9: eventProvider         Return Value: boolean
        10: groups       Return Value: java.util.Set
        11: iiopStubs    Return Value: [B
        12: metricRulesDescriptor        Return Value: java.lang.String
        13: Modules      Return Value: [Ljavax.management.ObjectName;
        14: objectName   Return Value: java.lang.String
        15: ohsRouting   Return Value: boolean
        16: parentApplication    Return Value: javax.management.ObjectName
        17: parentApplicationName        Return Value: java.lang.String
        18: properties   Return Value: java.util.Properties
        19: proprietaryDeploymentDescriptor      Return Value: java.lang.String
        20: proxyInterfaceSQLObjects     Return Value: [Ljava.lang.String;
        21: routingId    Return Value: java.lang.String
        22: Server       Return Value: javax.management.ObjectName
        23: sharedLibraryImports   Return Value: [Loracle.oc4j.admin.management.shared.SharedLibraryImport;
        24: startTime    Return Value: long
        25: state        Return Value: int
        26: stateManageable      Return Value: boolean
        27: statisticsProvider   Return Value: boolean
        28: syntheticWebModules  Return Value: oracle.oc4j.admin.management.shared.WebModule
        29: users        Return Value: java.util.Set
        30: webSite      Return Value: java.lang.String
        31: webSiteBindings      Return Value: java.util.Map
Select one or more items as comma-separated indices: 25

Number of possible columns in the resultant metric are 1.

Enter the name for this metric column at index=0 : [state] Status
Is this column a KEY Column <y/n>? [n]
Is this column for SUMMARY_UI <y/n>? [n]
Enter the label for column: [Status]
Enter the NLSID for column: [Status]
Enter the UNIT for column "Status": [millisec, kb etc.. ]
Do you want to create a threshold for this column <y/n>? [n] y
Creating threshold!!
Following operators are available for creating thresholds:
 0: GT
 1: EQ
 2: LT
 3: LE
 4: GE
 5: CONTAINS
 6: NE
 7: MATCH
Enter the index of your choice or press <Ctrl-C> to quit: 6
Enter the CRITICAL threshold: [NotDefined] 1
Enter the WARNING threshold: [NotDefined]
Enter the number of occurrences that trigger threshold: [6] 2
Enter the message to be used when threshold is triggered: [Status is %value% and has crossed warning (%warning_threshold%) or critical (%critical_threshold%) threshold.]
Enter NLSID for the message used when threshold is triggered: [Status_cond]

Enter the name of this metric: Response
Enter the label for this metric: [Response]

Do you want periodic collection for this metric <y/n>? [n] y
Enter the collection interval in seconds: 30
Periodic collection interval is: 30 seconds.

Do you want to create another metric <y/n>? [n] n
Written the metadata xml file: ./metadata/myBPELApp.xml.
Updated the default collection file for myBPELApp at location ./default_collecti
on/myBPELApp.xml.
Exiting...

Please note that the Response metric collected in this jmxcli session would be appended to the metadata and default_collection file created in an earlier session of the tool. (User can chose to overwrite the earlier file as well if they specific  the "o" option to the following prompt)

Do you want to overwrite the existing file, append to it, or quit <o/a/q>? [a] a
Note:
If your Java application is not JMX-instrumented, but you want to monitor the J2SE 5.0 JVM on which it is running, go directly to Section 16.7.3, "Configuring a Standalone Java Application or JVM Target" to create target instances of type JVM. This enables you to monitor these JVMs in Enterprise Manager, preferably from an Enterprise Manager Agent installed on the same host as your JVM. However, the prerequisites and known limitations discussed below still apply.Enterprise Manager provides an out-of-box JVM target type. This enables you to add and configure metrics from standalone J2SE1.5 JVMs that are enabled for remote management in Enterprise Manager version 10.2.0.3 or later.
If your standalone Java application exposes data through JMX MBeans as for a J2EE application deployed on an Oracle Container for J2EE, you can use the JMX command-line tool to define such an application as an Enterprise Manager target type and generate a metadata and default collection file for this target type. You can monitor your standalone application targets from an Enterprise Manager Agent, preferably installed on the same host as your JVM. Multiple JVMs running on that host can be monitored by the same Enterprise Manager Agent.
You can collect metrics from user-defined MBeans on a standalone (J2SE1.5-based) JVM and place them into Enterprise Manager using the JMX fetchlet. The fetchlet is designed for a standalone Sun J2SE1.5-based (or later) JVM containing user-defined MBeans that use JMX OpenTypes as arguments and return values.
Java virtual machine J2SE 1.5 or higher instance running on a specific host. This JVM could be running a JMX-enabled application that exposes metrics via MBeans that need to be monitored as a target in Enterprise Manager. If the application does not expose MBeans, the JVM itself could be monitored using the built-in JVM target type provided in Enterprise Manager. See Section 16.7.3, "Configuring a Standalone Java Application or JVM Target" for more information.
JMX agent enabled for local access. Set this system property when you start the JVM or Java application:
com.sun.management.jmxremote
Monitoring and management from remote systems enabled. Set this system property when you start the JVM:
com.sun.management.jmxremot.port=portNum
For additional information about enabling the JVM for remote management, see the following document:
http://java.sun.com/j2se/1.5.0/docs/guide/management/agent.html#remote
Management Agent version 10.2.0.3 or later installed on that host.
Oracle Management Server (OMS) version 10.2.0.3 or greater with which the Management Agent communicates.
Currently, the jmxcli tool only allows you to browse and monitor MBeans (platform and application-defined) that are available on the default platform MBeanserver on the target JVM instance. The tool does not support monitoring a custom MBeanServer on the target JVM instance. The jmxcli tool primarily handles attributes as well as parameter and return values for operations that are OpenTypes, such as SimpleTypes, CompositeTypes, TabularTypes, and arrays of SimpleTypes.
As with Web services and the J2EE application on OC4J, the command-line tool (jmxcli) simplifies creating the requisite target definition files: metadata and the default collection file for a standalone JMX-instrumented Java application. The tool is an offline configuration utility that connects you to an MBeanServer on a J2SE1.5 or higher JVM and enables you to browse available MBeans. It can also append metrics to an existing set of files during a subsequent invocation of the tool.
During a command-line tool session, you select specific MBeans and then choose the desired attributes/statistical values or operations Enterprise Manager needs to retrieve or invoke periodically on these MBeans to collect these values. The tool helps define packaging for these collected values as one or more Enterprise Manager metrics (with columns), and also enables you to specify a metric collection interval.
The JMX command-line tool syntax is as follows:
cd Agent Instance dir/bin
emctl jmxcli -t JVM
                [  -l JMXServiceURL
                   -h hostname
                   -p port
                   -u username
                   -c credential/password
                   -w work directory
                   -e true/false
                   [-m MBeanName | -d jmx_domain | -s mBeanPattern]
                ]
The jmxcli command accepts the following options:
-t JVM Indicates that the MBeanServer is on a standalone JVM
-l JMXServiceURL of the target JVM
-h Hostname of the JVM. Default: "localhost" if the -l option is not specified
-p RMI/RMIS port of the JVM. Default: "23791" if the -l option is not specified. From the ORACLE_HOME/opmn/bin directory of your Application Server 10.1.3.0 or later instance, run opmnctl status -1 to determine the RMI port for the OC4J for which MBeans were deployed.
-u Valid user name for the JVM. Default: None
-c Password for the above user. Default: None. The password is only used to retrieve data and is not stored anywhere.
-w Work directory where the metadata and default collection files are created. Default: Current directory. When invoking the command-line tool, you must have write permission on this directory to create subdirectories and add files. If the metadata and default collection files already exist within that directory, you have the option of appending to or overwriting the original files.
-e True for enabling the SSL connection to the JVM. Default: false
You can also specify ONE of the following three parameters (-m, -d or -s) to retrieve a subset of MBeans available on the MBeanServer. By default, all MBeans on the MBeanServer are displayed for you to select from if none of these parameters are specified.
-m MBean ObjectName of the required MBean that needs to be retrieved and examined. If this is an ObjectName pattern-matching multiple MBeans, you are shown a list of all MBeans that match the pattern, and you can select one at a time to work on.
-d MBean domain of the required application whose MBeans need to be retrieved and examined. For example, you want to browse all MBeans for an application (myApp). MBeans for this application would be available in the JMX domain "myApp".
-s MBean pattern matching an set of similar MBeans from which the metrics are to be defined. The -s parameter allows bulk retrieval of JMX Attributes/Statistics from multiple MBeans of a similar type.
If you specify the -s parameter, the resulting metrics created during this jmxcli session appear as a table in the Enterprise Manager console with multiple rows — one row representing each MBean that matches the specified pattern, and with the MBean ObjectName as a key column. For example, if you specify -s 'oc4j:j2eeType=Servlet,*' the resulting metric will have multiple rows, one for each servlet that matches the ObjectName pattern. Besides the MBean ObjectName column, other columns would be the attributes or fields from the return object of the operation, selected during the jmxcli session.
The following steps explain how to prepare for and then use the JMX command-line tool to generate the files.
Bring up the standalone JVM instance with the MBeans. The following example shows an invocation of the JVM:
JDK15/bin/java -Dcom.sun.management.jmxremote
-Dcom.sun.management.jmxremote.port=6789
-Dcom.sun.management.jmxremote
-Dcom.sun.management.jmxremote.authenticate=false
-Dcom.sun.management.jmxremote.ssl=false MyJMXEnabledApp $*
The jmxcli tool connects to the port number above as a JSR-160 client.
Go to the $ORACLE_HOME/bin directory of the 10.2.0.3 or later version of the Enterprise Manager Agent.
Set the environment variable as follows:
setenv USER_JARS /myAppHome/myJar1.jar;/myAppHome/myJar2.jar
This step is needed if custom classes are being returned in attributes and/or operations in any of the MBeans registered with the target MBeanServer. The Enterprise Manager Agent (fetchlet) can only effectively monitor attributes and/or operations that return JMX OpenTypes, but it could also handle Java Bean properties (through getters and setters) on any custom classes.
Note:
If the application-defined MBeans are returning custom classes, you need to also set up the corresponding user jar file in theCLASSPATH of the Enterprise Manager Agent monitoring this application. To do this, manually insert the location of this jar into the $ORACLE_HOME/sysman/config/classpath.lst file on the Enterprise Manager Agent, then restart the Enterprise Manager Agent.Run the following command:
./emctl jmxcli -t JVM -h localhost -p 6789 u user -c password
where:
-t JVM indicates that the MBeanServer is running on a standard JVM
-h Host name where the JVM is running
-p Port number that enables the JVM for JSR-160 remote access
You can also specify an -l JMXServiceURL option instead of -h host and -p port options.
You can invoke jmxcli with a -w work directory option to create the metadata and default collection files in the specified work directory. If you do not specify -w when you start jmxcli, it defaults to the current directory, which is the directory where you start jmxcli.
Once invoked, the command-line interface automatically prompts you for the requisite information, as shown in Example 16-14. For most of the prompts, you can just press enter to use defaults. If you need to quit a JMX command-line tool session, you can press Control+C at any point to exit. Session information will not be saved.
When the session concludes after you exit, the result will be a myJ2EEApp.xml file (or whatever target type you specified) as metadata/myJ2EEApp.xml, and a default_collection/myJ2EEApp.xml file if you specified periodic collection.
The following sample enables you to browse all MBeans on a remote MBeanServer:
./emctl jmxcli -t JVM -p 6789 (the host defaults to "localhost")
The following sample invokes the command-line interface and filters MBeans based on the MBeanPattern specified as the argument for the -m option:
./emctl jmxcli -t JVM -p 6789 -m "java.lang:*"
Example 16-14 Sample JMXCLI Session
oracleHome=/ade/sparmesw_emas_ml/oracle
userJars=

Connecting to server: localhost:6789
Connecting without authentication. For specifying username and password use
the -u and -c options.

Obtained 14 MBeans matching pattern java.lang:*.

Enter the target type for this metric: [myJ2EEApp] myJavaApp

Enter the target version: [1.0]

Enter the target metadata file: [./metadata/myJavaApp.xml]

Enter the default collections file: [./default_collection/myJavaApp.xml]

Enter a label for this target type: [myJavaApp]

Enter a description for this target type: [myJavaApp]
The available targets are:
0: sun.management.CompilationImpl
        (java.lang:type=Compilation)

1: sun.management.MemoryManagerImpl        (java.lang:name=CodeCacheManager,type=MemoryManager)

2: sun.management.GarbageCollectorImpl        (java.lang:name=Copy,type=GarbageCollector)

3: sun.management.MemoryPoolImpl        (java.lang:name=Eden Space,type=MemoryPool)

4: sun.management.RuntimeImpl        (java.lang:type=Runtime)

5: sun.management.ClassLoadingImpl        (java.lang:type=ClassLoading)

6: sun.management.MemoryPoolImpl        (java.lang:name=Survivor Space,type=MemoryPool)

7: sun.management.ThreadImpl        (java.lang:type=Threading)

8: sun.management.GarbageCollectorImpl        (java.lang:name=MarkSweepCompact,type=GarbageCollector)

9: com.sun.management.UnixOperatingSystem        (java.lang:type=OperatingSystem)

10: sun.management.MemoryImpl        (java.lang:type=Memory)

11: sun.management.MemoryPoolImpl        (java.lang:name=Code Cache,type=MemoryPool)

12: sun.management.MemoryPoolImpl        (java.lang:name=Tenured Gen,type=MemoryPool)

13: sun.management.MemoryPoolImpl        (java.lang:name=Perm Gen,type=MemoryPool)

Enter the index of target/MBean you wish to monitor or press <Ctrl-C> to quit: 4

Following metric source types are available for selected target(s):
        0: JMX Attributes

Enter the index of your choice or press <Ctrl-C> to quit: 0

Attributes are:

        0: BootClassPath         Return Value: java.lang.String
        1: BootClassPathSupported        Return Value: boolean
        2: ClassPath     Return Value: java.lang.String
        3: InputArguments        Return Value: [Ljava.lang.String;
        4: LibraryPath   Return Value: java.lang.String
        5: ManagementSpecVersion         Return Value: java.lang.String
        6: Name  Return Value: java.lang.String
        7: SpecName      Return Value: java.lang.String
        8: SpecVendor    Return Value: java.lang.String
        9: SpecVersion   Return Value: java.lang.String
        10: StartTime    Return Value: long
        11: SystemProperties     Return Value:
javax.management.openmbean.TabularData
        12: Uptime       Return Value: long
        13: VmName       Return Value: java.lang.String
        14: VmVendor     Return Value: java.lang.String
        15: VmVersion    Return Value: java.lang.String
Select one or more items as comma-separated indices: 6,7,8

Number of possible columns in the resultant metric are 3.

Enter the name for this metric column at index=0 : [Name]
Is this column a KEY Column <y/n>? [n] y
Is this column for SUMMARY_UI <y/n>? [n]
Enter the label for column: [Name]
Enter the NLSID for column: [Name]
Enter the UNIT for column "Name": [millisec, kb etc.. ]

Enter the name for this metric column at index=1 : [SpecName]
Is this column a KEY Column <y/n>? [n]
Is this column for SUMMARY_UI <y/n>? [n]
Enter the label for column: [SpecName]
Enter the NLSID for column: [SpecName]
Enter the UNIT for column "SpecName": [millisec, kb etc.. ]
Do you want to create a threshold for this column <y/n>? [n]

Enter the name for this metric column at index=2 : [SpecVendor]
Is this column a KEY Column <y/n>? [n]
Is this column for SUMMARY_UI <y/n>? [n]
Enter the label for column: [SpecVendor]
Enter the NLSID for column: [SpecVendor]
Enter the UNIT for column "SpecVendor": [millisec, kb etc.. ]
Do you want to create a threshold for this column <y/n>? [n]

Enter the name of this metric: RuntimeMetric
Enter the label for this metric: [RuntimeMetric]

Do you want periodic collection for this metric <y/n>? [n] y
Enter the collection interval in seconds: 300
Periodic collection interval is: 300 seconds.

Do you want to create another metric <y/n>? [n]
Written the metadata xml file: ./metadata/myJavaApp.xml.
Creating new file: ./default_collection/myJavaApp.xml.
Updated the default collection file for myJavaApp at location
./default_collection/myJavaApp.xml.
Exiting...
Look at the currentDir/metadata and currentDir/default_collection directories to see the myTarget.xml files (for the target type you specified earlier).
You can use these files as follows:
Convert the files to an Oracle Plug-in Archive (OPAR) and push them from OMS to the Agent and target instances created from OMS. See Chapter 13, "Validating, Packaging, and Deploying the Plug-in" and Section 16.7.3, "Configuring a Standalone Java Application or JVM Target".
Edit the files, extract the metric definitions and QueryDescriptors, move them to other metadata and default collection files, and post-process them by creating ExecutionDescriptors as needed.
If you want the status information of your targets to appear correctly in the Enterprise Manager console, you need to define a Response metric. See Section 16.4.2, "Displaying Target Status Information" for more information.
The JMX fetchlet, supplied with 11.1 Management Agents, enables you to monitor key metrics in your JMX-instrumented applications deployed on Oracle WebLogic Application Server 9.x or later.Monitoring JMX-instrumented applications with Enterprise Manager entails defining a new target type that Enterprise Manager can monitor via Management Plug-ins. As with the Web services wscli command-line tool (and as was possible for Oracle Application Servers (OC4J), Enterprise Manager provides an jmxcli command-line tool to automate the generation of the target metadata and collection files for custom JMX instrumented applications on weblogic servers..
Oracle WebLogic Server 9.x instance running on a specific host with a JMX-enabled application deployed on it that needs to be monitored as a target in Enterprise Manager.
Management Agent version 11.1 or greater installed (preferably) on that host.
Oracle Management Server (OMS) version 10.2.0.4 or greater with which the Management Agent communicates.
The jmxcli tool primarily handles attributes and parameter and return values for operations that are OpenTypes. Examples: SimpleTypes, CompositeTypes, TabularTypes, and arrays of SimpleTypes.
As with Web services, the JMX command-line tool (jmxcli) simplifies creating the requisite target definition files: metadata and the default collection file. The tool is an offline configuration utility that connects you to an MBeanServer and enables you to browse available MBeans. It can also append metrics to an existing file during a subsequent invocation of the tool.During a command-line tool session, you select specific MBeans and then choose the desired JMX attributes/statistical values the Enterprise Manager needs to retrieve or JMX operations that need to be invoked periodically on these MBeans to collect these values. The tool helps define packaging for these collected values as one or more Enterprise Manager metrics (with columns), and also enables you to specify a metric collection interval and thresholds for the columns.
The JMX command-line tool syntax is as follows for a JMX-enabled target on an Oracle WebLogic Application Server:
./emctl jmxcli -t WebLogic [help|options]
  where options are:           [  -l JMX ServiceURL
              -u username
              -c credential/password
              -w work directory
              [-m MBeanName | -d jmx_domain | -s mBeanPattern]
                ]
The jmxcli command accepts the following options:
l - JMXServiceURL to the WebLogic managed server hosting the custom MBeans in the form
service:jmx:t3://host:t3port/jndi/weblogic.management.mbeanservers.runtime
u - Valid user name for the WebLogic domain. Default: "weblogic"
c - Password associated with the user specified by the -u option. Default: None. If you do not specify a password, you are prompted for the password.
w - Directory where the metadata and default collection files created by the JMX command-line tool are placed. Default: Current directory.
When invoking the command-line tool, you must have write permission on this directory to create subdirectories and add files. If the metadata and default collection files already exist within that directory, you have the option of appending to or overwriting the original files.
You can also specify ONE of the following three parameters (-m, -d or -s) to retrieve a subset of MBeans available on the MBeanServer. By default, all MBeans on the MBeanServer are displayed for you to select from if none of these parameters are specified.
m - MBean ObjectName of the required MBean that needs to be retrieved and examined. If this is an ObjectName pattern-matching multiple MBeans, you are shown a list of all MBeans that match the pattern, and you can select one at a time to work on.
d - MBean domain of the required application whose MBeans need to be retrieved and examined. For example, you want to browse all MBeans for an application (myApp). MBeans for this application would be available in the JMX domain "myApp".
s - MBean pattern-matching an existing set of MBeans from which the metrics are to be defined. The -s parameter allows retrieval of JMX Attributes/Statistics from multiple MBeans of a similar type into one Metric.
If you specify the -s parameter, the resulting metrics created during this jmxcli session appear as a table in the Enterprise Manager console with multiple rows - one row representing each MBean that matches the specified pattern (with the MBean ObjectName as a key column if no other key columns are defined). For example, if you specify -s 'com.bea:Type=ServletRuntime,*' the resulting metric will have multiple rows, one for each servlet that matches the ObjectName pattern. Besides the MBean ObjectName key column, other columns would be the attributes or fields from the return object of the operation, selected during the jmxcli session.
To start the JMX command-line tool:
Go to the $AGENT_HOME/bin directory.
Run the following command:
./emctl jmxcli -t WebLogic [OPTIONS]
Once invoked, the command-line interface automatically prompts you for the requisite information, as shown in the following example. If you need to quit a JMX command-line tool session, you can press Control+C at any point to exit. Session information will not be saved.
The following example illustrates a sample jmxcli session:
$ ./emctl jmxcli -t WebLogic -l "service:jmx:t3://stbct14:22048/jndi/weblogic.management.mbeanservers.runtime" -u weblogic -c welcome1 -s "*:type=soainfra_bpel_requests,*"
NOTE 1: The -s option above will result in a metric with as many rows as the number of MBeans which match the ObjectName pattern specified, every time the metric is collected by the agent. If you need to always collect from a specific Mbean then use the -m <ObjectName> option instead of the -s <Mbean pattern> used in above example.
NOTE 2: If you need to use t3s to connect to the weblogic server then the following env variable needs to be set before invoking the jmxcli
setenv USER_JAVA_PROPS=-Dweblogic.security.TrustKeyStore=CustomTrust
 -Dweblogic.security.CustomTrustKeyStoreFileName=$ORACLE_HOME/sysman/config/montrust/AgentTrust.jks
 -Dweblogic.security.SSL.enforceConstraints=off
 -Dweblogic.security.SSL.ignoreHostnameVerification=true
 -Djavax.net.ssl.trustStore=$ORACLE_HOME/sysman/config/montrust/AgentTrust.jks  (or set USER_JAVA_PROP= … equivalent on win32)
setenv USER_JARS  <; separated list of jars needed in classpath if custom authentication modules are involved in SSL connection>
A semi-colon is used as a delimiter for the list of jar files.
Example: setenv USER_JARS "jar1;jar2;jar3"
In some cases, if MBeans return custom WebLogic objects in their MBeanInfo, the weblogic.jar may need to be set to the above env variable before invoking the jmxcli.
Example: setenv USER_JARS $BEA_HOME/server/lib/weblogic.jar
oracleHome=/ade/sparmesw_egcli/oracle/work/middleware/oms
userJars=
Connecting to server:
 service:jmx:t3://stbct14:22048/jndi/weblogic.management.mbeanservers.runtime
Connecting as user: weblogic
Obtained 3 MBeans matching pattern *:type=soainfra_bpel_requests,*.

Enter the target type for this metric: [myJ2EEApp] myCustomWLApp
Enter the target version: [1.0]
Enter the target metadata file: [./metadata/myCustomWLApp.xml]
Enter the default collections file: [./default_collection/myCustomWLApp.xml]
Enter a label for this target type: [myCustomWLApp]
Enter a description for this target type: [myCustomWLApp]
The available targets are:
0: DMS metric mbean
        (oracle.dms:name=/soainfra/engines/bpel/requests/engine,type=soainfra_bpel_requests)
1: DMS metric mbean
        (oracle.dms:name=/soainfra/engines/bpel/requests/system,type=soainfra_bpel_requests)
2: DMS metric mbean
        (oracle.dms:name=/soainfra/engines/bpel/requests/invoke,type=soainfra_bpel_requests)
Following metric source types are available for selected target(s):
        0: JMX Attributes
Enter the index of your choice or press <Ctrl-C> to quit: 0
Attributes are:
        0: active_count  Return Value: java.lang.Integer
        1: active_maxValue       Return Value: java.lang.Integer
        2: active_minValue       Return Value: java.lang.Integer
        3: active_value  Return Value: java.lang.Integer
        4: Name  Return Value: java.lang.String
        5: Parent        Return Value: java.lang.String
        6: scheduled_count       Return Value: java.lang.Integer
        7: scheduled_maxValue    Return Value: java.lang.Integer
        8: scheduled_minValue    Return Value: java.lang.Integer
        9: scheduled_value       Return Value: java.lang.Integer
        10: threadCount_count    Return Value: java.lang.Integer
        11: threadCount_maxValue         Return Value: java.lang.Integer
        12: threadCount_minValue         Return Value: java.lang.Integer
        13: threadCount_value    Return Value: java.lang.Integer

Select one or more items as comma separated indices: 4,0,1,2
Number of possible columns in the resultant metric are 4.

Enter the name for this metric column at index=0 : [Name]
Is this column a KEY Column <y/n>? [n] y
Specifying "y" signifies that the value of this column is unique in case multiple rows are returned.
Is this column for SUMMARY_UI <y/n>? [n]
Enter the label for column: [Name]
Enter the NLSID for column: [Name]
Enter the UNIT for column "Name": [millisec, kb etc.. ]

Enter the name for this metric column at index=1 : [active_count]
Is this column a KEY Column <y/n>? [n]
Is this column for SUMMARY_UI <y/n>? [n]
Enter the label for column: [active_count]
Enter the NLSID for column: [active_count]
Enter the UNIT for column "active_count": [millisec, kb etc.. ]
Do you want to create a threshold for this column <y/n>? [n] y
Creating threshold!!
Following operators are available for creating thresholds:
 0: GT
 1: EQ
 2: LT
 3: LE
 4: GE
 5: CONTAINS
 6: NE
 7: MATCH

Enter the index of your choice or press <Ctrl-C> to quit: 0
Enter the CRITICAL threshold: [NotDefined] 50
Enter the WARNING threshold: [NotDefined] 45
Enter the number of occurrences that trigger threshold: [6] 3
Enter the message to be used when threshold is triggered: [active_count is %value% and has crossed warning (%warning_threshold%) or critical (%critical_threshold%) threshold.]
Enter NLSID for the message used when threshold is triggered: [active_count_cond] Enter the name for this metric column at index=2 : [active_maxValue]
Is this column a KEY Column <y/n>? [n]
Is this column for SUMMARY_UI <y/n>? [n]
Enter the label for column: [active_maxValue]
Enter the NLSID for column: [active_maxValue]
Enter the UNIT for column "active_maxValue": [millisec, kb etc.. ]
Do you want to create a threshold for this column <y/n>? [n]

Enter the name for this metric column at index=3 : [active_minValue]
Is this column a KEY Column <y/n>? [n]
Is this column for SUMMARY_UI <y/n>? [n]
Enter the label for column: [active_minValue]
Enter the NLSID for column: [active_minValue]
Enter the UNIT for column "active_minValue": [millisec, kb etc.. ]
Do you want to create a threshold for this column <y/n>? [n]

Enter the name of this metric: bpel_requests
Enter the label for this metric: [bpel_requests]

Do you want periodic collection for this metric <y/n>? [n] y
Enter the collection interval in seconds: 300
Periodic collection interval is: 300 seconds.

Do you want to create another metric <y/n>? [n]
Written the metadata xml file: ./metadata/myCustomWLApp.xml.
Creating new file: ./default_collection/myCustomWLApp.xml.
Updated the default collection file for myCustomWLApp at location ./default_collection/myCustomWLApp.xml.
Exiting...
Example 16-16 Sample jmxcli Invocation (using -m and defining multiple metrics from multiple Mbeans in one jmxcli session
$ ./emctl jmxcli -t WebLogic -l "service:jmx:t3://stbct14:22048/jndi/weblogic.management.mbeanservers.runtime" -u weblogic -c welcome1 -m "com.bea:ApplicationRuntime=soa-infra,WebAppComponentRuntime=soa_server1_/b2b,*"

oracleHome=/ade/sparmesw_egcli/oracle/work/middleware/oms
userJars=
Connecting to server: service:jmx:t3://stbct14:22048/jndi/weblogic.management.mbeanservers.runtime
Connecting as user: weblogic
Obtained 8 MBeans matching pattern com.bea:ApplicationRuntime=soa-infra,WebAppComponentRuntime=soa_server1_/b2b,*.

Enter the target type for this metric: [myJ2EEApp] myCustomWLApp

Enter the target version: [1.0]

Enter the target metadata file: [./metadata/myCustomWLApp.xml]

Enter the default collections file: [./default_collection/myCustomWLApp.xml]
The file ./metadata/myCustomWLApp.xml already exists.

Do you want to overwrite the existing file, append to it, or quit <o/a/q>? [a]
Note: Because the file already exists, it will be appended.
Appending to existing file: ./metadata/myCustomWLApp.xml.
The available targets are:
0: (com.bea:ApplicationRuntime=soa-infra,Name=JspServlet,ServerRuntime=soa_server1,Type=ServletRuntime,WebAppComponentRuntime=soa_server1_/b2b)
1: (com.bea:ApplicationRuntime=soa-infra,Name=transportServlet,ServerRuntime=soa_server1,Type=ServletRuntime,WebAppComponentRuntime=soa_server1_/b2b)
2: (com.bea:ApplicationRuntime=soa-infra,Name=transportServletV,ServerRuntime=soa_server1,Type=ServletRuntime,WebAppComponentRuntime=soa_server1_/b2b)
3: (com.bea:ApplicationRuntime=soa-infra,Name=b2b_starter_wls,ServerRuntime=soa_server1,Type=ServletRuntime,WebAppComponentRuntime=soa_server1_/b2b)
4: (com.bea:ApplicationRuntime=soa-infra,Name=soa_server1_soa_server1_/b2b,ServerRuntime=soa_server1,Type=PageFlowsRuntime,WebAppComponentRuntime=soa_server1_/b2b)
5 (com.bea:ApplicationRuntime=soa-infra,Name=WebServiceServlet,ServerRuntime=soa_server1,Type=ServletRuntime,WebAppComponentRuntime=soa_server1_/b2b)
6: (com.bea:ApplicationRuntime=soa-infra,Name=RedirectUIServlet,ServerRuntime=soa_server1,Type=ServletRuntime,WebAppComponentRuntime=soa_server1_/b2b)
7: (com.bea:ApplicationRuntime=soa-infra,Name=FileServlet,ServerRuntime=soa_server1,Type=ServletRuntime,WebAppComponentRuntime=soa_server1_/b2b)
Enter the index of target/MBean you wish to monitor or press <Ctrl-C> to quit: 4
Following metric source types are available for selected target(s):
        0: JMX Attributes
        1: JMX Operations
Enter the index of your choice or press <Ctrl-C> to quit: 0

Attributes are:
        0: AppName       Return Value: java.lang.String
        1: ContextPath   Return Value: java.lang.String
        2: HttpServerName        Return Value: java.lang.String
        3: Name  Return Value: java.lang.String
        4: PageFlows     Return Value: [Ljavax.management.ObjectName;
        5: Parent        Return Value: javax.management.ObjectName
        6: ServerName    Return Value: java.lang.String
        7: Type  Return Value: java.lang.String

Select one or more items as comma separated indices: 3,0,1

Number of possible columns in the resultant metric are 3.
Enter the name for this metric column at index=0 : [Name]
Is this column a KEY Column <y/n>? [n] y
Is this column for SUMMARY_UI <y/n>? [n]
Enter the label for column: [Name]
Enter the NLSID for column: [Name]
Enter the UNIT for column "Name": [millisec, kb etc.. ]

Enter the name for this metric column at index=1 : [AppName]
Is this column a KEY Column <y/n>? [n]
Is this column for SUMMARY_UI <y/n>? [n]
Enter the label for column: [AppName]
Enter the NLSID for column: [AppName]
Enter the UNIT for column "AppName": [millisec, kb etc.. ]
Do you want to create a threshold for this column <y/n>? [n]

Enter the name for this metric column at index=2 : [ContextPath]
Is this column a KEY Column <y/n>? [n]
Is this column for SUMMARY_UI <y/n>? [n]
Enter the label for column: [ContextPath]
Enter the NLSID for column: [ContextPath]
Enter the UNIT for column "ContextPath": [millisec, kb etc.. ]
Do you want to create a threshold for this column <y/n>? [n]
Enter the name of this metric: PageFlowsRuntime
Enter the label for this metric: [PageFlowsRuntime]

Do you want periodic collection for this metric <y/n>? [n] y
Enter the collection interval in seconds: 3600
Periodic collection interval is: 3600 seconds.

Do you want to create another metric <y/n>? [n] y
This indicates more metrics need to be created in this jmxcli session. This process will repeat until you answer "n" to the question.
Do you want to create another metric <y/n>? [n] Written the metadata xml file: ./metadata/myCustomWLApp.xml.Updated the default collection file for myCustomWLApp at location ./default_collection/myCustomWLApp.xml.Exiting...
After the JMX command-line tool generates the target metadata and collection files, you can create the Oracle Plug-in archive (OPAR).
For the status information of your targets to appear correctly within the Enterprise Manager console, you must define a metric, called Response, that has a column, named Status, with a critical threshold set. The status of target instances of this type appears in the console as "Up" (available) if the metric value is below the critical threshold. When the threshold is exceeded, the target status appears as "Down" in the console.
You can create the Response metric in another jmxcli session (append the metric to the metadata and collection files created in an earlier session).
Example 16-17 Adding a Response Metric
setenv USER_JARS $T_WORK/middleware/wlserver_10.3/server/lib/weblogic.jar
This is required as some MBeans return WebLogic-specific classes which the JMX client (jmxcli) needs in its classpath.
$ ./emctl jmxcli -t WebLogic -l "service:jmx:t3://stbct14:22048/jndi/weblogic.management.mbeanservers.runtime" -u weblogic -c welcome1 -m com.bea:Type=ApplicationRuntime,Name=soa-infra,*"
For J2EE applications deployed on WebLogic it may be appropriate to make the ActiveVersionState JMX attribute of the ApplicationRuntime Mbean corresponding to the application deployment as the Status column. However, any other attribute of any other relevant Mbean to the application could also be used.
oracleHome=/ade/sparmesw_egcli/oracle/work/middleware/oms
userJars=
Connecting to server: service:jmx:t3://stbct14:22048/jndi/weblogic.management.mbeanservers.runtime
Connecting as user: weblogic
Obtained 1 MBeans matching pattern
 com.bea:Type=ApplicationRuntime,Name=soa-infra,*.
Enter the target type for this metric: [myJ2EEApp] myCustomWLApp
Enter the target version: [1.0]
Enter the target metadata file: [./metadata/myCustomWLApp.xml]
Enter the default collections file: [./default_collection/myCustomWLApp.xml]
The file ./metadata/myCustomWLApp.xml already exists.

Do you want to overwrite the existing file, append to it, or quit <o/a/q>? [a]
Appending to existing file: ./metadata/myCustomWLApp.xml.
The available targets are:
0: (com.bea:Name=soa-infra,ServerRuntime=soa_server1,Type=ApplicationRuntime)
Enter the index of target/MBean you wish to monitor or press <Ctrl-C> to quit: 0
Following metric source types are available for selected target(s):
        0: JMX Attributes
        1: JMX Operations
Enter the index of your choice or press <Ctrl-C> to quit: 0
Attributes are:
        0: ActiveVersionState    Return Value: java.lang.Integer
        1: ApplicationName       Return Value: java.lang.String
        2: ApplicationVersion    Return Value: java.lang.String
        3: ClassRedefinitionRuntime      Return Value: javax.management.ObjectName
        4: ComponentRuntimes     Return Value: [Ljavax.management.ObjectName;
        5: EAR   Return Value: java.lang.Boolean
        6: HealthState   Return Value: weblogic.health.HealthState
        7: KodoPersistenceUnitRuntimes   Return Value: [Ljavax.management.ObjectName;
        8: LibraryRuntimes       Return Value: [Ljavax.management.ObjectName;
        9: MaxThreadsConstraintRuntimes  Return Value: [Ljavax.management.ObjectName;
        10: MinThreadsConstraintRuntimes         Return Value: [Ljavax.management.ObjectName;
        11: Name         Return Value: java.lang.String
        12: OptionalPackageRuntimes      Return Value: [Ljavax.management.ObjectName;
        13: Parent       Return Value: javax.management.ObjectName
        14: QueryCacheRuntimes   Return Value: [Ljavax.management.ObjectName;
        15: RequestClassRuntimes         Return Value: [Ljavax.management.ObjectName;
        16: Type         Return Value: java.lang.String
        17: WorkManagerRuntimes  Return Value: [Ljavax.management.ObjectName;
        18: WseeRuntimes         Return Value: [Ljavax.management.ObjectName;

Select one or more items as comma separated indices: 0

Number of possible columns in the resultant metric are 1.

Enter the name for this metric column at index=0 : [ActiveVersionState] Status
Note: The column name must be "Status".
Is this column a KEY Column <y/n>? [n]
Is this column for SUMMARY_UI <y/n>? [n]
Enter the label for column: [Status]
Enter the NLSID for column: [Status]
Enter the UNIT for column "Status": [millisec, kb etc.. ]
Do you want to create a threshold for this column <y/n>? [n] y
Creating threshold!!
Following operators are available for creating thresholds:
 0: GT
 1: EQ
 2: LT
 3: LE
 4: GE
 5: CONTAINS
 6: NE
 7: MATCH

Enter the index of your choice or press <Ctrl-C> to quit: 6
Enter the CRITICAL threshold: [NotDefined] 2
Status of target is marked down if a CRITICAL THRESHOLD is triggered on the Status column of the Response Metric. In this case if value != ACTIVATED (such as: != 2)
Enter the WARNING threshold: [NotDefined]
Enter the number of occurrences that trigger threshold: [6] 1
Enter the message to be used when threshold is triggered: [Status is %value% and has crossed warning (%warning_threshold%) or critical (%critical_threshold%) threshold.]
Enter NLSID for the message used when threshold is triggered: [Status_cond]

Enter the name of this metric: Response
Note: The metric name must be "Response".
Enter the label for this metric: [Response]

Do you want periodic collection for this metric <y/n>? [n] y
Enter the collection interval in seconds: 30
Periodic collection interval is: 30 seconds.

Do you want to create another metric <y/n>? [n]
Written the metadata xml file: ./metadata/myCustomWLApp.xml.
Updated the default collection file for myCustomWLApp at location ./default_collection/myCustomWLApp.xml.
Exiting...
Look at the currentDir/metadata and currentDir/default_collection directories to see the myTarget.xml files (for the target type you specified earlier).
You can use these files as follows:
Convert the files to an Oracle Plug-in Archive (OPAR). See Section 13.4, "Creating the Plug-in Archive".
Move the OPAR to the OMS. See Section 13.5, "Importing and Deploying the Plug-in Archive into Enterprise Manager".
Push the OPAR to the Agents. See Section 13.5, "Importing and Deploying the Plug-in Archive into Enterprise Manager".
Create custom target instances. See Section 16.7.4, "Adding a Target Instance for a Custom J2EE Application on WebLogic"
If you want the status information of your targets to appear correctly in the Enterprise Manager console, you need to define a Response metric. See Section 16.6.1.3, "Displaying Target Status Information" for more information.
Once the plug-in has been deployed to the OMS, you are ready to add targets defined by your metadata plug-in to different monitoring Management Agents.
For illustrative purposes, the following steps show how to add the sample CalculatorService and TrafficLight as targets.
To add the CalculatorService target, perform the following steps:
From the Setup menu, select Add Target and then Add Targets Manaully.
Select Add Non-Host Targets by Specifying Target Monitoring Properties.
From the Target Type menu, select CalculatorService.
From the Monitoring Agent menu, select the required monitoring Management Agent.
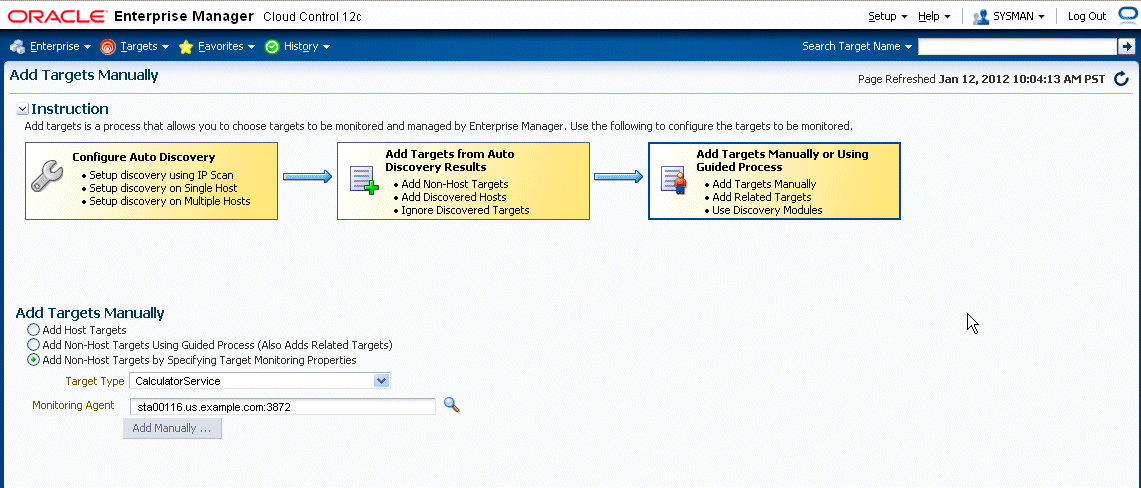
Click Add Manaully to proceed.
Enter the property values of the target to be monitored.
Click OK to complete the process. The confirmation window displays information on the newly added target.
To add the sample TrafficLight target, perform the following steps:
From the Setup menu, choose Add Target and then Add Targets Manually.
Select Add Non-Host Targets by Specifying Target Monitoring Properties.
Select TrafficLight from the Target Type drop-down menu.
Select the desired agent from the Monitoring Agent drop-down menu.
Click Add Manually to proceed.
Enter the property values of the target to be monitored.
Click OK to complete the process. The confirmation window displays information on the newly added target.
If you deployed a plug-in that defines a standalone Java application or you want to use the built-in JVM target type, you can begin configuring your JVM or JMX-enabled Java application targets so that metrics for these targets can be collected in Enterprise Manager Cloud Control.
On the system running the JVM, install an Enterprise Manager Agent version 10.2.0.3 or later. Although recommended, this is not necessary for JVM and standalone Java application targets.
To add the JVM target instance, perform the following steps:
From the Setup menu of Enterprise Manager console (top right), select Add Target and then Add Targets Manually.
Select Add Non-Host Targets by Specifying Target Monitoring Properties.
From the Target Type menu, select JVM.
From the Monitoring Agent list, select the required Management Agent (preferably a Management Agent local to the JVM being monitored).
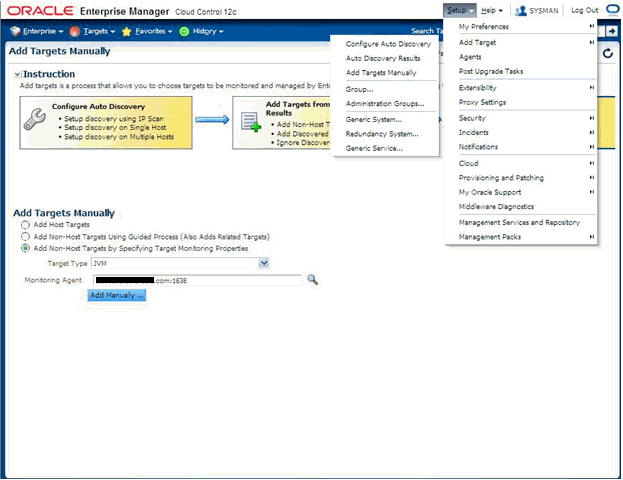
Enter the instance properties for this JVM or Java application instance that the Management Agent needs to monitor, then click OK.
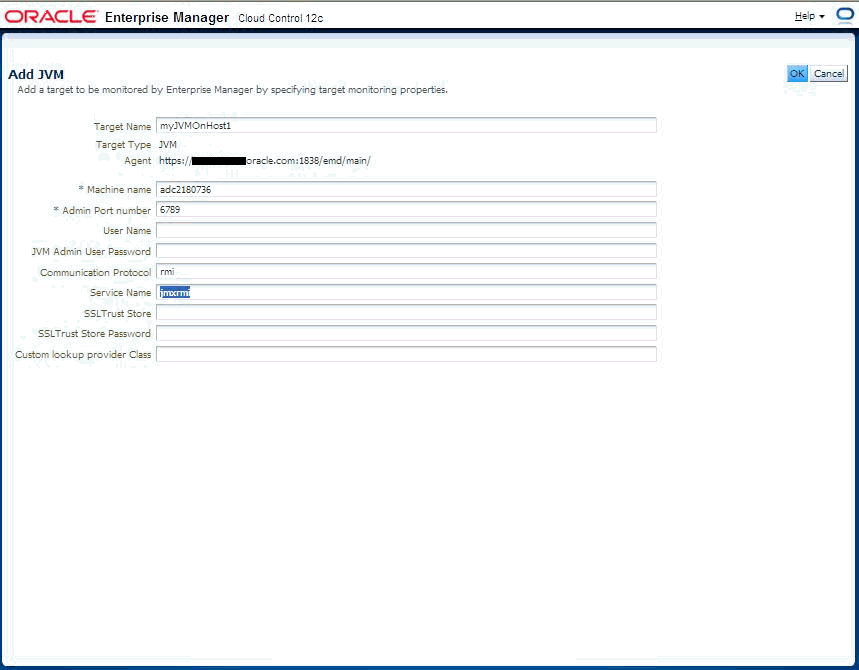
Table 16–1 provides definitions for the instance properties.
Table 16-1 JVM Instance Properties
| Property | Definition |
|---|---|
|
Name |
Target name for this JVM instance. |
|
MachineName |
Host name where this JVM is running. |
|
Admin Port Number |
Port number a JSR-160 client can use (such as jconsole when using the “remote” option) to connect to the JVM. (This is the port specified for the |
|
User Name |
Required if JVM started with: |
|
JVM Admin User Password |
See the preceding User Name property. |
|
Communication Protocol |
Establishes a connection to the MBeanServer on the target JVM. This corresponds to the properties of the JMX ServiceURL needed to establish the JMX connection to the target MBeanServer. The default of rmi should be retained. |
|
Service Name |
Establishes a connection to the MBeanServer on the target JVM. This corresponds to the properties of the JMX ServiceURL needed to establish the JMX connection to the target MBeanServer. The default of jmxrmi should be kept. |
|
SSL Trust Store |
Location of the SSL Trust Store, which is needed if the target JVM has SSL enabled with |
|
SSL Trust Store Password |
Password needed to access the SSL Trust Store path. |
|
Custom Lookup Provider Class |
Full package name of a user-implemented Java lookup class that can be integrated into the Enterprise Manager client and be used to perform a custom lookup of the MBeanServer through LDAP or other lookup protocols. |
Navigate to the All Metrics page of the added JVM (Java application) target to see the metrics collected from the JVM (Java application) to Enterprise Manager. These metrics are exposed by the platform MBeans, which is available on JDK1.5 or above, or from application-defined MBeans for your Java application.
To navigate to JVM target home page from the Targets menu, choose All Targets and then select your JVM target instance.
To navigate to the All Metrics page, from the Target menu, select Monitoring and then All Metrics from the JVM target's home page menu.
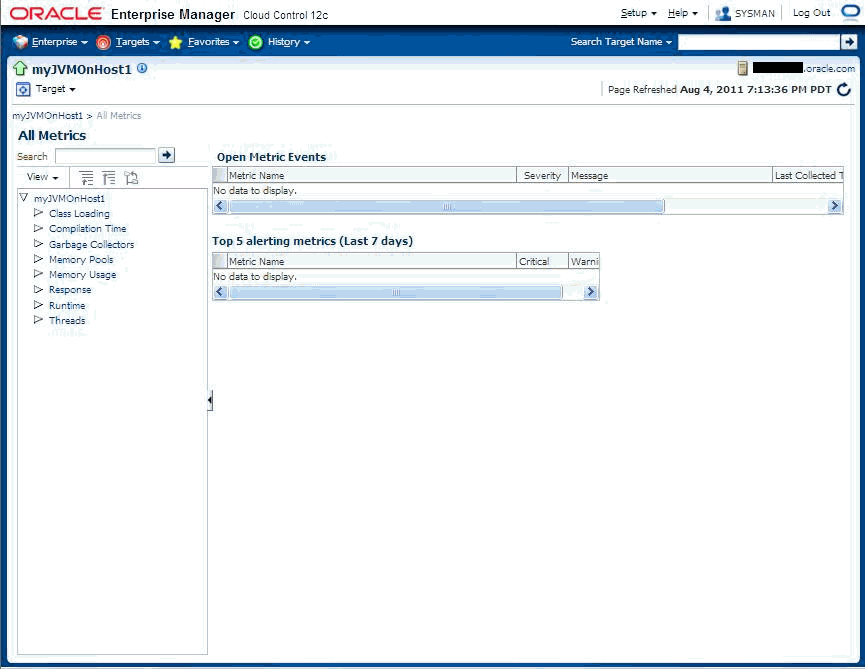
The following graphic shows the collected metric details.
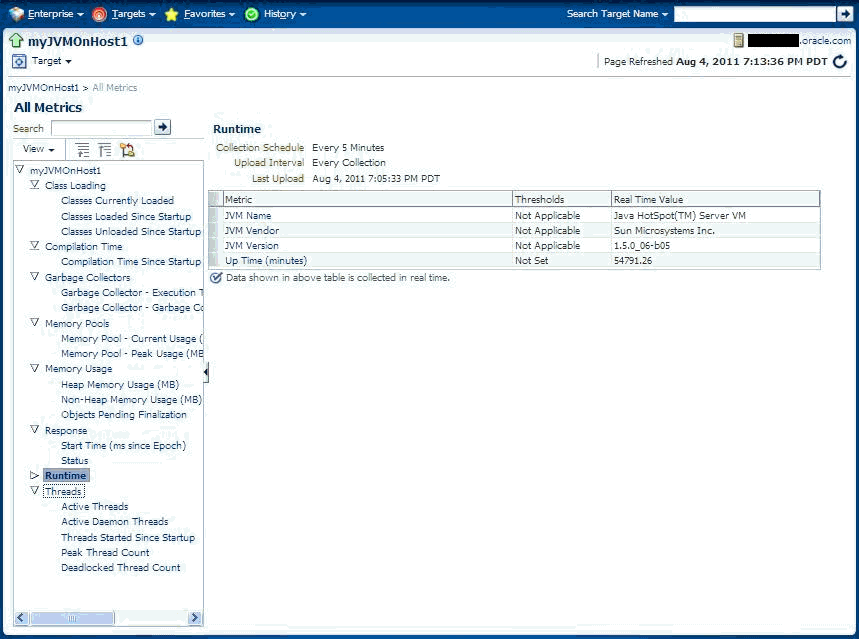
Table 16-2 Properties the Fetchlet Uses
| Property | Default | Description |
|---|---|---|
|
MachineName |
localhost |
MBean server host machine name. |
|
Port |
8888 |
Port on which the MBean server is listening for connections. |
|
Username |
null |
User name if required for a connection. |
|
Password |
null |
Password if required for a connection. |
|
Protocol |
rmi |
Protocol used for the connection. |
|
Service |
jmxrmi |
Service used for the connection. |
|
SSLTrustStore |
null |
Path to the SSLTrustStore. |
|
SSLTrustStorePassword |
null |
Password needed to access the SSLTrustStore path. |
You have a custom J2EE application on WebLogic from which you need to collect custom metrics into Enterprise Manager that are exposed via JMX Mbeans. Once you have defined and deployed a plug-in that defines your custom target type, you can begin configuring your JMX-enabled J2EE application target instances on the various Management Agents to where you deployed the plug-ins. This enables Enterprise Manager to collect metrics for these target instances.
From the Setup menu, select Add Target and then Add Target Manually. Select the Add non-Host targets by specifying Target Monitoring Properties option.
Select your custom target type created earlier and deployed to the OMS
Select the monitoring Management Agent where you want to create an instance of this target type (this should preferably be an emagent local to the target)
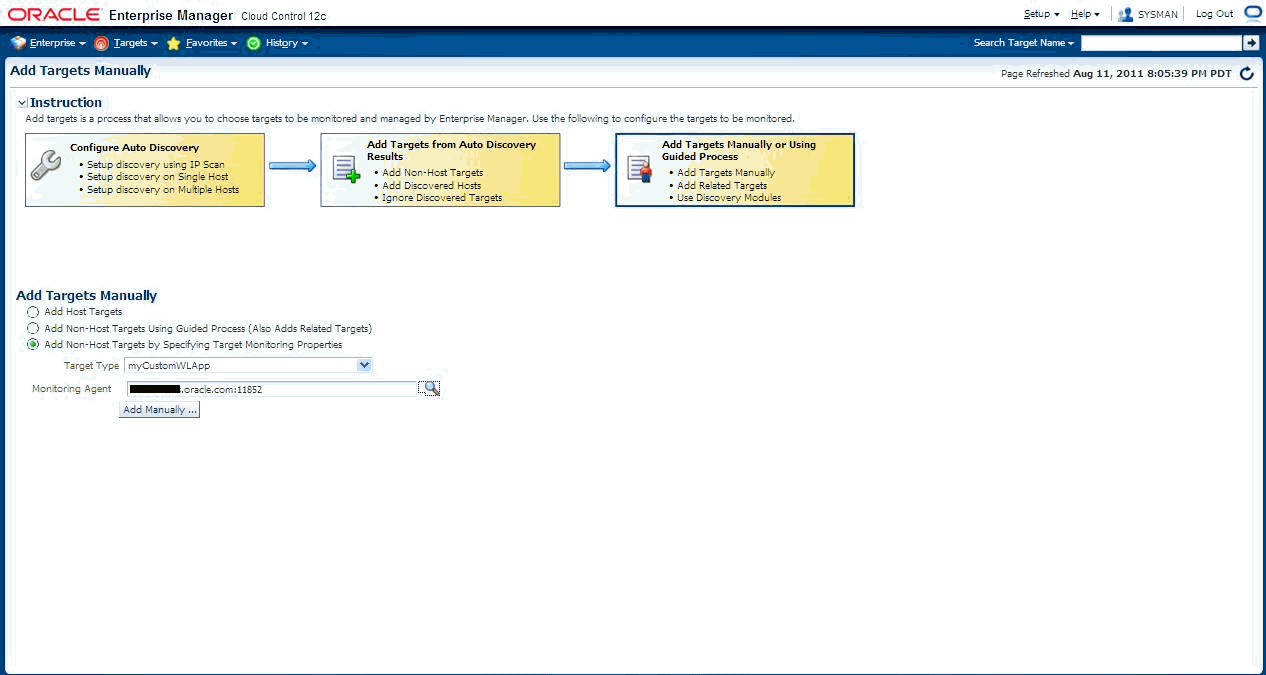
Click Add Manually.
Enter the requisite target properties, as shown in the following graphic, then click OK. The newly added target appears in the "All Targets" list.
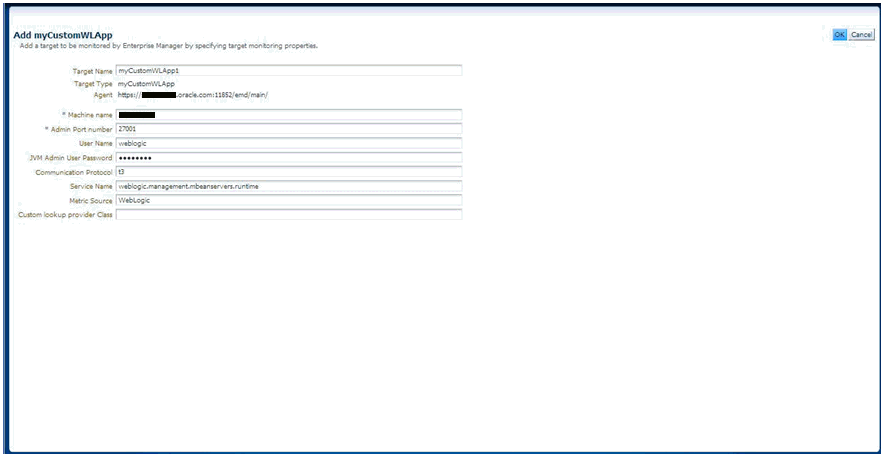
| Property | Definition |
|---|---|
|
Name |
Unique name for this target instance. |
|
MachineName |
Host name/IP Address of the system running the 9.x version or later of the Oracle WebLogic Application Server. |
|
Username |
User Name used to establish the JMX connection to the WebLogic server. This could be either an administrator or monitor user. |
|
JVM Admin User Password |
Password for preceding user. |
|
Communication Protocol |
t3 (default) or t3s. |
|
Service Name |
weblogic.management.mbeanservers.runtime (or other MbeanServer where the application registers its Mbeans). |
|
Metric Source |
WebLogic |
The metrics created can be viewed by navigating to the target instance home page and navigating to the All Metrics page (from the Target menu, choose Monitoring and then All Metrics).
Some target types require monitoring credentials to be set for target instances. In the demo plug-ins, both CalculatorService and TrafficLight require monitoring credentials. The following steps demonstrate how to set up the credentials:
From the Setup menu, select Security and then Monitoring Credentials.
Select CalculatorService and then click Manage Monitoring Credentials.
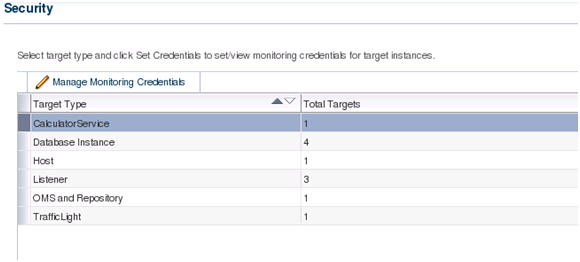
Select Calculator1 and then click Set Credentials.
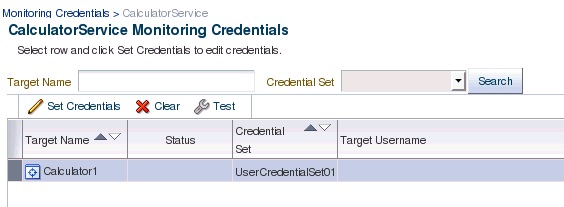
Select AliasCredential from Credential Type. Enter values for Alias and Password.
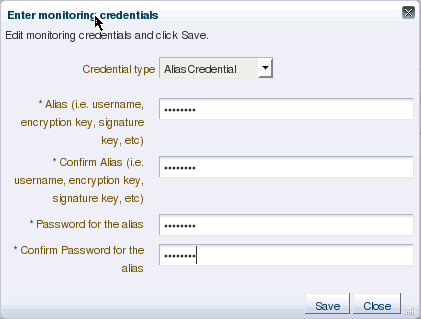
Click Save to finish.
Repeat the above steps for the target TrafficLight1.
With a target instance added to the Management Agent for monitoring, you can now view metrics defined for your target type. As before, the sample targets are used to illustrate the procedure.
From the All Targets page, click the target you added in the previous step. Enterprise Manager takes you to that target's home page.
From the Target menu, select Monitoring and then All Metrics. The All Metrics page appears for the monitored target. An expandable tree list for each metric enables you to drill down to view specific metric parameters, as shown below:
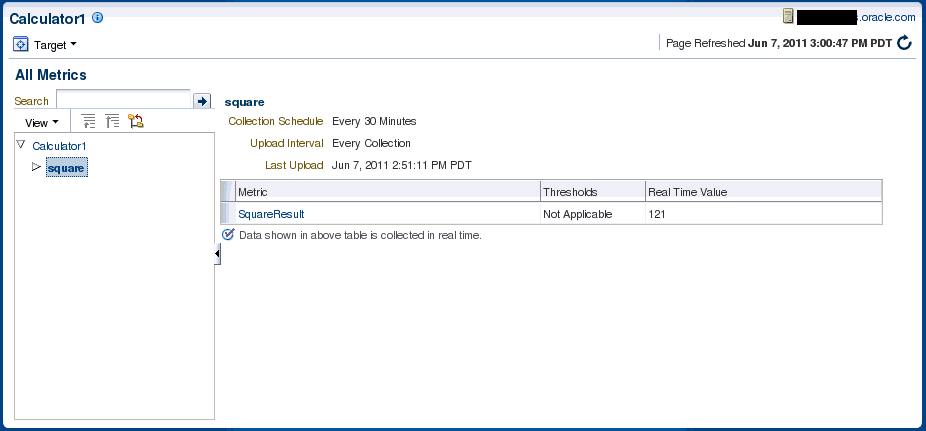
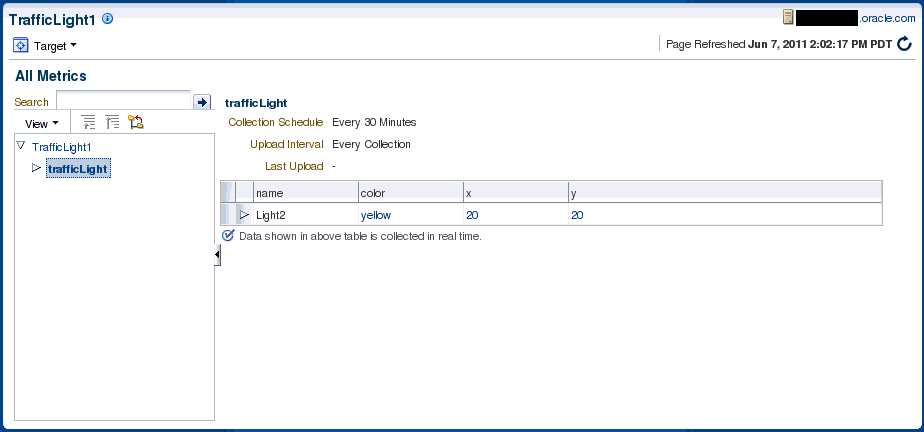
If you wish to collect metrics from your custom J2EE application deployed on Oracle Fusion middleware and exposed via JMX attributes into Enterprise Manager 12c, you can use either the Enterprise Manager console or the jmxcli command line tool. The latter also supports defining Metric Extensions from JMX operations and supports the creation of a Metric Extension Archive (MEA) which then must be imported into the OMS via the console and then tested and deployed to the desired J2EE application target instances representing your custom application.
Note:
While you can select attributes that are not open types using the Mbean browser, the JMX metric extension UI supports only open type attributes. An error will occur if the UI is used to create metrics by selecting attributes which are not open types.From the Enterprise menu, select Monitoring and the Metric Extensions. The Metric Extension page displays.
Click Create to create a Metric Extension.
Select "Application Deployment" target type (or any other appropriate Enterprise Manager target type for which this metric needs to be defined) and specify a meaningful name for your metric extension. Keep in mind that you might eventually end up creating additional metric extensions on the "Application Deployment" target type both for this application and for other custom applications so it is desirable to capture both the metric name and the application name in the metric extension name, whenever possible.
Also select JMX for the Adapter.
Note the "Collection Schedule" section below the "General Properties" section. This is where you define how often this metric is to be collected, or if this is realtime-only metric (in which case the Disabled button should be selected.).
If "Alerting and Historical Trending" is selected, you can also select an Upload Interval, which indicates which samples (whose frequency is specified in the "Repeat Every" field) are uploaded to the Enterprise Manager repository for historical trending. For example if Collection frequency is specified as 15 minutes and the Upload Interval is 3, then every 3rd sample will be uploaded into the repository (every 45 minutes) and will be available for historical trending. However "alerts" that are possibly triggered due to threshold violations will be available for every collection (15 minutes).
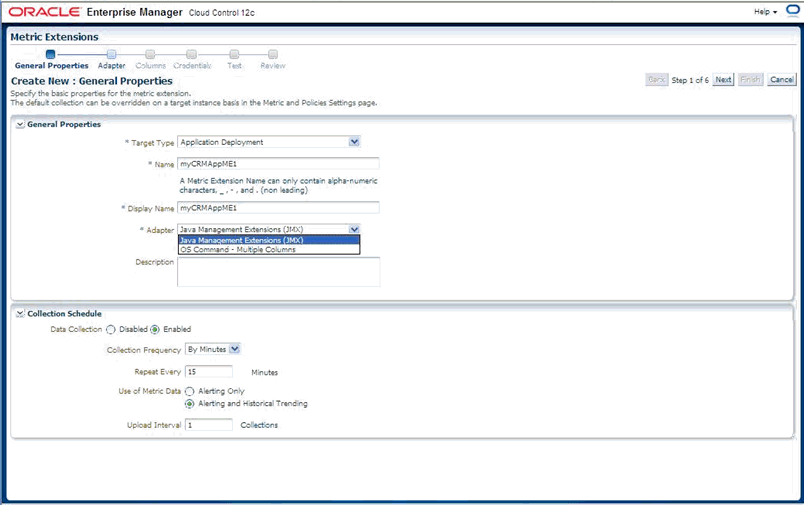
Click Next and specify the required properties needed for a JMX-based metric. These are defined in the Basic Properties section and are:
Metric: The Mbean ObjectName or Pattern and
Column Order: A semi-colon separated list of JMX attributes for above Mbean (if a metric needs to be defined using a JMX operation, use the jmxcli as shown in a following section)
Note that the Mbean ObjectName or pattern defined previously must not have any server-specific key properties defined. These properties may be replaced with a wildcard ("*").
For example, if an Mbean object name is com.bea:Type=foo,Location=Server1,Name=abc then it may be appropriate to define this as com.bea:Type=foo,* in the "Metric" property described above. Also, if the Mbean ObjectName is a pattern, please be aware that multiple Mbeans could be returned making this metric a "table" with multiple rows (each row representing the JMX attributes of an Mbean matching the ObjectName pattern). In this case we need to define at least one or more columns as Key columns so that each row is unique in the resultant metric.
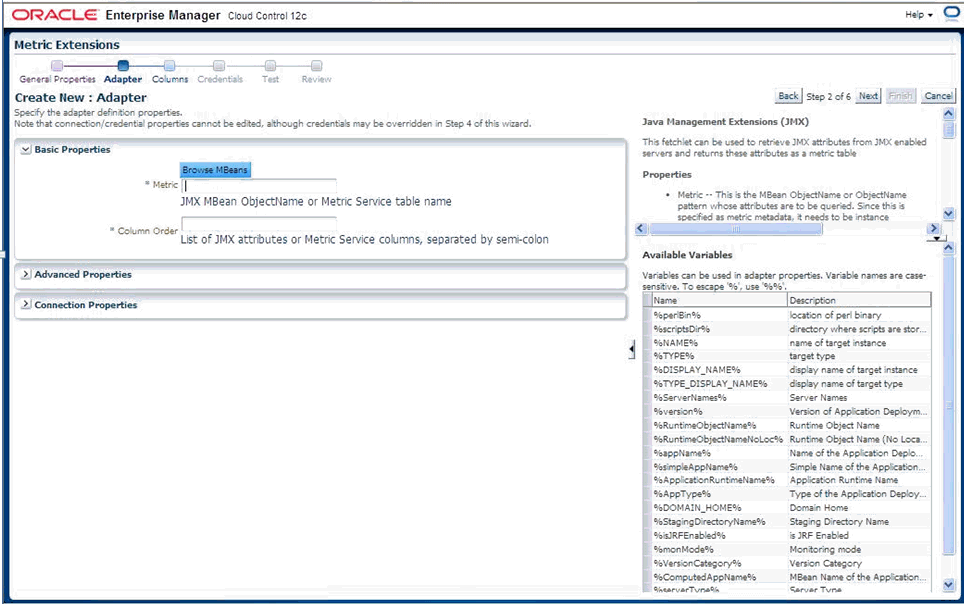
For the preceding step, there is a Browse Mbeans button that makes it easier to configure these two properties by allowing you to browse an MbeanServer and selecting an Mbean and its JMX attributes that need to be represented by this metric being defined in the metric extension.
If you click Browse Mbeans, you must perform the following in sequence.
Select the Target: Select an instance of the target type that you need to use to define this metric. This target instance is used to help configure the metric and does not have to be the target instance on which the metric is eventually defined.
Enter the Mbean Pattern: Here, you enter an Mbean Object Name or pattern for the Mbean you are interested in monitoring
Click List Mbeans: This will be displayed in the table under "Select Mbean and Attributes", the Mbeans that match the Mbean pattern or the text "No Mbean listed or none matches Mbean Pattern" if there is no match. You can iteratively update the previous "Enter Mbean pattern" field and click List Mbeans to refine the list of Mbeans displayed.
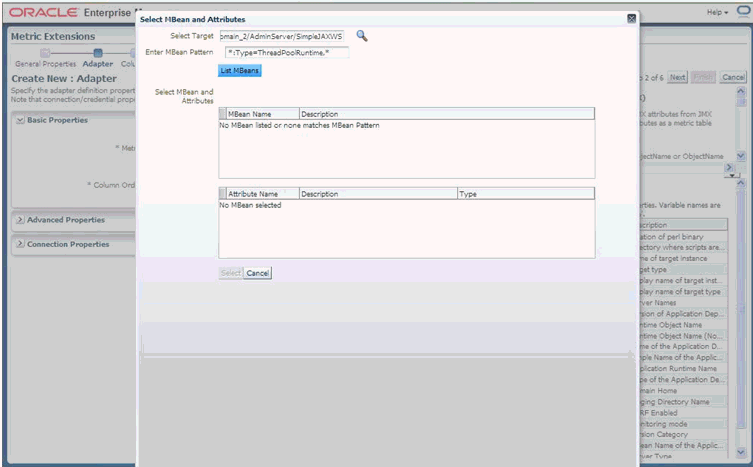
Select an Mbean of interest: This will automatically populate the table below with the JMX attributes for the selected Mbean.
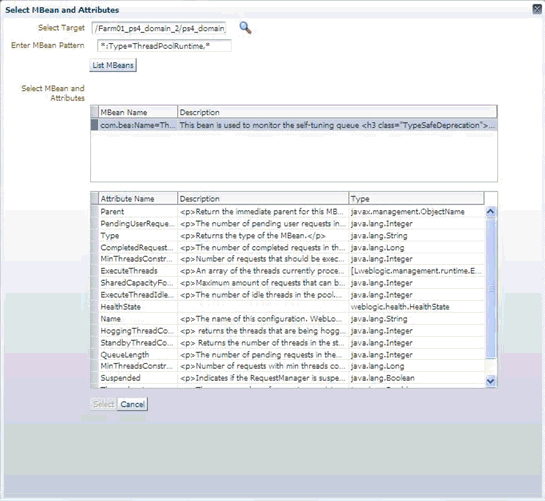
You can multi-select (using Control + click) multiple attributes and then click Select to accept the selections.
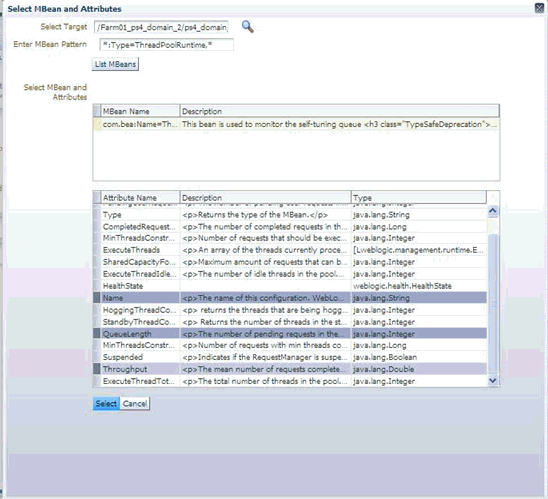
You must now specify the required parameters "Metric" and "Column Order" needed to define a JMX based metric extension.
Note that the Mbean name populated in the "Metric" field should not have any instance specific information in its key properties (like Location=Server1 or ServerName=foo) if this metric extension can be applied to multiple servers besides the one that was selected/used to configure the metric extension using the "Browse Mbean" wizard above. These instance-specific key properties could be replaced with a wildcard "*" as appropriate to make this a valid Mbean ObjectName pattern.
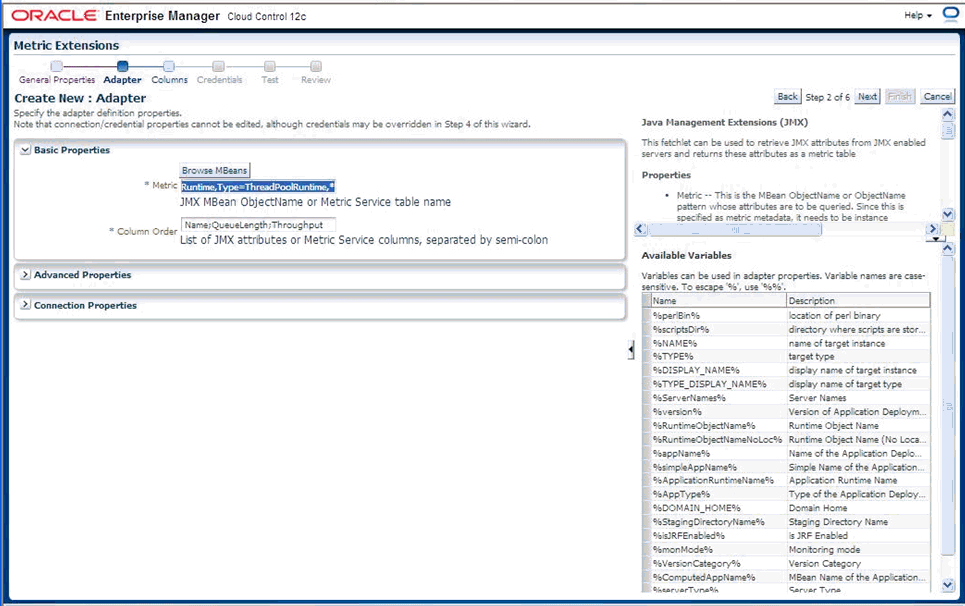
Explanation of Specifiable Properties
Required Properties:
metric -- This is the MBean ObjectName or ObjectName pattern whose attributes are to be queried. Since this is specified as metric metadata, it needs to be instance agnostic so instance specific key-properties if any (like servername), on the MBean ObjectName may need to be replaced with wildcards.
columnOrder -- This is a semi colon separated list of JMX attributes in the order they need to be presented in the metric
Advance Properties:
identityCol -- This is an MBean key property that needs to be surfaced as a column when it is not available as a JMX attribute. For example: com.myCompany:Name=myName,Dept=deptName, prop1=prop1Val, prop2=prop2Val In above case setting identityCol as Name;Dept (note that separator is a semi-colon) will result in two additional key columns representing Name and Dept besides the columns representing the JMX attributes specified in the columnOrder property above.
autoRowId -- This is the prefix used for an automatically generated row in case the MBean ObjectName pattern specified in metric property matches multiple MBeans and none of the JMX attributes specified in the columnOrder are unique for each. The autoRowId value specified here will be used as a prefix for the additional key column created. For example, if the metric is defined as com.myCompany:Type=CustomerOrder,* columnOrder is CustomerName;OrderNumber;DateShipped (and assuming customerName;OrderNumber;DateShipped may not be unique if an order is shipped in two parts).
Setting autoRowId as "ShipItem-" will populate an additional key column for the metric for each row with ShipItem-0, ShipItem-1.
MetricService -- True/False indicates whether MetricService is enabled on the target WebLogic domain. This would be unchecked or false in most cases for user-defined metrics except when metrics that are exposed via the Oracle DMS MBean needs to be collected. If set to true, then the basic property "metric" above should represent the MetricService table name and the basic property "columnOrder" will represent a semicolon separated list of column names for aforementioned MetricService table.
Specify the Columns for this metric (if you have used the "Browse Mbeans" step earlier, then these columns are automatically pre-filled for you). You may need to edit these pre-created columns by the "Browse Mbean" wizard to specify columns that are "Key columns". This done in the event an Mbean pattern is specified in the previous step for the "Metric" property, and multiple Mbeans could match this Mbean pattern for any of the target instances to which this metric extension will be applied to.
If the order of the columns are changed (using Move Up - Move Down buttons) then the corresponding order of the semi-colon separated columns in the "Column Order" property in the previous step also needs to be updated accordingly (using Back).
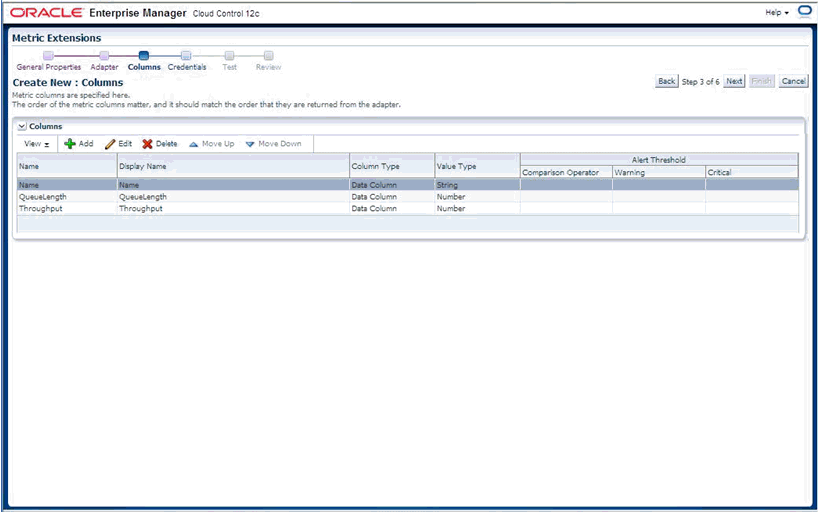
If needed, edit the columns as desired to make them a Key Column as shown in the following graphic.
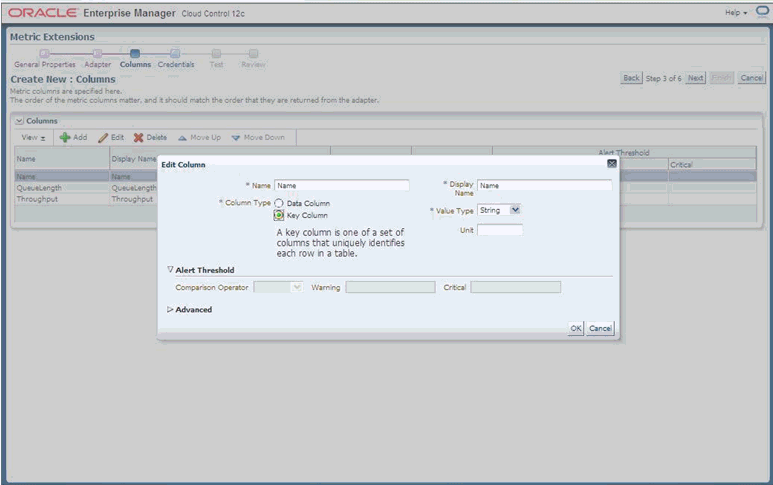
Once columns are labeled and edited, click Next. We are now ready to test the metric extension
Click Add to select a target instance on which to test this metric extension. This could preferably be a different target instance than the one used to define the metric extension (if the Browse Mbeans button was used to help in defining the metric extension earlier).
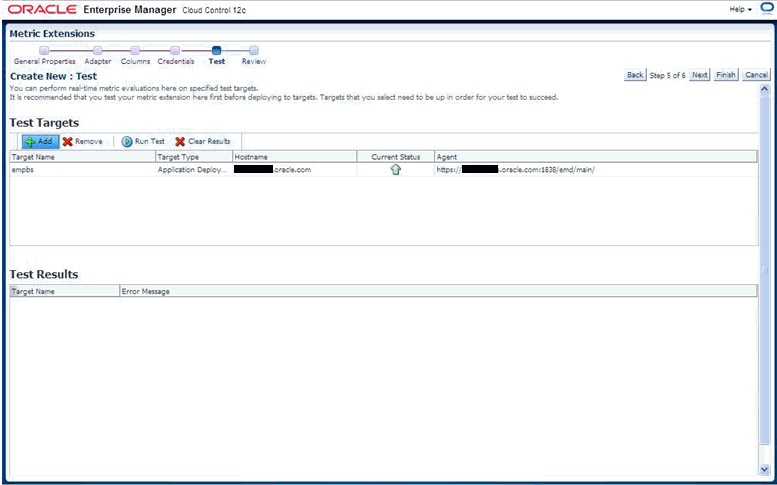
Now select a target instance in the Test Targets table and then click Run Test above that table.
The metric values are displayed in the Test Results table (if there are errors ,then those are also shown ).
If errors are present, click Back and fix the errors and re-run the test.
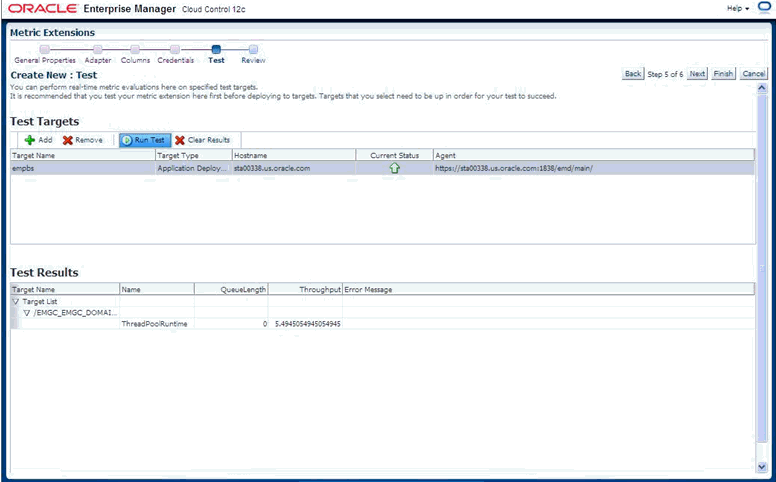
Once satisfied with the Test, click Next to view a summary of the metric extension and then click the Finish to define the metric extension.
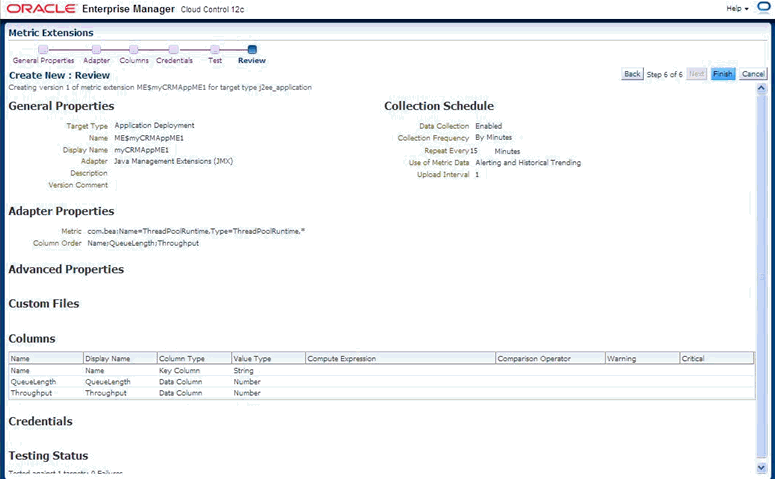
Before deploying the metric extension to selected target instances the metric extension needs to be saved as a "Deployable draft". This will let the metric extension designer deploy the metric extension to selected target instances and verify the metric collection but will prevent other administrators from deploying this metric extension until after it has been tested and the designer is satisfied.
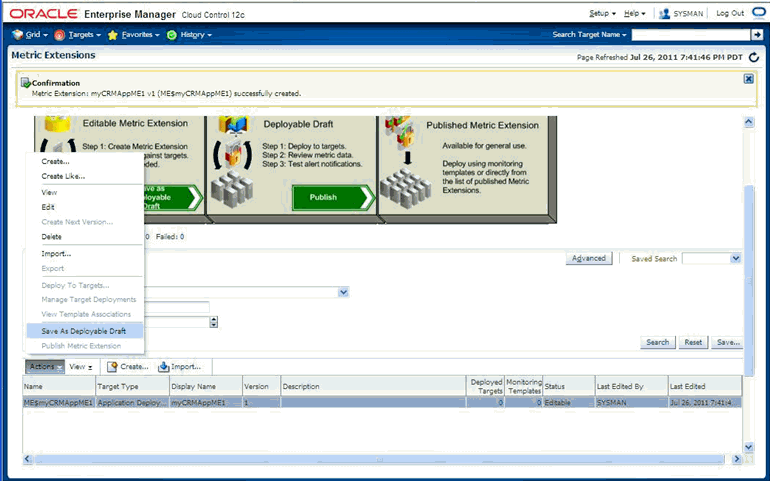
Select the metric extension just created and saved as a deployable draft. From the Actions menu, choose Deploy to Targets.
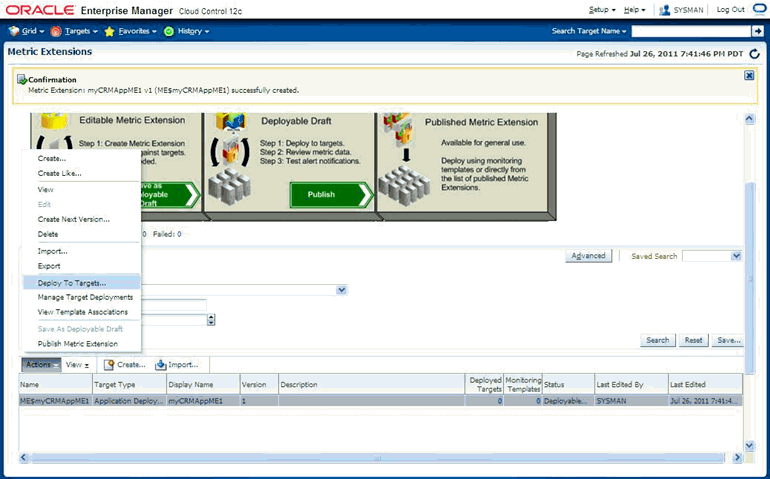
Select the target instances that this metric extension needs to be tested on and click Submit. For example, if the metric extension is defined on an "Application Deployment" target type and represents a metric from a Custom Mbean registered by a custom JEE application, the instances of that custom application could be selected. This will schedule a job to asynchronously deploy the metric extension to the Management Agents monitoring the selected targets.
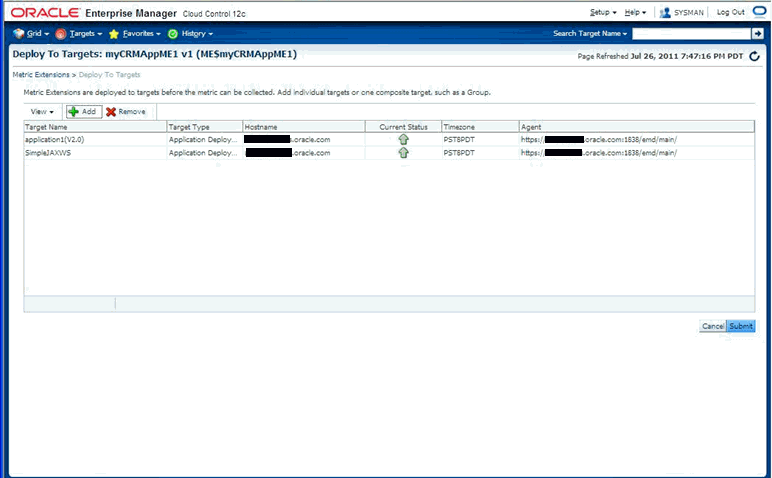
Monitor the status of the Pending deploy operation of the metric extension to selected targets by refreshing this page periodically to monitor the Status column and Failed Deploy Operations table for any possible errors during deployment.
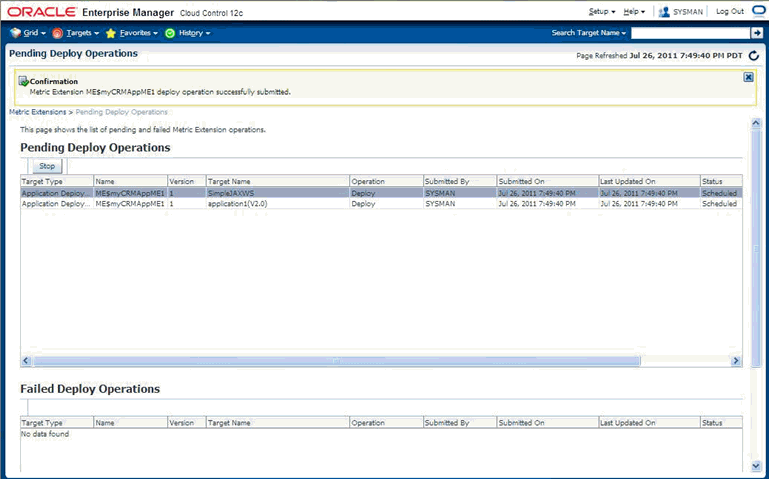
From the Enterprise menu, select Monitoring and then Metric Extension. On the Metric Extension home page, your metric extension appears as a row in the table with a column "Deployed Targets" representing the count of the number of targets this metric extension is deployed to.
From the Actions menu, choose Manage Target Deployments from the table after selecting the desired metric extension. This will list the target instances this metric extension is deployed to.
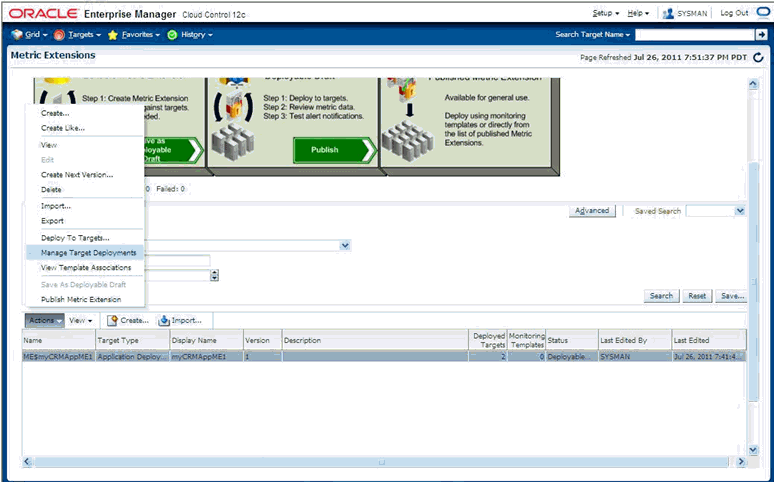
Click on the value in the "Target Name" column for the target instance you want to verify the metric extension on. This takes you to the home page of the target.
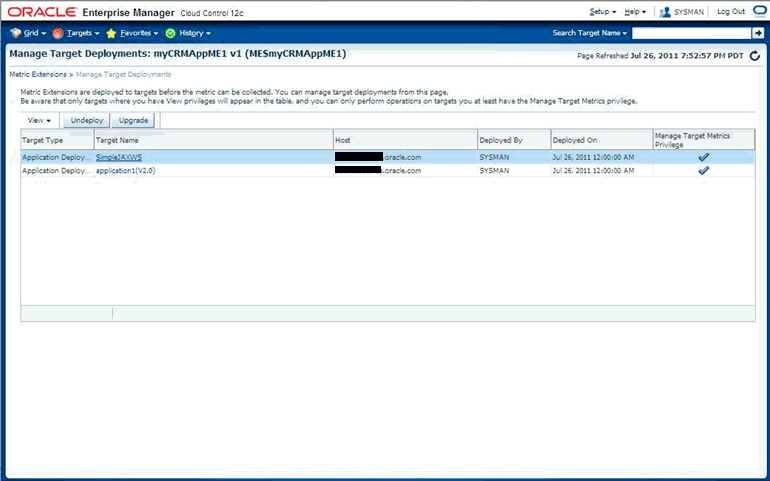
For middleware targets, navigate to the Target Type/Monitoring/ Performance Summary (or in general to the Target Type /Monitoring /All Metrics) page.
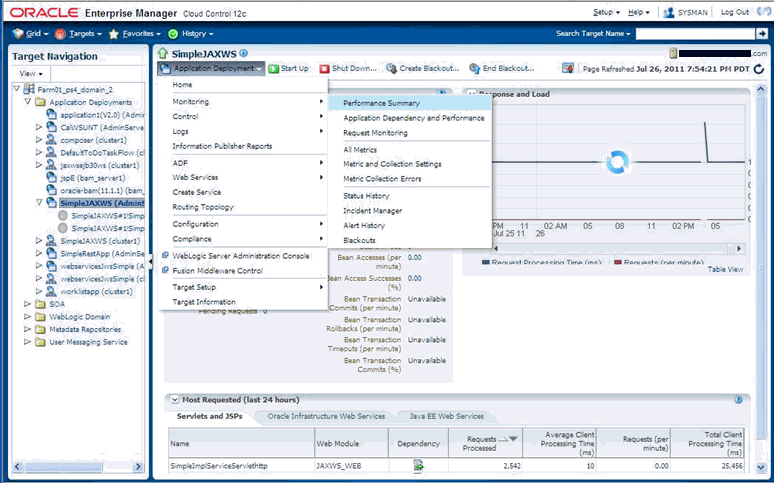
From the Performance Summary page, the newly created metric will be visible on the Metric Palette and can be selected and charted on the page.
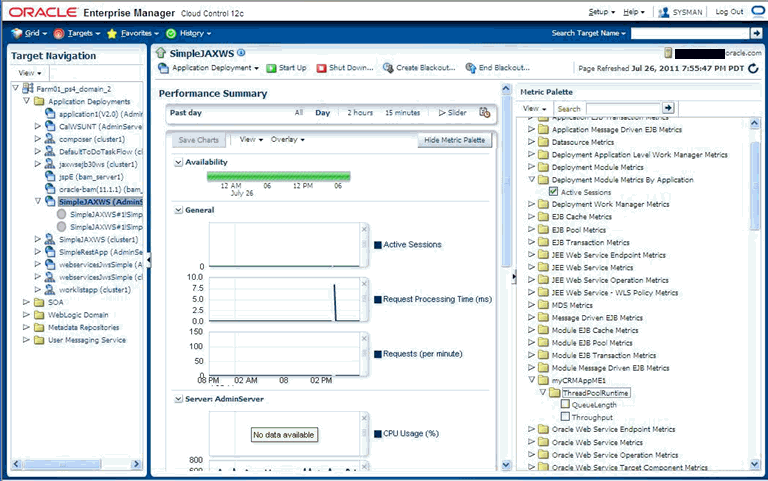
Once satisfied with testing the metric extension on one or more target instances, the metric extension can be published from the Metric Extension page (from the Actions menu, choose Publish Metric Extensions) and then deployed to remaining target instances.
If you do not wish to use the Enterprise Manager console (or do not want to surface an Enterprise Manager metric exposed via a JMX operation), you can use the command line tool JMXCLI to create a Metric Extension Archive. This can then be imported into the OMS, edited, tested, published and then deployed to required instances of the target type on which it is defined. The following illustrates the use of jmxcli in creating a Metric Extension archive.
cd Agent_Instance_Home/bin
setenv USER_JARS $T_WORK/middleware/wlserver_10.3/server/lib/weblogic.jar (this should not be necessary if your Mbeans just return JMX Open Types and not any custom classes).
emctl jmxcli -t WebLogic -MEXT -l "service:jmx:t3://sta00338:7018/jndi/weblogic.management.mbeanservers.runtime" -u weblogic -c welcome1 -m "*:Type=ThreadPoolRuntime,*" -w /scratch/TEMP/
Options:
-l : JMX serviceURL to connect to the WebLogic server. Replace the host:port above with what is appropriate for your instance
-u : WebLogic user having access to required MBeans
-c : Password for the WebLogic user
-m : Mbean ObjectName or pattern.
-w : Temporary work directory where the Metric Extension Archive (which can later be imported into the OMS console) is created.
Oracle Enterprise Manager 12c Release 1 Cloud Control 12.1.0.0.0
Copyright (c) 1996, 2011 Oracle Corporation.  All rights reserved.
Using Plugin Root /ade/sparmesw_egc802/oracle/emagent/gcagent/plugins/oracle.sysman.emas.agent.plugin_12.1.0.0.0
Connecting to server: service:jmx:t3://sta00338:7018/jndi/weblogic.management.mbeanservers.runtimeConnecting as user: weblogic
Obtained 1 MBeans matching pattern *:Type=ThreadPoolRuntime,*.
Enter an existing target type for this Metric Extension: [j2ee_application]
Enter the name of the Metric Extension: [myMEXT] myAppME_1
Enter the Metric Extension version: [1.0]
Enter the Metric Extension metadata file location: [./metadata/ME#24#myAppME_1.xml]
Enter the Metric Extension collection file location: [./collection/ME#24#myAppME_1.xml]
Enter a label for this Metric Extension: [myAppME_1]
Enter a description for this Metric Extension: [myAppME_1]
The available targets are:
0: This bean is used to monitor the self-tuning queue  <h3 class="TypeSafeDeprecation">Deprecation of MBeanHome and Type-Safe Interfaces</h3>
<p class="TypeSafeDeprecation">This is a type-safe interface for a WebLogic Server MBean,
which you can import into your client classes and access through <code>weblogic.management.MBeanHome</code>.
As of 9.0, the <code>MBeanHome</code> interface and all type-safe interfaces for WebLogic Server MBeans are deprecated.
Instead, client classes that interact with WebLogic Server MBeans should use standard JMX design patterns in which clients use the
<code>javax.management.MBeanServerConnection</code> interface to discover MBeans, attributes, and attribute types at runtime.
For more  information, see "Developing Manageable Applications with JMX" on <a href="http://www.oracle.com/technology/products/weblogic/index.html" shape="rect">http://www.oracle.com/technology/products/weblogic/index.html</a>.</p>
        (com.bea:Name=ThreadPoolRuntime,ServerRuntime=EMGC_ADMINSERVER,Type=ThreadPoolRuntime)
Enter the index of target/MBean you wish to monitor or press <Ctrl-C> to quit: 0
Following metric source types are available for selected target(s):
        0: JMX Attributes
        1: JMX Operations
Enter the index of your choice or press <Ctrl-C> to quit: 0
Attributes are:
        0: CompletedRequestCount         Return Value: java.lang.Long
        1: ExecuteThreadIdleCount        Return Value: java.lang.Integer
        2: ExecuteThreads        Return Value: [Lweblogic.management.runtime.ExecuteThread;
        3: ExecuteThreadTotalCount       Return Value: java.lang.Integer
        4: HealthState   Return Value: weblogic.health.HealthState
        5: HoggingThreadCount    Return Value: java.lang.Integer
        6: MinThreadsConstraintsCompleted        Return Value: java.lang.Long
        7: MinThreadsConstraintsPending  Return Value: java.lang.Integer
        8: Name  Return Value: java.lang.String
        9: Parent        Return Value: javax.management.ObjectName
        10: PendingUserRequestCount      Return Value: java.lang.Integer
        11: QueueLength  Return Value: java.lang.Integer
        12: SharedCapacityForWorkManagers        Return Value: java.lang.Integer
        13: StandbyThreadCount   Return Value: java.lang.Integer
        14: Suspended    Return Value: java.lang.Boolean
        15: Throughput   Return Value: java.lang.Double
        16: Type         Return Value: java.lang.String
Select one or more items as comma separated indices: 5,13
Number of possible columns in the resultant metric are 2.
Enter the name for this metric column at index=0 : [HoggingThreadCount]
Is this column a KEY Column <y/n>? [n]
Is this column for SUMMARY_UI <y/n>? [n]
Enter the label for column: [HoggingThreadCount]
Enter the NLSID for column: [HoggingThreadCount]
Enter the UNIT for column "HoggingThreadCount": [millisec, kb etc.. ]
Do you want to create a threshold for this column <y/n>? [n]
Enter the name for this metric column at index=1 : [StandbyThreadCount]
Is this column a KEY Column <y/n>? [n]
Is this column for SUMMARY_UI <y/n>? [n]
Enter the label for column: [StandbyThreadCount]
Enter the NLSID for column: [StandbyThreadCount]
Enter the UNIT for column "StandbyThreadCount": [millisec, kb etc.. ]
Do you want to create a threshold for this column <y/n>? [n]
Do you want periodic collection for this metric <y/n>? [n] y
Enter the collection interval in seconds: 300
Periodic collection interval is: 300 seconds.
Written the metadata xml file: ./metadata/ME#24#myAppME_1.xml.
Creating new file: ./collection/ME#24#myAppME_1.xml.
Updated the default collection file for j2ee_application at location ./collection/ME#24#myA
ppME_1.xml.
createMextArchive: Adding metadata
createMextArchive: Adding collection file
createMextArchive: Adding mea.xml file

Creating Metric Extension zip archive: ./MEA_ME$myAppME_1.zip
Please import this into Enterprise Manager Cloud Control using the console.
Exiting...
The previous session creates a ZIP file MEA_ME$myAppME_1.zip in the directory specified by the -w option when jmxcli is invoked (or in current directory if -w is not specified).
Import this into the Enterprise Manager console as shown below. From the Enterprise menu, choose Monitoring and then Metric Extensions to access the Metric Extensions home page.
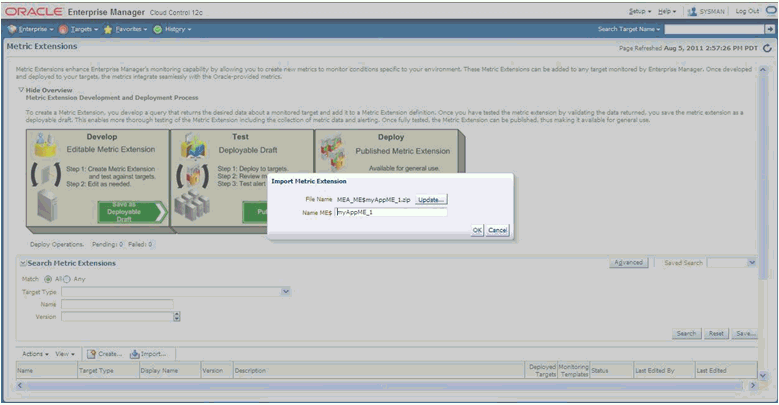
After the Management Extension Archive is imported as shown in the preceding example, it can be edited (and modified), tested, published and deployed.
Users can also use the mechanism outlined in previous section to create additional metrics that are not available out-of- box for Oracle Coherence or JVM targets and the data for which are available via JMX Mbean attributes.
The procedure is similar to the ones followed in previous section for extending metrics on j2ee_application target types except that you must select target type "JVM" or "Oracle Coherence xxx" in Step 3 for defining the Metric Extension on JVM or Oracle Coherence target types.
The steps are similar to those for using JMXCLI to define a Metric Extension Archive for custom J2EE applications except that the start-up arguments when jmxcli is invoked as follows:
emctl jmxcli -t JVM -MEXT -h adc2180736 -p 6789 -m "*:*" -w /scratch/TEMP/
You must specify target type on which the Metric Extension is defined to be JVM or oracle_coherence as appropriate (instead of the default j2ee_application).
|
Copyright © 2011, 2012, Oracle and/or its affiliates. All rights reserved. Legal Notices |
|