12 Working with the Cache Synchronization Metrics Page
This chapter describes the Cache Synchronization Metrics page.
Topics include:
Viewing the cache synchronization metrics page
The cache synchronization metrics shows cache specific performance information. In order to view the metrics, ensure that you have configured a cache environment for your TimesTen target and ensure that the cache agent is up. For more information on configuring a cache environment, see the Oracle TimesTen Application-Tier Database Cache User's Guide.
To view the cache synchronization metrics, ensure that you are on the TimesTen target page. For information on navigating to the TimesTen target page, see "Navigating to the TimesTen target page".
From the TimesTen Database Home menu, select Monitoring, then select Cache Synchronization Metrics.
Analyzing the cache synchronization metrics page
Figure 12-1 shows two cache synchronization metrics tabs that have been customized for TimesTen cache environments. Click a specific tab to view detailed cache synchronization metrics information.
Note:
Only one of these tabs is available at a time: Cache Parallel AWT or Cache AWT. If you have set cache AWT parallelism, Enterprise Manager displays the Cache parallel AWT tab. If you have not set cache AWT parallelism, Enterprise Manager displays the Cache AWT tab. For more information on cache AWT parallelism, see "Configuring parallel propagation to Oracle Database tables" in the Oracle TimesTen Application-Tier Database Cache User's Guide.Figure 12-1 Cache Synchronization Metrics tabs

Description of "Figure 12-1 Cache Synchronization Metrics tabs"
A description of each area follows:
Cache AWT
Note:
The Cache AWT tab is only available if you have not set cache AWT parallelism. For more information on cache AWT parallelism, see "Configuring parallel propagation to Oracle Database tables" in the Oracle TimesTen Application-Tier Database Cache User's Guide.The cache AWT tab enables you to view performance information of AWT cache groups. It is divided into five regions:
Cache AWT
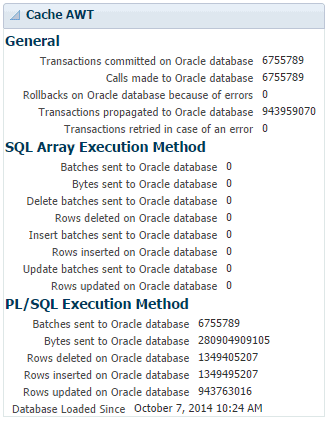
The cache AWT region shows the number of transactions committed on the Oracle database and the number of transactions rolled back on the Oracle database. The number of batches sent, bytes sent, rows deleted, rows inserted, and rows updated on the Oracle database for the SQL array execution method and the PL/SQL execution method of AWT cache are also displayed. The performance data is derived from values in the SYS.SYSTEMSTATS system table. For more information, see "SYS.SYSTEMSTATS" in the Oracle TimesTen In-Memory Database System Tables and Views Reference.
The method determines whether TimesTen uses the PL/SQL execution method or the SQL array execution method to apply changes to the Oracle database server for asynchronous writethrough propagation.
For more information about AWT cache methods, see "TimesTen Cache first connection attributes" in the Oracle TimesTen In-Memory Database Reference.
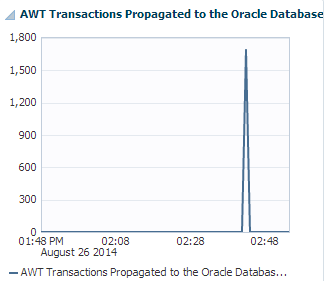
AWT transactions propagated to the Oracle database
Figure 12-3 AWT Transactions Propagated to the Oracle Database region
Description of "Figure 12-3 AWT Transactions Propagated to the Oracle Database region"
The AWT transactions propagated to the Oracle database region uses a line graph to show the number of AWT transactions propagated to the Oracle database per second.
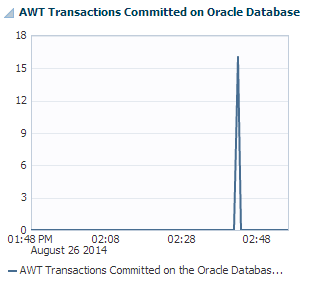
AWT transactions committed on Oracle database
Figure 12-4 AWT Transactions Committed on Oracle Database region
Description of "Figure 12-4 AWT Transactions Committed on Oracle Database region"
The AWT transactions committed on Oracle database region uses a line graph to show the number of AWT transactions committed on the Oracle database per second.
AWT batch performance
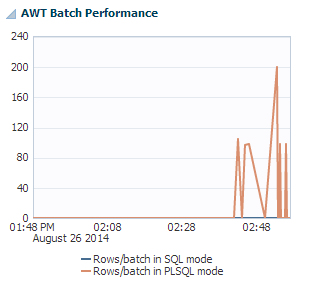
The AWT batch performance region uses a line graph to show AWT Batch performance represented as a rate of rows per batch. SQL array execution mode is set with CacheAWTMethod=0 and PL/SQL execution mode is set with CacheAWTMethod=1. For more information on CacheAWTMethod, see "CacheAWTMethod" in the Oracle TimesTen In-Memory Database Reference.
AWT volume (MB/sec)
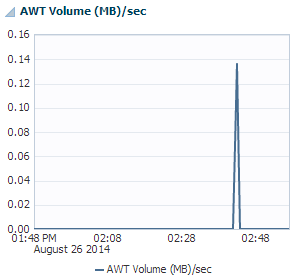
The AWT volume (MB/sec) region uses a line graph to show the AWT volume in Megabytes per second.
Cache parallel AWT
Note:
The Cache parallel AWT tab is only available if you have set cache AWT parallelism. For more information on cache AWT parallelism, see "Configuring parallel propagation to Oracle Database tables" in the Oracle TimesTen Application-Tier Database Cache User's Guide.The cache parallel AWT tab displays track and performance information about AWT cache groups that are configured with parallel propagation. For more information on parallel propagation for AWT cache groups, see "Configuring parallel propagation to Oracle Database tables" in the Oracle TimesTen Application-Tier Database Cache User's Guide. The cache parallel AWT tab is divided into two sub-tabs:
Performance
The performance sub-tab provides performance information about AWT cache groups that are configured with parallel propagation. The performance sub-tab is divided into four regions:
AWT lag
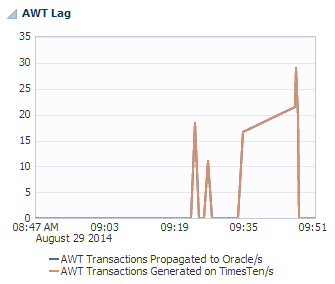
The AWT lag region uses a line graph to show the number of AWT transactions propagated to the Oracle database and generated on the TimesTen database per second.
It is important that the number of AWT transactions propagated to the Oracle database match the number of AWT transactions generated on the TimesTen database. For more information on troubleshooting AWT performance, see "AWT performance monitoring" in the Oracle TimesTen In-Memory Database Troubleshooting Guide.
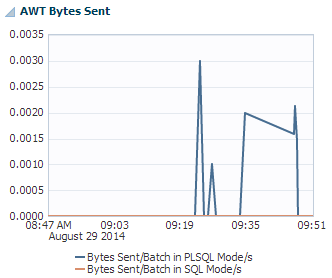
AWT bytes sent
The AWT bytes sent region uses a line graph to show the bytes sent per batch in SQL mode and PLSQL mode per second. SQL array execution mode is set with CacheAWTMethod=0 and PL/SQL execution mode is set with CacheAWTMethod=1. For more information on CacheAWTMethod, see "CacheAWTMethod" in the Oracle TimesTen In-Memory Database Reference.
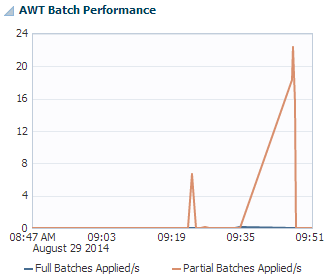
AWT batch performance
The AWT batch performance region uses a line graph to show the number of full and partial batches applied per second.
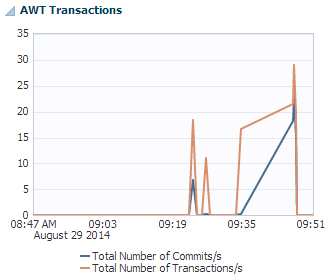
AWT transactions
The AWT transactions region uses a line graph to show the number of commits and transactions per second.
Tracks
The tracks sub-tab provides performance information about parallel AWT tracks. The tracks sub-tab is divided into two regions:
Parallel AWT tracks
The Parallel AWT tracks region shows the performance of the various parallel AWT tracks. Parallel AWT tracks are set with the CacheAWTParallelism connection attribute. For more information on the CacheAWTParallelism connection attribute, see "CacheAWTParallelism" in the Oracle TimesTen In-Memory Database Reference.
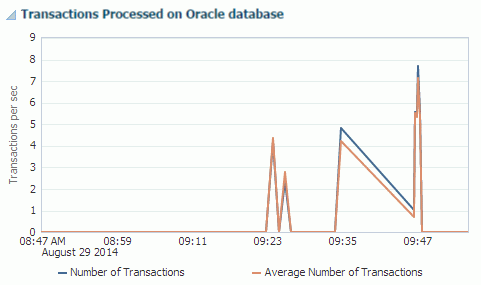
Click a peer name to review the number of transactions processed on the Oracle database for the parallel AWT track. The number of transactions processed on the Oracle database for the parallel AWT track display in the transactions processed on Oracle database region. For more information on the transactions processed on Oracle database region, see "Transactions processed on Oracle database".
Transactions processed on Oracle database
Figure 12-12 Transactions Processed on Oracle database region
Description of "Figure 12-12 Transactions Processed on Oracle database region"
The transactions processed on Oracle database region uses a line graph to show the number of transactions processed on the Oracle database for the parallel AWT track.
Cache autorefresh
The cache autorefresh tab enables you to view performance information of read-only cache groups. This tab is divided into three regions:
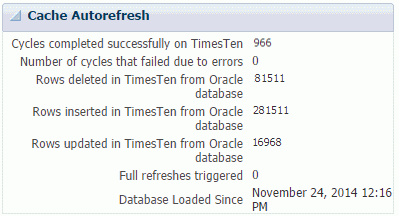
Cache autorefresh
The cache autorefresh region shows the number of rows deleted, inserted, and updated in TimesTen from the Oracle database. The number of cycles that completed successfully and the number of cycles that failed on TimesTen are also displayed. TimesTen starts collecting these metrics when the TimesTen database is loaded into memory.
Readonly cache
The readonly cache region displays information about the last autorefresh operations of each of the read-only cache groups of your TimesTen database. For more information on read-only cache groups, see "Read-only cache group" in the Oracle TimesTen Application-Tier Database Cache User's Guide.
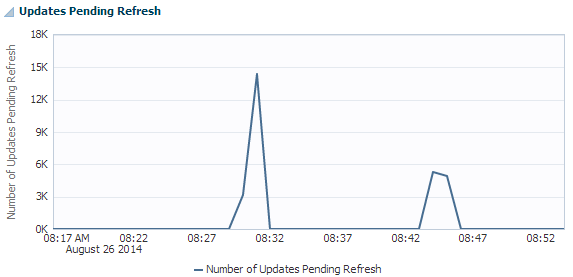
Click a cache group ID to review the number of updates pending refresh. The number of updates pending refresh display in the updates pending refresh region. For more information on the updates pending refresh region, see "Updates pending refresh".
Updates pending refresh
Figure 12-15 Updates Pending Refresh region
Description of "Figure 12-15 Updates Pending Refresh region"
The updates pending refresh region shows a line graph with the number of updates pending refresh for your specified cache group in the last hour.
