| Oracle® Fusion Middleware Oracle Reports Tutorial 11g Release 1 (11.1.1) Part Number B32123-01 |
|
|
PDF · Mobi · ePub |
| Oracle® Fusion Middleware Oracle Reports Tutorial 11g Release 1 (11.1.1) Part Number B32123-01 |
|
|
PDF · Mobi · ePub |
Estimated completion time: 5 minutes
In Chapter 6, "Creating a Graph for the Web Report", you added a graph to a JSP-based Web report. This chapter reviews the source code added for the graph.
Open the Web Source view for the report you created in Chapter 6, "Creating a Graph for the Web Report" called emprevb_your initials.jsp.
The rw:graph tag brackets the graph information and links the graph to the data source. It also identifies the categories and the data fields.
In the Web Source view, locate the <rw:graph> JSP tag.
The code within the rw:graph tag is XML.
<rw:graph id="graph" src="G_EMPLOYEE_ID" series="EMPLOYEE_ID" dataValues="SALARY">
The series tag defines the source for the values along the X-axis, and the dataValues tag defines the source for the data along the Y-axis. You defined these parameters in Chapter 6, "Creating a Graph for the Web Report".
Locate the SeriesItems tag below the rw:graph tag:
<SeriesItems>
<Series id="0" color="#cc66cc"/>
</SeriesItems>
This tag represents the modification to the Row 1 color we made in Chapter 6, "Creating a Graph for the Web Report". If you chose a different color, you will see a different value for the color tag.
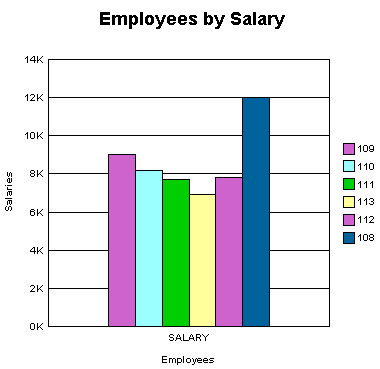
Here, you can see that the #cc66cc color value is applied to the first bar along the X-axis:
Figure 7-1 Graph with Color on the First Row

Find the <Title> tag, located here:
</SeriesItems>
<Title visible="true" text="Employees by Salary"/>
This tag adds the graph title to your Web report, shown here:
Find the </rw:graph> JSP tag, located here:
</Graph>

-->
</rw:graph></p>
  <p></p>
...
The XML that produces the graph is closed before the </rw:graph> JSP tag is closed.
Note:
The Graph Wizard is re-entrant. So, if you want to modify your graph, move your cursor into the XML between therw:graph tags, click Edit >Settings. The Graph Wizard displays with the options you chose in Chapter 6, "Creating a Graph for the Web Report".