| Oracle® Fusion Middleware Administrator's Guide for Oracle SOA Suite and Oracle Business Process Management Suite 11g Release 1 (11.1.1) Part Number E10226-04 |
|
|
View PDF |
| Oracle® Fusion Middleware Administrator's Guide for Oracle SOA Suite and Oracle Business Process Management Suite 11g Release 1 (11.1.1) Part Number E10226-04 |
|
|
View PDF |
This chapter discusses how to perform rule execution tracing by using Oracle Enterprise Manager Fusion Middleware Control Console.
This chapter covers the following sections:
Section 20.1, "The Oracle Enterprise Manager Fusion Middleware Control Console"
Section 20.3, "Rule Execution Tracing Using Fusion Middleware Control Console"
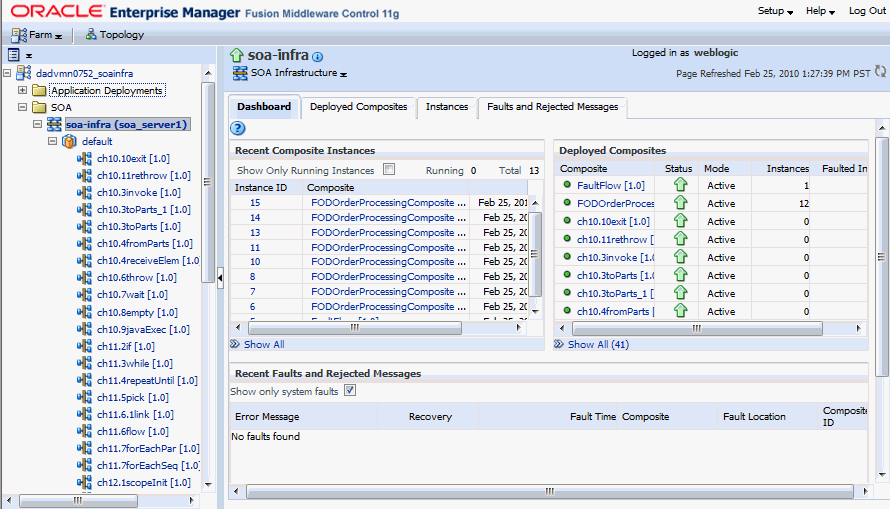
Oracle Enterprise Manager Fusion Middleware Control Console enables you to view the deployed SOA composite applications along with their details. Once you log in to the Fusion Middleware Control Console, you can see the Oracle Fusion Middleware Farm along with the components of the Farm.
When you open the SOA Infra, which contains the SOA Server metrics and the Service Engines, you can view a list of the deployed SOA composites, composite instances as well as any fault that is reported at the time of running a composite instance.
Figure 20-1 displays Oracle Enterprise Manager Fusion Middleware Control Console.
Figure 20-1 Oracle Enterprise Manager Fusion Middleware Control Console
You can click the composite names to view the related instance details, component metrics, and services as shown in Figure 20-2.
You can perform a rule execution trace by using Oracle Enterprise Manager Fusion Middleware Control Console.
A decision trace is a mechanism of tracing rule engine events that occur during the evaluation of rules. The types of events traced are:
Fact operations (assert, retract, and modify)
Rules execution
Rule activation
Ruleset stack changes
Rule compilation
Reset (required for maintaining state during analysis)
Each trace contains information about the event that it traces. For example, a rule trace entry for an executed rule consists of:
Rule name (RL name)
Execution sequence number
List of fact IDs for the facts that matched this rule
Timestamp in milliseconds
Decision trace levels are similar to the audit levels supported in SOA Suite:
Off: Decision tracing is disabled. The decision component instance is not created at all.
Development: Full decision tracing that contains all the details about facts (listing, operations such as Modify and Assert), rule activation, pop or push rulesets, and so on. It also provides a list of fact IDs on which the executed rules are matched.
Production: The executed rules are traced. All the details about facts, rule activation, pop or push ruleset are not available. The trace do not contain a list of the matching facts IDs.
You can set trace levels either at the SOA Infra level or at the composite level.
Figure 20-3 displays the options to set different trace levels at the SOA Infra level by using Fusion Middleware Control Console.
Figure 20-5, "Setting the Decision Trace Level at the Composite Level" displays how to set the composite trace level.
You can use Oracle Enterprise Manager Fusion Middleware Control Console to launch rule execution tracing.
Setting the decision trace level as Development enables you to view all the details pertaining to a rule that has been executed.
To perform a Development-level rule execution trace:
Open the composite application in Fusion Middleware Control Console, as shown in Figure 20-4. The composite under consideration is FOD Order Processing.
You will find a list of the recent composite instances that have been run under the composite Dashboard tab.
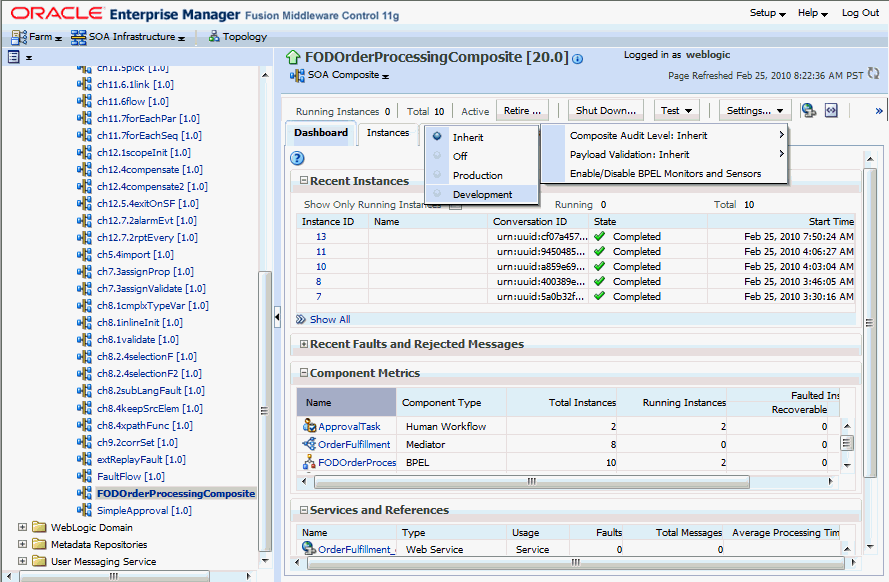
Click the Settings list, select Composite Audit Level, and then Development as shown in Figure 20-5 to set the trace level as Development at the composite level.
Figure 20-5 Setting the Decision Trace Level at the Composite Level
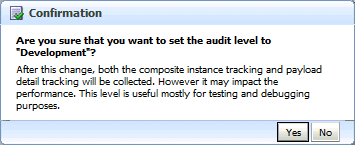
Click Yes in the Confirmation dialog box.
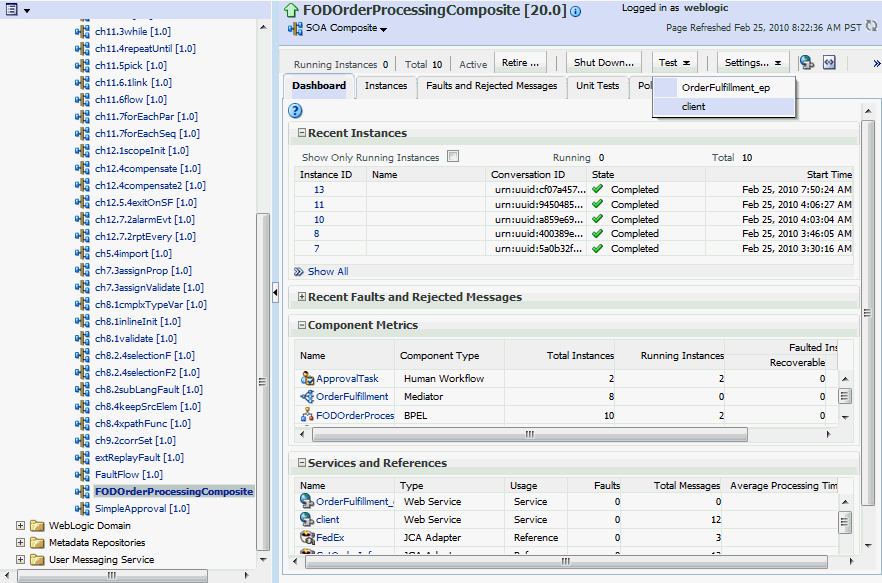
Click Test and then client to invoke a test instance of the composite as shown in Figure 20-6 to view the decision traces corresponding to different input parameters, such as the OrderID.
Figure 20-6 Invoking a Test Instance of the Composite
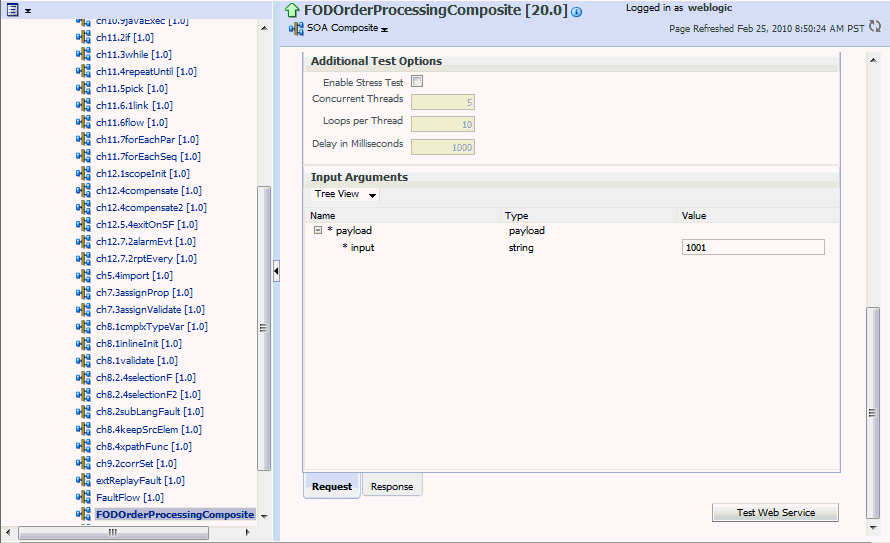
Enter an OrderID, for example 1001, in the Value field in the Input Arguments section on the Test Web Service page and click the Test Web Service button as shown in Figure 20-7.
Based on the input OrderID, the service invokes a BPEL process instance containing the details of the OrderID, and the rule that is relevant to the order details is executed.
Figure 20-7 Entering Input Parameter Value
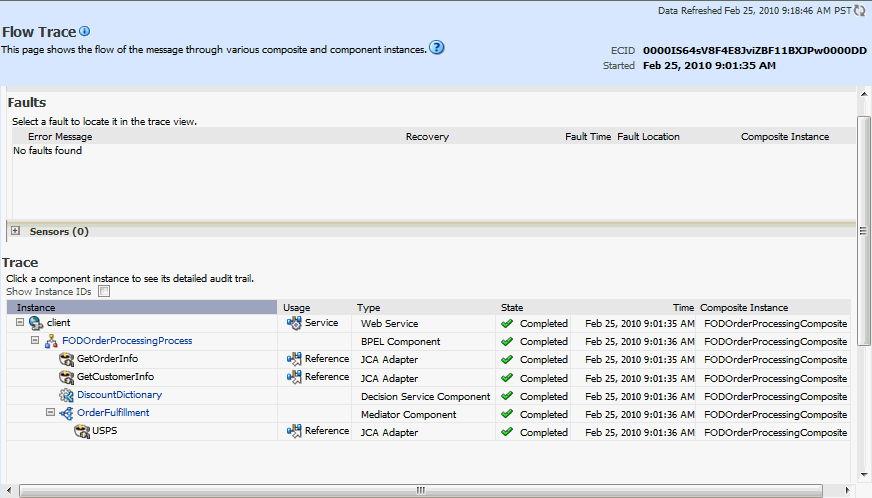
Click Launch Message Flow Trace under the Response tab to open the Flow Trace window as shown in Figure 20-8.
Click the Decision Service Component instance called DiscountDictionary in the Trace section as shown in Figure 20-9 to view the actual rule execution trace.
Figure 20-9 Opening the Instance Detail Window for the Decision Service Component
Note:
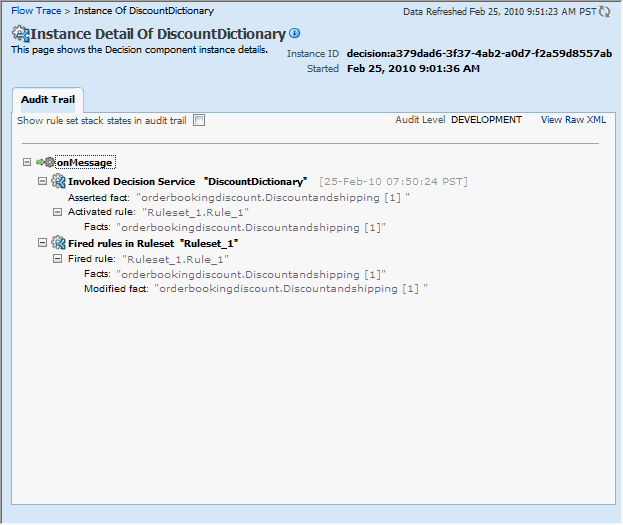
You can also view the values of composite variables before and after invocation of business rule component. You need to click the BPEL process component instance in the Flow Trace window, and then click the relevant "payload". In this case, the BPEL component name is FODOrderProcessingProcess.Figure 20-10 displays execution trace for the Decision Service Component called DiscountDictionary.
Figure 20-10 Viewing the Rule Execution Trace
Click the Show rule set stack states in audit trail checkbox to view further details of the rule execution as shown in Figure 20-11.
Figure 20-11 Viewing Detailed Rule Execution Trace
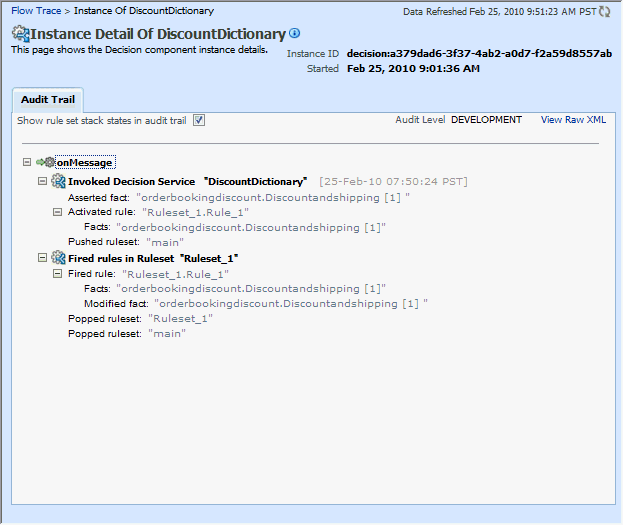
In Figure 20-11, you can see that the Development-level trace report displays the fact name, activated rule, as well as the pushed and popped ruleset names.
The following table lists the entries of the trace report:
Note:
The entry "Invoked Decision Service Name" will appear differently in different scenarios:For AS10.1.3.x to AS11 upgraded rules dictionaries with AssertExecuteWatch patterns, the entry appears in the trace report as "Invoked Decision Service."
For AS10.1.3.x to AS11 upgraded rules dictionaries with CallFunction patterns, the entry appears in the trace report as "Invoked Decision Function."
For AS11 created dictionaries, the entry is displayed as "Invoked Decision Function."
Setting the decision trace level as Production provides a truncated report on the rule execution trace. It only displays the ruleset and the rules that have been fired and does not display details about facts, rule activation, and so on.
The process of Production-level tracing is similar to the Development-level tracing. However, for Production-level tracing, you need to do the following:
In Fusion Middleware Control Console, after opening the composite, select Production from the Composite Audit Level from the Settings menu as shown in Figure 20-12.
Figure 20-12 Setting the Decision Trace Level as Production
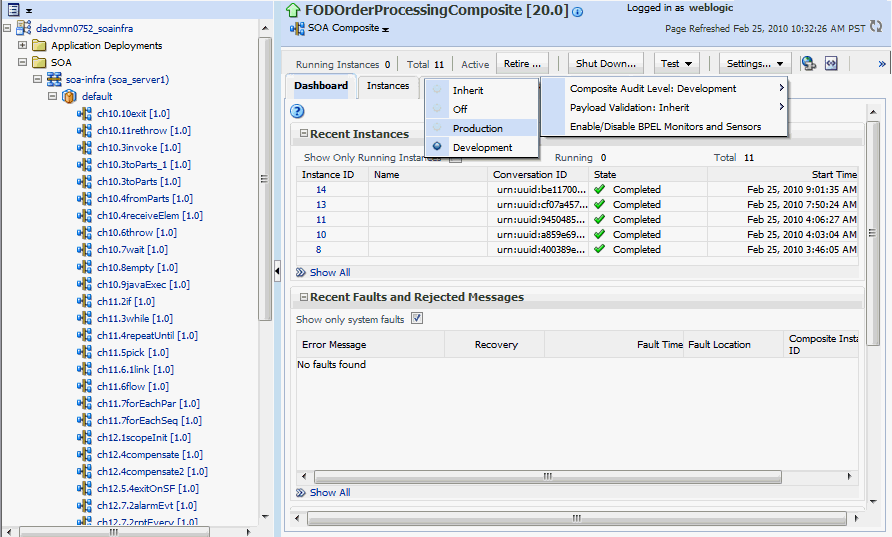
You can also set this trace level at the SOA Infra level.
Figure 20-13 displays the Flow Trace window that displays the trace report.
Figure 20-13 Viewing Production Level Rule Execution Trace
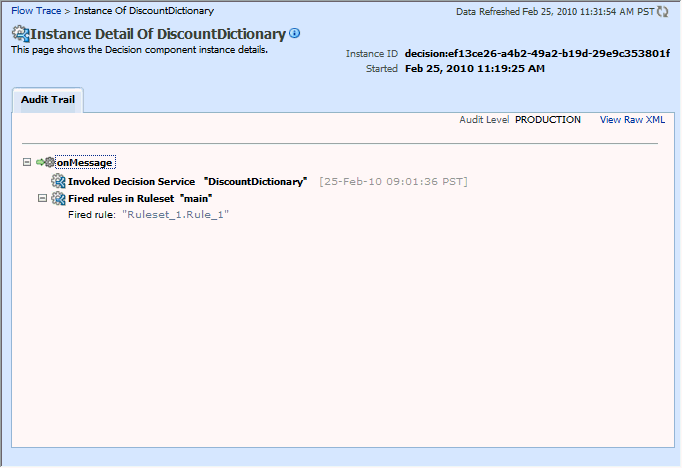
In Figure 20-13, you can see that the Production-level trace report contains only the name of the ruleset and the rules that have been fired. In addition, the Show rule set stack states in audit trail checkbox that provides a drill-down detailed trace report is unavailable in the Production-level trace report.