Release 11g (11.1.1)
Part Number E13880-01
Contents
Previous
Next
| Oracle Fusion Middleware Administrator's and Developer's Guide for Oracle Business Intelligence Publisher Release 11g (11.1.1) Part Number E13880-01 | Contents | Previous | Next |
| View PDF |
This chapter covers the following topics:
System Administrators are typically responsible for supporting end users when they experience issues with the use of Oracle BI Publisher and for interacting with Oracle Support to understand the cause of issues and apply fixes.
Issues may be reported in response to end users receiving error messages, experiencing poor performance, or lack of availability.
The principal activities administrators perform to support issue resolution include:
Examination of error and diagnostic log information. For more information, see:
Examination of system and process metrics to understand availability and performance issues. For more information, see:
BI Publisher writes diagnostic log files in the Oracle Diagnostic Logging (ODL) format. Log file naming and the format of the contents of log files conforms to an Oracle standard. You can view log files by using the WLST displayLogs command, or you can download log files to your local client and view them using another tool (for example a text editor, or another file viewing utility).
Log files are created and edited using Oracle Fusion Middleware Control. By default, after install, the bipublisher-handler log is created. You can configure this log file or create a new logger.
Each log file message category is set to a specific default value between 1-32, and only messages with a level less or equal to the log level will be logged.
Five log file message categories exist as follows:
| Level | Description |
|---|---|
| IncidentError:1 | A serious problem caused by unknown reasons. You can only fix the problem by contacting Oracle support. Examples are errors from which you cannot recover or serious problems. |
| Error:1 | A problem requiring attention from the system administrator has occurred, and is not caused by a bug in the product. No performance impact. |
| Warning:1 | A potential problem that should be reviewed by the administrator. Examples are invalid parameter values or a specified file does not exist. |
| Notification:1 | A major lifecycle event such as the activation or deactivation of a primary sub-component or feature. This is the default level for NOTIFICATION. |
| NOTIFICATION:16 | A finer level of granularity for reporting normal events. |
| TRACE:1 | Trace or debug information for events that are meaningful to administrators, such as public API entry or exit points. |
| TRACE:16 | Detailed trace or debug information that can help Oracle Support diagnose problems with a particular subsystem. |
| TRACE:32 | Very detailed trace or debug information that can help Oracle Support diagnose problems with a particular subsystem. |
A log file must contain a consistent format. However, since there can be multiple formats, you can change the format used in a log file. When you change the format used in a log file, and the new format differs from the current log file's format, a new log file is created. For example, a log file containing ODL-XML, always contains XML, and will never be mixed with text.
Configure the log file format in the Edit Log File dialog (see Configuring Log Files). The format can by Text or XML.
Log file rotation can be file size based or time based. Whenever a log file exceeds the rotation criterion, the existing log file is renamed, and a new log file is created.
The file naming looks like this:
log.xml
log.xml.1 (oldest log file)
log.xml.n
Configure log files in Oracle Fusion Middleware Control.
In Oracle Fusion Middleware Control, locate the BI Publisher server. For example:
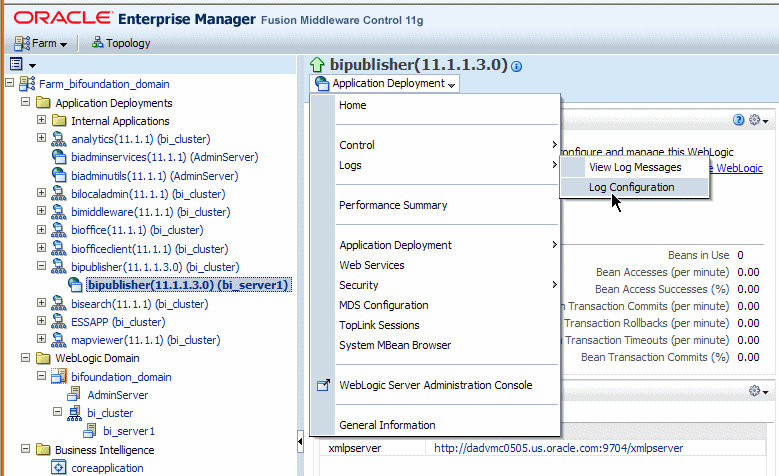
Under Application Deployments, expand bipublisher (11.1.1.3.0) (bi_cluster), and then right-click bipublisher (11.1.1.3.0)(bi_server1)
From the menu, click Logs and then Log Configuration, as shown in the following figure:
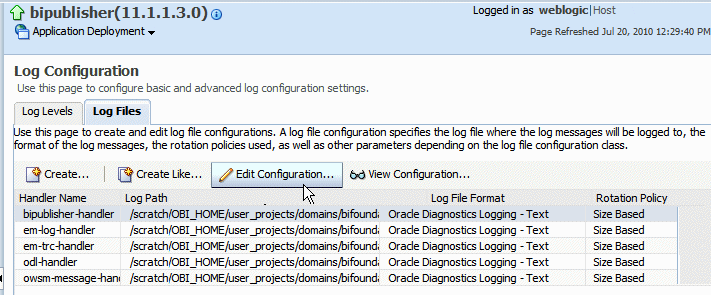
By default, the bipublisher-handler log is created. Select bipublisher-handler in the table and click Edit Configuration.
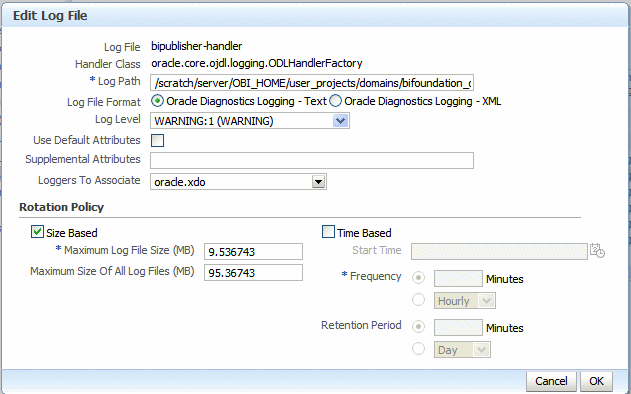
In the Edit Configuration dialog, set the Log Level and configure other options.
You can view log messages using Oracle Fusion Middleware Control or you can view the log files directly.
To view log messages in Oracle Fusion Middleware Control:
In Oracle Fusion Middleware Control, locate the BI Publisher server. For example:
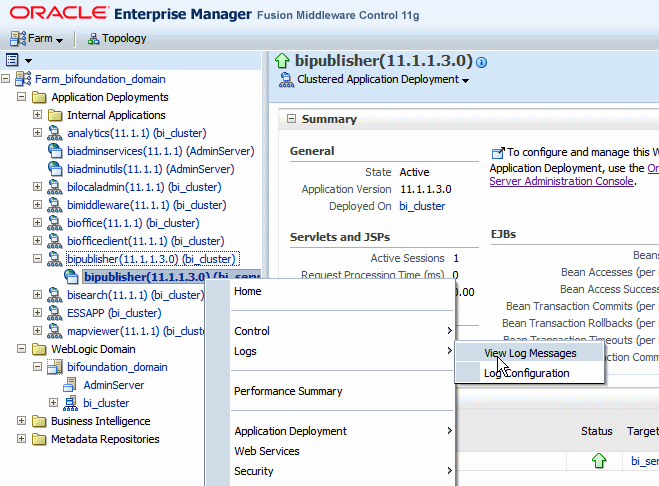
Under Application Deployments, expand bipublisher (11.1.1.3.0) (bi_cluster), and then right-click bipublisher (11.1.1.3.0)(bi_server1)
From the menu, click Logs and then View Log Messages, as shown in the following figure:
To view a specific log file, click Target Log Files.
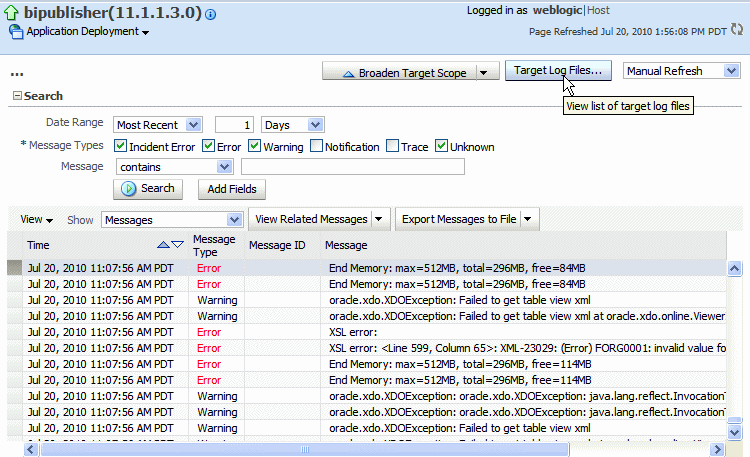
From the Log Files page, select a specific log to view messages or download the log file.
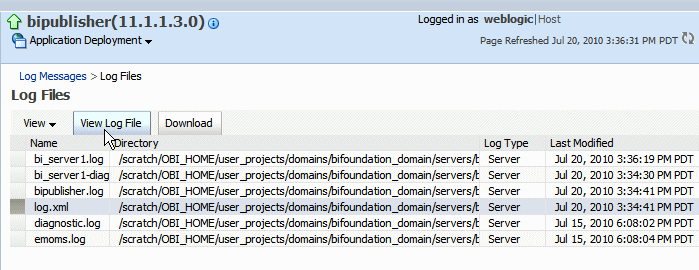
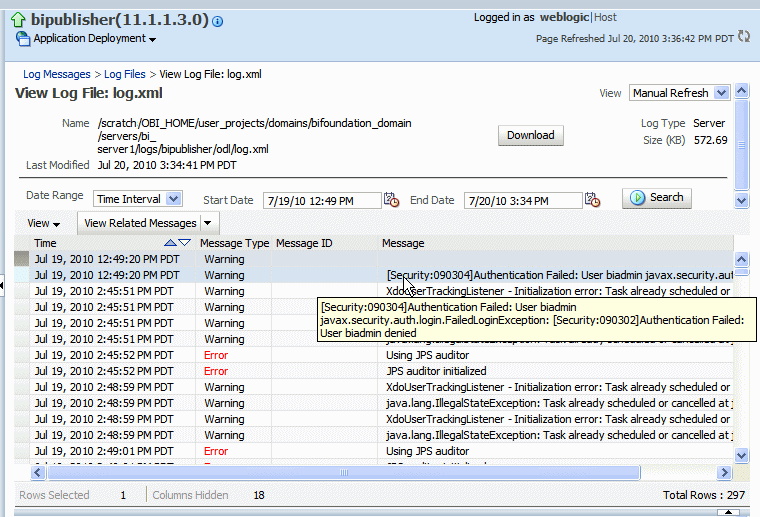
Click View Log File to view the messages.
The log file is located in the directory specified in the Log Path in the Edit Log File dialog. Navigate to the directory on your server to view the log file:
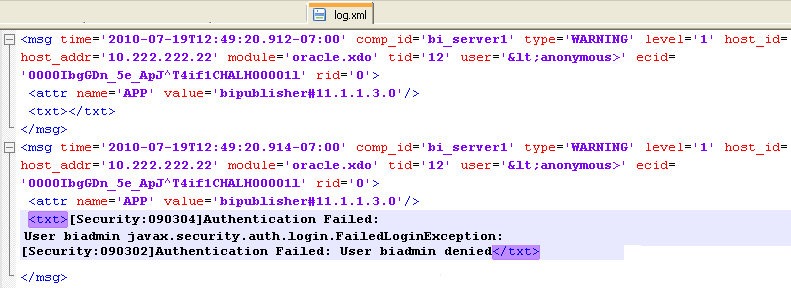
The following example shows an ODL format error message:
<msg time="2009-07-30T16:00:03.150-07:00" comp_id="xdo" type="ERROR" level="1" host_id="MyBIPHost" host_addr="120.19.168.17" module="oracle.xdo" tid="11" user="Administrator">
<txt>Variable 'G_dept' is missing...</txt>
</msg>| Attribute Name | Description |
|---|---|
| time | The date and time when the message was generated. This reflects the local time zone. |
| comp_id | The ID of the component that originated the message. |
| type | The type of message. Possible values are: INCIDENT_ERROR, ERROR, WARNING, NOTIFICATION, TRACE, and UNKNOWN. See the following table for information about the message types. |
| level | The message level, represented by an integer value that qualifies the message type. Possible values are from 1 (highest severity) through 32 (lowest severity). |
| host_id | The name of the host where the message originated. |
| host_addr | The network address of the host where the message originated. |
| module | The ID of the module that originated the message. If the component is a single module, the component ID is listed for this attribute. |
| tid | The ID of the thread that generated the message. |
| user | The name of the user whose execution context generated the message. |
Performance monitoring enables you to monitor the performance of queries, reports and document generation and to analyze the provided details.
BI Publisher collects performance statistics through JMX Management Beans or Mbeans. Each MBean reveals attributes, operations, and relevant statistics gathered by the Oracle Dynamic Monitoring Service (DMS). The following table summarizes the beans that are provided:
| Management Bean | Description |
|---|---|
| ReportEventMonitor | Creates an Mbean per report and displays detailed monitoring data for the report. |
| ServerEventMonitor | Exists per server and displays user and server activity summaries. |
| UserEventMonitor | Creates an Mbean per user and displays detailed monitoring data for the user. |
To enable monitoring perform the following:
Update properties in the BI Publisher server configuration file.
Copy the component_events.xml file to your Middleware Home.
Restart WebLogic Server, the Admin Server, and the Managed Server.
Configure the Audit Policy Settings.
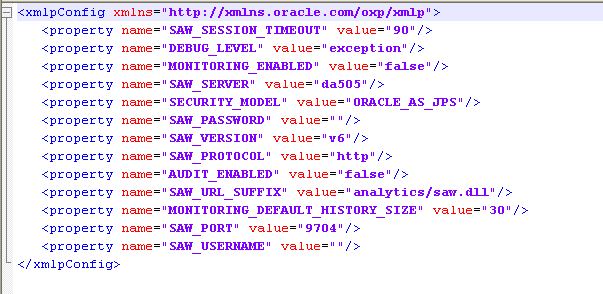
Locate the xmlp-server-config.xml file in the BI Publisher repository under config/bipublisher/repository/Admin/Configuration/xmlp-server-config.xml located under the Oracle BI Domain Home (for example:MIDDLEWARE_HOME/user_projects/domains/bifoundation_domain/config/bipublisher/repository/Admin/Configuration.
A sample configuration file is shown in the following figure:
Perform the following:
Make a backup of the file.
Add the following property to the file and set it to "true":
<property name=”AUDIT_JPS_INTEGRATION” value=”true"/>
This property enables the integration of performance monitoring and auditing with Oracle Fusion Middleware Control.
Update the properties in the following table to enable performance monitoring and auditing:
| Property | Description |
|---|---|
| MONITORING_ENABLED | Set to "true" to enable monitoring. The default is "false". |
| AUDIT_ENABLED | Set to "true" to enable auditing. The default is "false". MONITORING_ENABLED must also be set to "true" |
Following is a sample configuration file with the properties updated:
<xmlpConfig xmlns="http://xmlns.oracle.com/oxp/xmlp">
   <property name="SAW_SERVER" value=""/>
   <property name="SAW_SESSION_TIMEOUT" value="90"/>
   <property name="DEBUG_LEVEL" value="exception"/>
   <property name="SAW_PORT" value=""/>
   <property name="SAW_PASSWORD" value=""/>
   <property name="SAW_PROTOCOL" value="http"/>
   <property name="SAW_VERSION" value="v4"/>
   <property name="SAW_USERNAME" value=""/>
   <property name="MONITORING_ENABLED" value="true" />
   <property name="AUDIT_ENABLED" value="true" />
   <property name=”AUDIT_JPS_INTEGRATION” value=”true"/
</xmlpConfig>
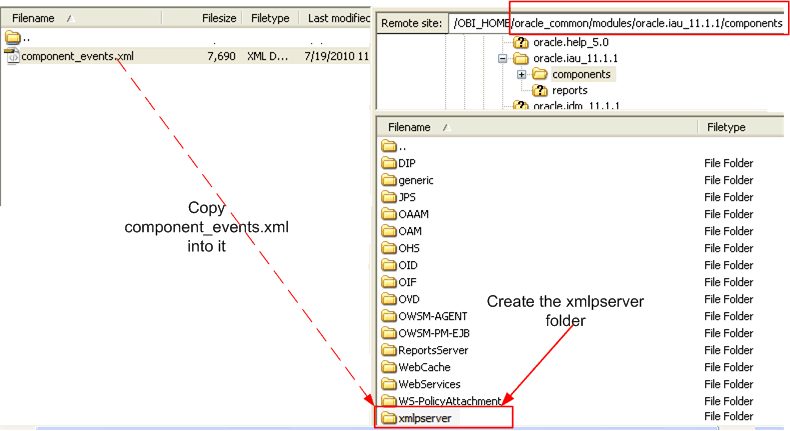
Locate the component_events.xml file in the BI Publisher repository under config/bipublisher/repository/Admin/Audit/component_events.xml located under the Oracle BI Domain Home (for example: MIDDLEWARE_HOME/user_projects/domains/bifoundation_domain/config/bipublisher/repository/Admin/Audit.
Copy the file.
Navigate to the MIDDLEWARE_HOME/oracle_common/modules/oracle.iau_11.1.1/components directory.
In the components directory create a folder named "xmlpserver"
Copy the component_events.xml file to the newly created xmlpserver folder.
Using Oracle Fusion Middleware Control, restart the WebLogic Server, the Admin Server, and the Managed Server.
To configure the audit policy settings:
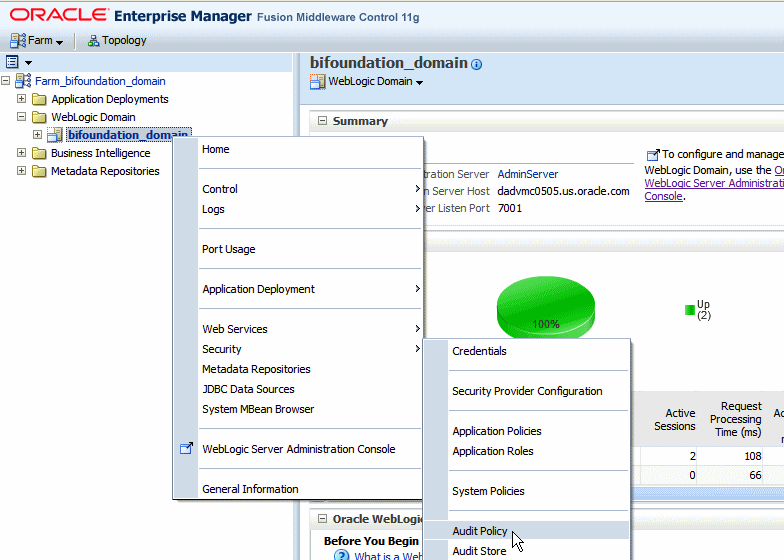
In Oracle Fusion Middleware Control, under WebLogic Domain, right-click bifoundation_domain. From the menu click Security and then click Audit Policy as shown in the following figure:
The Audit Policy table displays all the audited applications under the bifoundation_domain. Set the Audit Level to Medium to enable auditing for BI Publisher.
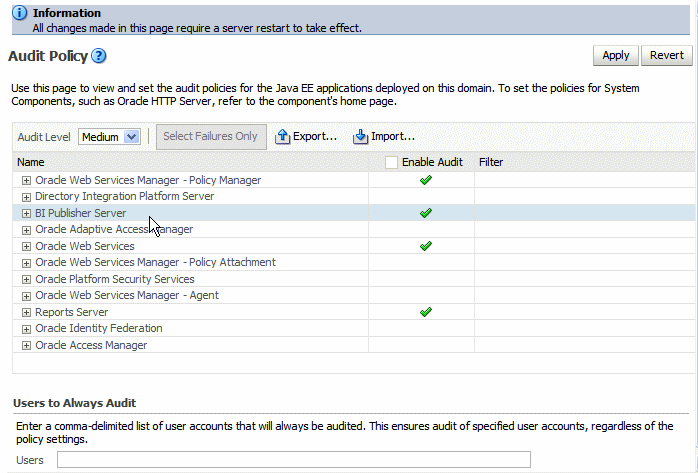
To customize the audit level, select Custom from the Audit Level list. This will enable you to selectively enable auditing for the BI Publisher events and apply filters.
The events that are audited for the BI Publisher server are:
User Logins
User Logouts
Report Request
Scheduled Request
Report Republish
Report Data Download
Report Download
Report Data Process
Report Rendering
Report Delivery
If you set the property AUDIT_JPS_INTEGRATION to true, the audit log can be viewed under the xmlpserver folder under the WebLogic Server AdminServer directory: /AdminServer/logs/auditlogs/xmlpserver/audit.log
Alternatively, if you have configured an audit repository in your database, audit data is stored in database tables instead of the log file (the file is not generated in this case). The collected data can be analyzed using reports provided by Audit Framework. For more information, see "Using Audit Analysis and Reporting" in the Oracle Fusion Middleware Security Guide 11g.
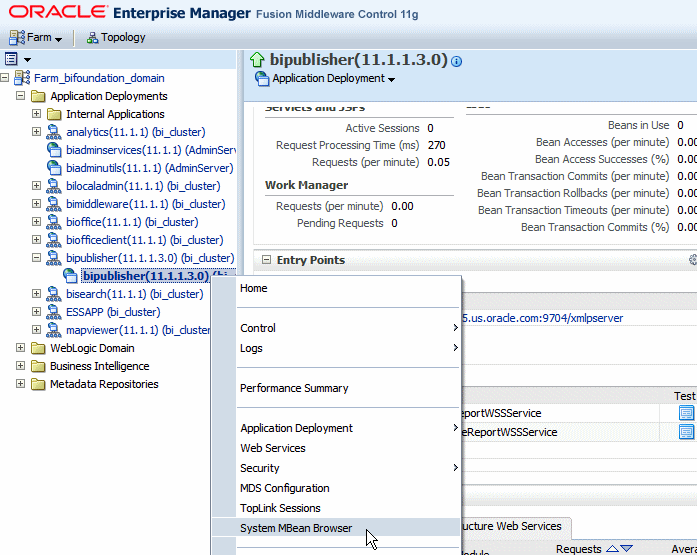
To view the performance statistics collected by the Report Event Monitor, Service Event Monitor, and User Event Monitor, navigate to the System MBean browser as follows:
In Oracle Fusion Middleware Control, locate the BI Publisher server. For example:
Under Application Deployments, expand bipublisher (11.1.1.3.0) (bi_cluster), and then right-click bipublisher (11.1.1.3.0)(bi_server1)
From the menu, click System MBean Browser, as shown in the following figure:
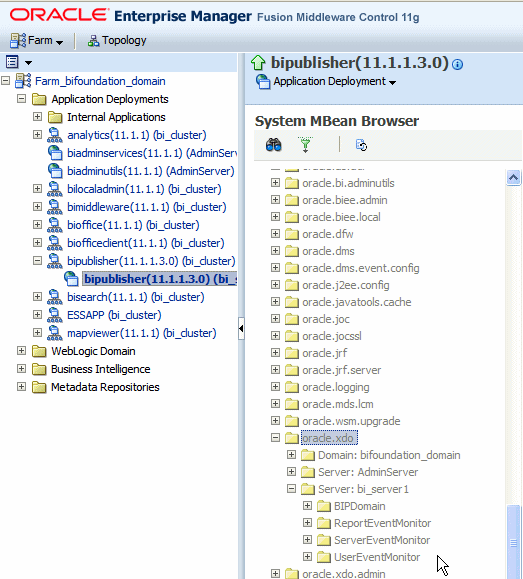
In the System MBean Browser, under the Application Defined MBeans, expand the oracle.xdo folder to view the BI Publisher MBeans. Expand the list and select the bean to view the details.
![]()
Copyright © 2004, 2010, Oracle and/or its affiliates. All rights reserved.