Release 11g (11.1.1)
Part Number E13880-02
Contents
Previous
Next
| Oracle Fusion Middleware Administrator's Guide for Oracle Business Intelligence Publisher Release 11g (11.1.1) Part Number E13880-02 | Contents | Previous | Next |
| View PDF |
This chapter covers the following topics:
System Administrators are typically responsible for supporting end users when they experience issues with the use of Oracle BI Publisher and for interacting with Oracle Support to understand the cause of issues and apply fixes.
Issues may be reported in response to end users receiving error messages, experiencing poor performance, or lack of availability.
The principal activities administrators perform to support issue resolution include:
Examination of error and diagnostic log information. For more information, see:
Examination of system and process metrics to understand availability and performance issues. For more information, see:
BI Publisher writes diagnostic log files in the Oracle Diagnostic Logging (ODL) format. Log file naming and the format of the contents of log files conforms to an Oracle standard. You can view log files by using the WLST displayLogs command, or you can download log files to your local client and view them using another tool (for example a text editor, or another file viewing utility).
Log files are created and edited using Oracle Fusion Middleware Control. By default, after install, the bipublisher-handler log is created. You can configure this log file or create a new logger.
Each log file message category is set to a specific default value between 1-32, and only messages with a level less or equal to the log level will be logged.
Five log file message categories exist as follows:
| Level | Description |
|---|---|
| IncidentError:1 | A serious problem caused by unknown reasons. You can only fix the problem by contacting Oracle support. Examples are errors from which you cannot recover or serious problems. |
| Error:1 | A problem requiring attention from the system administrator has occurred, and is not caused by a bug in the product. No performance impact. |
| Warning:1 | A potential problem that should be reviewed by the administrator. Examples are invalid parameter values or a specified file does not exist. |
| Notification:1 | A major lifecycle event such as the activation or deactivation of a primary sub-component or feature. This is the default level for NOTIFICATION. |
| NOTIFICATION:16 | A finer level of granularity for reporting normal events. |
| TRACE:1 | Trace or debug information for events that are meaningful to administrators, such as public API entry or exit points. |
| TRACE:16 | Detailed trace or debug information that can help Oracle Support diagnose problems with a particular subsystem. |
| TRACE:32 | Very detailed trace or debug information that can help Oracle Support diagnose problems with a particular subsystem. |
A log file must contain a consistent format. However, since there can be multiple formats, you can change the format used in a log file. When you change the format used in a log file, and the new format differs from the current log file's format, a new log file is created. For example, a log file containing ODL-XML, always contains XML, and will never be mixed with text.
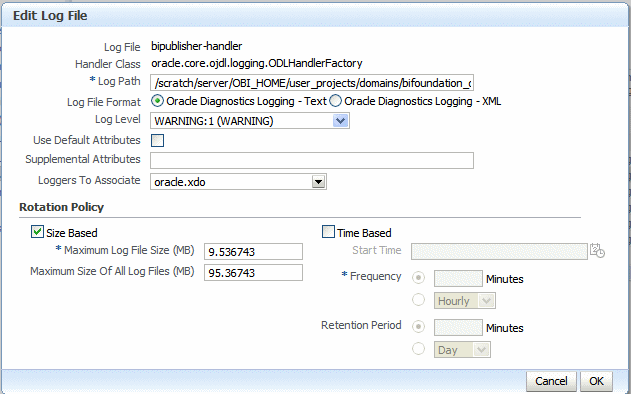
Configure the log file format in the Edit Log File dialog (see Configuring Log Files). The format can by Text or XML.
Log file rotation can be file size based or time based. Whenever a log file exceeds the rotation criterion, the existing log file is renamed, and a new log file is created.
The file naming looks like this:
log.xml
log.xml.1 (oldest log file)
log.xml.n
Configure log files in Oracle Fusion Middleware Control.
In Oracle Fusion Middleware Control, locate the BI Publisher server. For example:
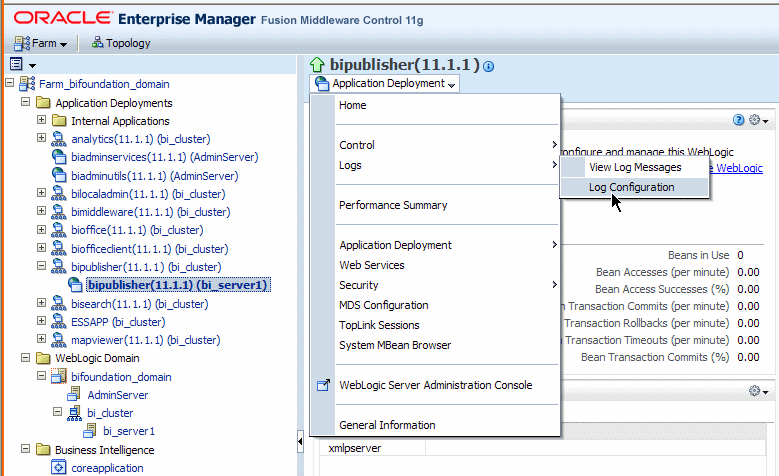
Under Application Deployments, expand bipublisher (11.1.1) (bi_cluster), and then right-click bipublisher (11.1.1)(bi_server1)
From the menu, click Logs and then Log Configuration, as shown in the following figure:
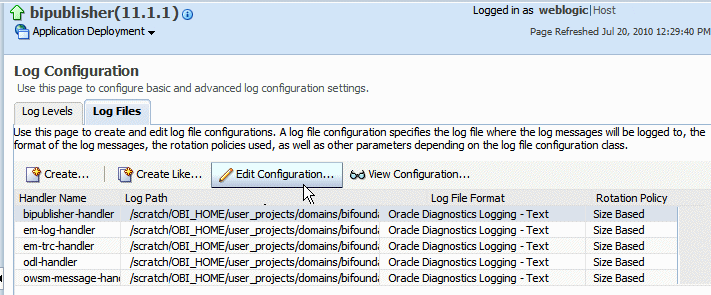
By default, the bipublisher-handler log is created. Select bipublisher-handler in the table and click Edit Configuration.
In the Edit Configuration dialog, set the Log Level and configure other options.
You can view log messages using Oracle Fusion Middleware Control or you can view the log files directly.
To view log messages in Oracle Fusion Middleware Control:
In Oracle Fusion Middleware Control, locate the BI Publisher server. For example:
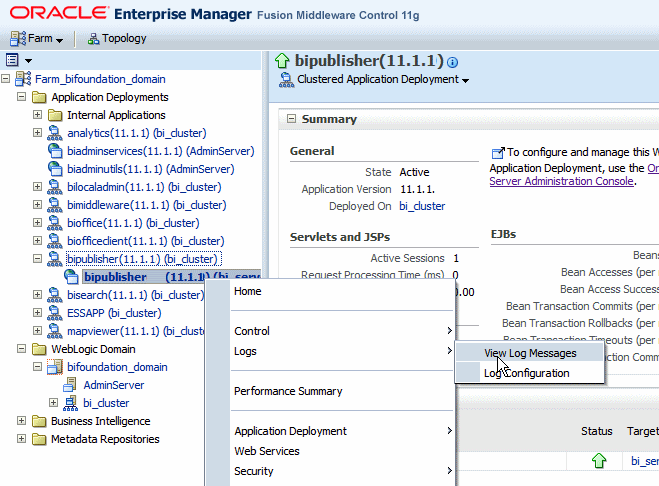
Under Application Deployments, expand bipublisher (11.1.1) (bi_cluster), and then right-click bipublisher (11.1.1)(bi_server1)
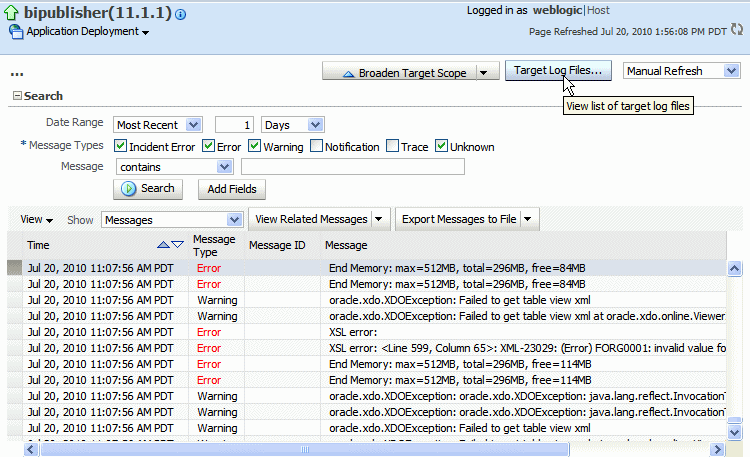
From the menu, click Logs and then View Log Messages, as shown in the following figure:
To view a specific log file, click Target Log Files.
From the Log Files page, select a specific log to view messages or download the log file.
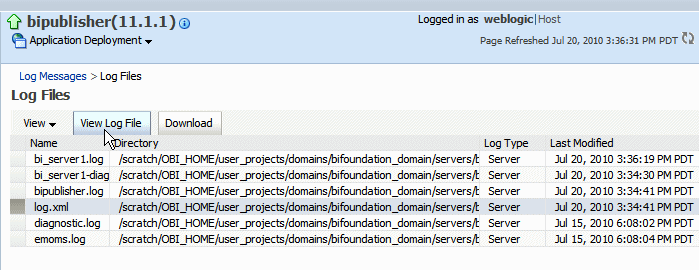
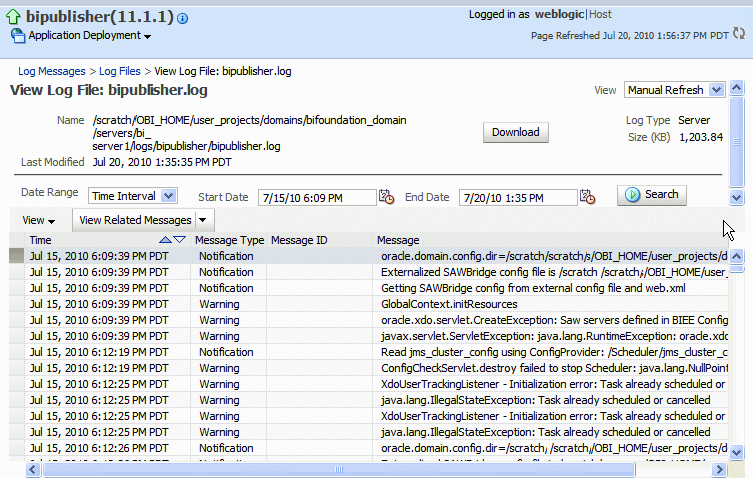
Click View Log File to view the messages.
The log file is located in the directory specified in the Log Path in the Edit Log File dialog. Navigate to the directory on your server to view the log file:
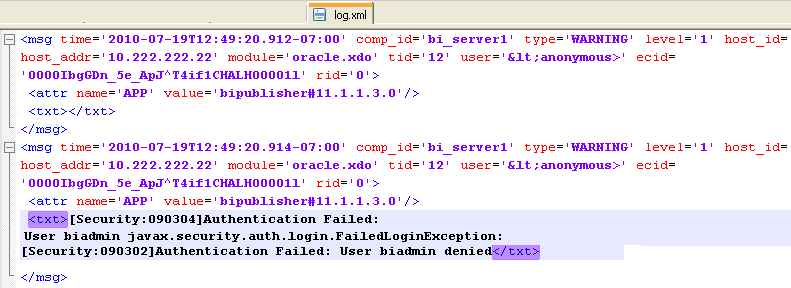
The following example shows an ODL format error message:
<msg time="2009-07-30T16:00:03.150-07:00" comp_id="xdo" type="ERROR" level="1" host_id="MyBIPHost" host_addr="120.19.168.17" module="oracle.xdo" tid="11" user="Administrator">
<txt>Variable 'G_dept' is missing...</txt>
</msg>| Attribute Name | Description |
|---|---|
| time | The date and time when the message was generated. This reflects the local time zone. |
| comp_id | The ID of the component that originated the message. |
| type | The type of message. Possible values are: INCIDENT_ERROR, ERROR, WARNING, NOTIFICATION, TRACE, and UNKNOWN. See the following table for information about the message types. |
| level | The message level, represented by an integer value that qualifies the message type. Possible values are from 1 (highest severity) through 32 (lowest severity). |
| host_id | The name of the host where the message originated. |
| host_addr | The network address of the host where the message originated. |
| module | The ID of the module that originated the message. If the component is a single module, the component ID is listed for this attribute. |
| tid | The ID of the thread that generated the message. |
| user | The name of the user whose execution context generated the message. |
Performance monitoring enables you to monitor the performance of queries, reports and document generation and to analyze the provided details. User auditing provides information about what users logged in, when, how many times, what reports they accessed, and other actions they took within the application.
BI Publisher collects performance statistics through JMX Management Beans or Mbeans. Each MBean reveals attributes, operations, and relevant statistics gathered by the Oracle Dynamic Monitoring Service (DMS). The following table summarizes the beans that are provided:
| Management Bean | Description |
|---|---|
| ReportEventMonitor | Creates an Mbean per report and displays detailed monitoring data for the report. |
| ServerEventMonitor | Exists per server and displays user and server activity summaries. |
| UserEventMonitor | Creates an Mbean per user and displays detailed monitoring data for the user. |
To enable monitoring:
Update properties in the BI Publisher server configuration file.
Copy the component_events.xml file to your Middleware Home.
Configure the Audit Policy Settings with Fusion Middleware Control (Enterprise Manager)
Restart WebLogic Server.
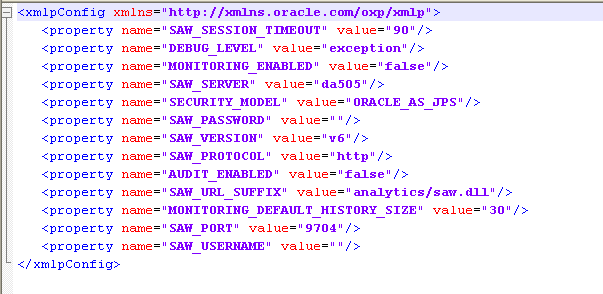
Locate the xmlp-server-config.xml file in the BI Publisher repository under config/bipublisher/repository/Admin/Configuration/xmlp-server-config.xml located under the Oracle BI Domain Home (for example:MIDDLEWARE_HOME/user_projects/domains/bifoundation_domain/config/bipublisher/repository/Admin/Configuration.
A sample configuration file is shown in the following figure:
Perform the following:
Make a backup of the file.
Add the following property to the file and set it to "true":
<property name=”AUDIT_JPS_INTEGRATION” value=”true"/>
This property enables the integration of performance monitoring and auditing with Oracle Fusion Middleware Control.
Update the properties in the following table to enable performance monitoring and auditing:
| Property | Description |
|---|---|
| MONITORING_ENABLED | Set to "true" to enable monitoring. The default is "false". |
| AUDIT_ENABLED | Set to "true" to enable auditing. The default is "false". |
Following is a sample configuration file with the properties updated:
<xmlpConfig xmlns="http://xmlns.oracle.com/oxp/xmlp">
   <property name="SAW_SERVER" value=""/>
   <property name="SAW_SESSION_TIMEOUT" value="90"/>
   <property name="DEBUG_LEVEL" value="exception"/>
   <property name="SAW_PORT" value=""/>
   <property name="SAW_PASSWORD" value=""/>
   <property name="SAW_PROTOCOL" value="http"/>
   <property name="SAW_VERSION" value="v4"/>
   <property name="SAW_USERNAME" value=""/>
   <property name="MONITORING_ENABLED" value="true"/>
   <property name="AUDIT_ENABLED" value="true"/>
   <property name=”AUDIT_JPS_INTEGRATION” value=”true"/
</xmlpConfig>
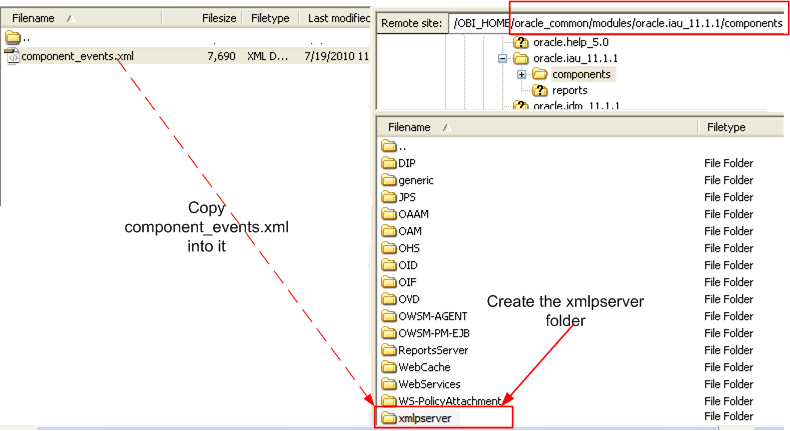
Navigate to the MIDDLEWARE_HOME/oracle_common/modules/oracle.iau_11.1.1/components directory.
In the components directory create a directory named "xmlpserver".
Locate the component_events.xml file in the BI Publisher repository under config/bipublisher/repository/Admin/Audit/component_events.xml located under the Oracle BI Domain Home (for example: MIDDLEWARE_HOME/user_projects/domains/bifoundation_domain/config/bipublisher/repository/Admin/Audit.
Copy the component_events.xml file to the newly created xmlpserver directory.
To configure the audit policy settings:
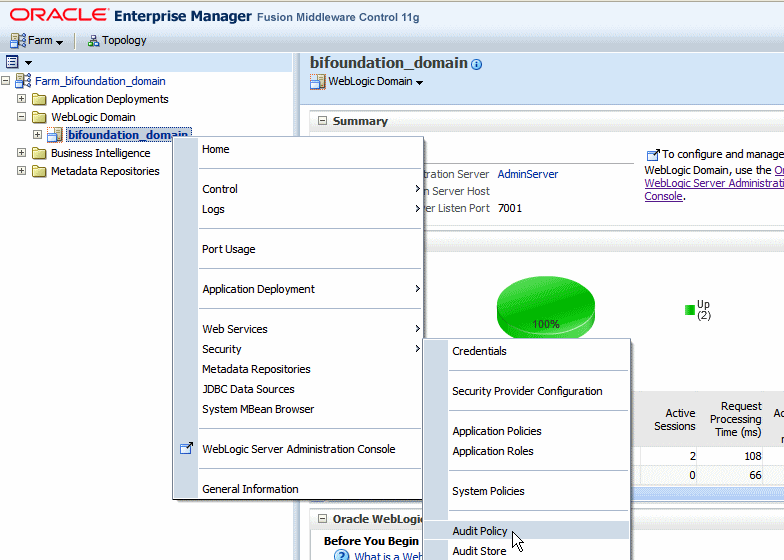
In Oracle Fusion Middleware Control, under WebLogic Domain, right-click bifoundation_domain. From the menu click Security and then click Audit Policy as shown in the following figure:
The Audit Policy table displays all the audited applications under the bifoundation_domain. Set the Audit Level to enable auditing for BI Publisher.
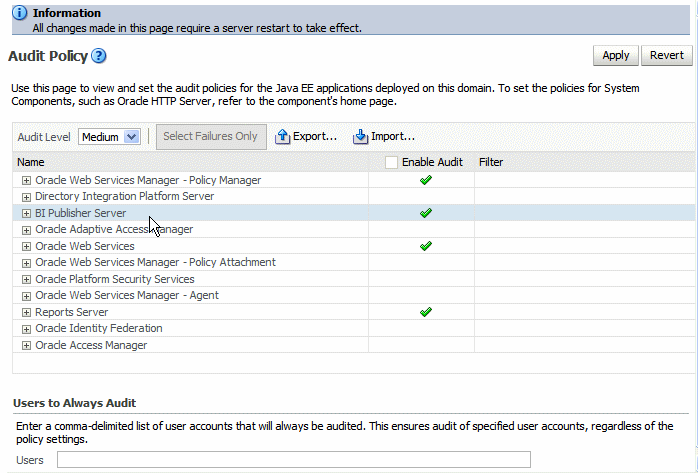
You will most likely set the Audit Level to Medium. If you wish to customize the audit level for each event, select Custom from the Audit Level list. This will enable you to set the audit level for each event and apply filters.
The events that are audited for the BI Publisher server are:
User Logins
User Logouts
Report Request
Scheduled Request
Report Republish
Report Data Download
Report Download
Report Data Process
Report Rendering
Report Delivery
Restart the WebLogic Serve instance. You can do this using Oracle Fusion Middleware Control, or if you are running Windows, you can select "Stop BI Servers" and then "Start BI Servers" from the Start menu.
If you set the property AUDIT_JPS_INTEGRATION to true, the audit log can be viewed under the xmlpserver folder under the WebLogic Server AdminServer directory: /AdminServer/logs/auditlogs/xmlpserver/audit.log
Alternatively, if you can configure an audit repository in your database to store audit data in database tables instead of the log file (the file is not generated in this case). The collected data can be analyzed using reports provided by Audit Framework, or you can create your own reports using BI Publisher.
For more information on the reports provided by Audit Framework, see "Using Audit Analysis and Reporting" in the Oracle Fusion Middleware Application Security Guide 11g.
The following section describes how to set up the audit repository in your database to store the auditing data.
Configure an audit repository to store your auditing data collected by the Fusion Middleware Auditing Framework in database tables rather than a log file.
To set up the audit database in WebLogic Server:
Create the audit schema using RCU.
Create a data source in your WebLogic server.
Register the audit database to your domain.
Go to $RCU_HOME/bin and execute the rcu command.
Choose Create at the starting screen and click Next.
Enter your database details and click Next.
Choose the option to create a new prefix, and enter a prefix; for example: BIP
Select Audit Services from the list of schemas (shown in the following figure).
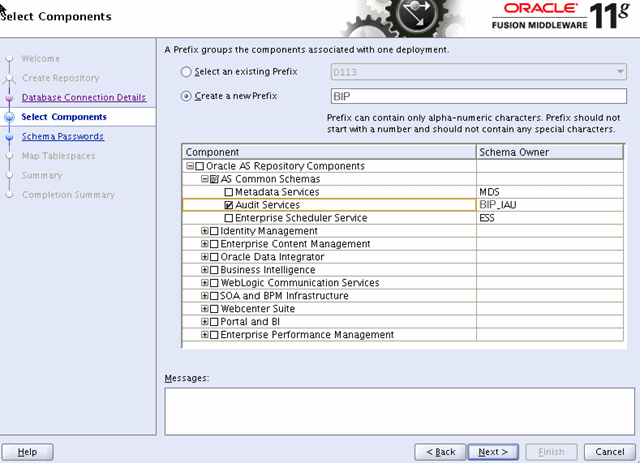
Click Next and accept the tablespace creation.
Click Finish to start the process.
When the Repository Creation Utility process finishes, the following three audit-related schemas will be created in your database:
<prefix>_IAU (for example:. BIP_IAU)
<prefix>_IAU_APPEND (for example: BIP_IAU_APPEND)
<prefix>_IAU_VIEWER (for example:. BIP_IAU_VIEWER)
After you create a database schema for your auditing data, next create a JDBC connection on your WebLogic Server so the Audit Framework can access the database schema that was created with the RCU in the previous step.
To create the JDBC connection:
Connect to the Oracle WebLogic Server administration console: http://hostname:port/console (e.g. http://report.oracle.com:7001/console)
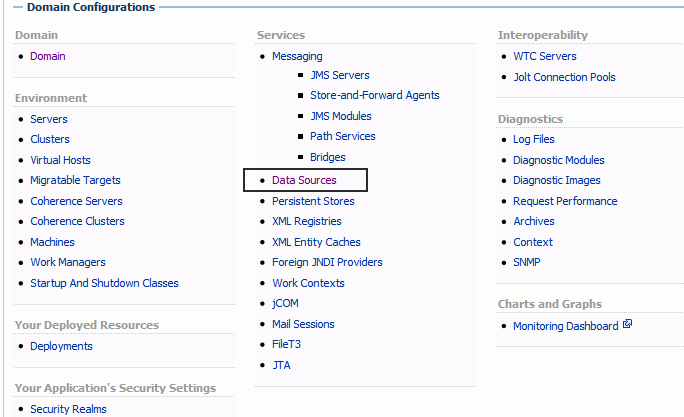
Under Services, click the Data Sources link, as shown in the following figure:
Click Lock and Edit.
On the Summary of JDBC Data Sources page, click New and then click Generic Data Source.
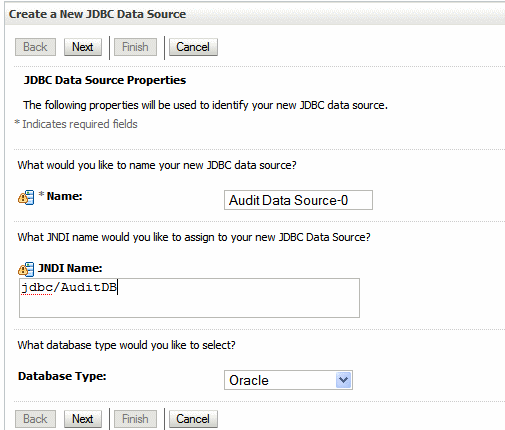
Enter the following details for the new data source:
Name
Example: Audit Data Source-0
JNDI Name
Example: jdbc/AuditDB
Database Type
Example: Oracle
The following figure shows the example entries:
Click Next and select the database driver. Choose "Oracle's Driver (Thin XA) Versions: 9.0.1 or later" if you are using Oracle database, and click Next.
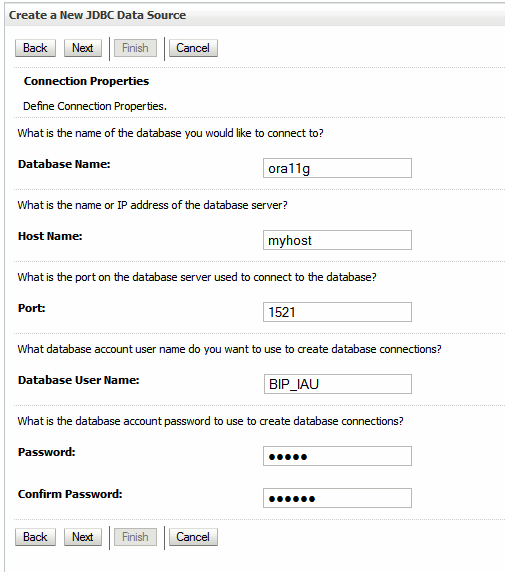
In the Connections Properties page, enter the following:
Database Name: Enter the name of the database (SID) to which you will connect.
Host Name: Enter the hostname of the database.
Port: Enter the database port.
Database User Name: Enter the name of the audit schema that you created in RCU. The suffix is always _IAU for the audit schema. For example, if you supplied the prefix as "BIP"’, then the schema name would be "BIP_IAU".
Password: Enter the password for the audit schema that you created in RCU.
An example Connections Properties page is shown in the following figure:
Click Next. Accept the defaults, and click Test Configuration to verify the connection.
Click Next. Select the listed servers where you want to make this JDBC connection available.
Click Finish and then click Activate Changes in the Change Center.
To register the JNDI/JDBC data source as your auditing data storage with Fusion Middleware Control (Enterprise Manager):
Log in to Fusion Middleware Control.
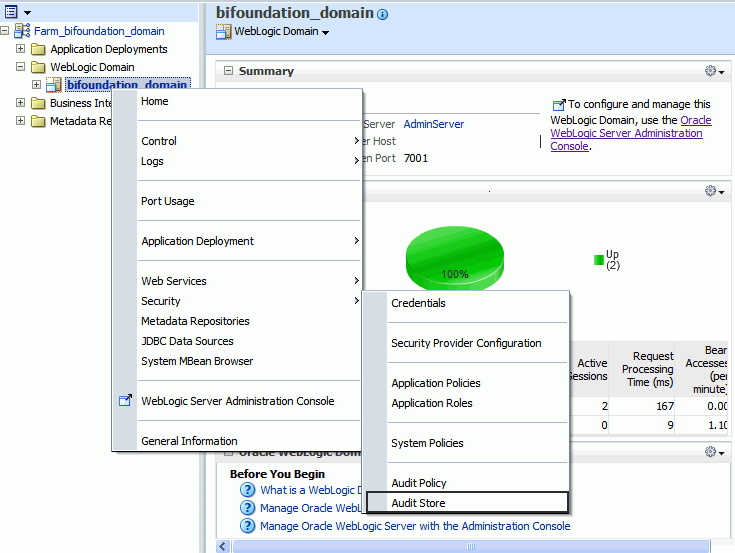
Navigate to the WebLogic Domain, right click bifoundation_domain, then select Security, then Audit Store. The navigation path is shown in the following figure:
Click Search Data Sources. From the Select Data Source dialog, select the data source you created and click OK.
Click Apply to continue
Restart WebLogic Server.
When the WebLogic Server is restarted, BI Publisher will store all auditing data into the database table called "IAU_BASE". To verify this procedure, try logging in to BI Publisher and opening a few reports. You should see the activity audited in the "IAU_BASE" table. If not, check the log file, which is located at: $BI_HOME/user_projects/domains/bifoundation_domain/servers/AdminServer/logs/AdminServer-diagnostic.log
for possible errors. Once the data is successfully loading to the database tables, you can design your own auditing reports using BI Publisher.
Once you have the auditing repository set up, you can use BI Publisher to create your own reports to visualize your auditing data. To create a report on your auditing data in BI Publisher:
Register the data source in BI Publisher.
Create a data model.
Create the report.
Register the audit data source (JNDI/JDBC connection) that you created in the previous procedure as a JNDI data source in BI Publisher. Because you created a JDBC connection registered as JNDI, you do not need to create a new JDBC connection by typing the connection URL, username/password, and so on. You can just register it using the JNDI name (for example: jdbc/AuditDB).
Log in to BI Publisher with administrator privileges and click the Administration link.
Under Data Sources, click JNDI Connection, then click Add Data Source.
Enter the Data Source Name and JNDI Name. The JNDI Name is the name you provided in the WebLogic Console as the auditing data source (for example :jdbc/AuditDB).
Click Test Connection to ensure that the data source connection works.
Add the appropriate roles to the data source so that the report developers and consumers can view the reports built on this data source.
Click Apply to save.
To create a data model from your auditing data source:
Note: For the complete guidelines for developing data models in BI Publisher, see the Oracle Fusion Middleware Data Modeling Guide for Oracle Business Intelligence Publisher.
On the global header, click New and then click Data Model.
Set the Default Data Source to the audit JNDI data source.
Select SQL Query for your data set
Use the Query Builder to build a query or just type a SQL query against the IAU_BASE table. The IAU_BASE table contains all the auditing data for other products running on the WebLogic Server such as JPS, OID, and so on. To create a data model that contains only the BI Publisher data, then you can filter the data based on the value of the IAU_COMPONENTTYPE column that contains the product name. For BI Publisher, the value is "xmlpserver".
The following SQL query sample selects only BI Publisher data:
select     "IAU_BASE"."IAU_COMPONENTTYPE" as "IAU_COMPONENTTYPE",
     "IAU_BASE"."IAU_EVENTTYPE" as "IAU_EVENTTYPE",
     "IAU_BASE"."IAU_EVENTCATEGORY" as "IAU_EVENTCATEGORY",
     "IAU_BASE"."IAU_TSTZORIGINATING" as "IAU_TSTZORIGINATING",
   to_char("IAU_TSTZORIGINATING", 'YYYY-MM-DD') IAU_DATE,
   to_char("IAU_TSTZORIGINATING", 'DAY') as IAU_DAY,
   to_char("IAU_TSTZORIGINATING", 'HH24') as IAU_HH24,
   to_char("IAU_TSTZORIGINATING", 'WW') as IAU_WEEK_OF_YEAR,
     "IAU_BASE"."IAU_INITIATOR" as "IAU_INITIATOR",
     "IAU_BASE"."IAU_RESOURCE" as "IAU_RESOURCE",
     "IAU_BASE"."IAU_TARGET" as "IAU_TARGET",
     "IAU_BASE"."IAU_MESSAGETEXT" as "IAU_MESSAGETEXT",
     "IAU_BASE"."IAU_FAILURECODE" as "IAU_FAILURECODE",
     "IAU_BASE"."IAU_REMOTEIP" as "IAU_REMOTEIP"
from    "BIP_IAU"."IAU_BASE" "IAU_BASE"
where "IAU_BASE"."IAU_COMPONENTTYPE" = 'xmlpserver'
To test your data model, click Get XML Output. Select a sample size, and run your data model. Save the sample XML to your data model.
Save your data model.
Now you can use one of the BI Publisher’s layout options to design the report layout and visualize the auditing data. To create a report using the BI Publisher layout editor: .
On the global header, click New and then click Report.
Select the data model you created in the previous procedure.
To use the layout editor, click Add New Layout, and then click one of the Basic Templates to get started.
For complete instructions on using the layout editor, see the topic: "Creating a BI Publisher Layout Template" in the Help or in the Oracle Fusion Middleware Report Designer's Guide for Oracle Business Intelligence Publisher.
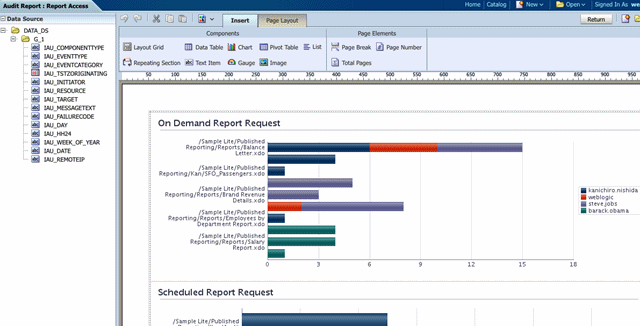
The following figure shows using the layout editor to design a report based on the auditing data:
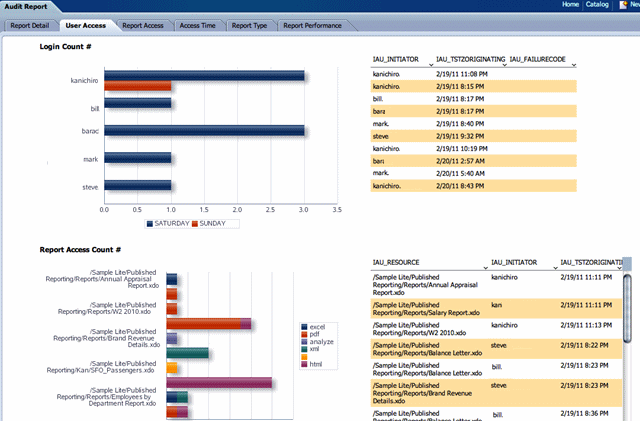
The following figure shows a sample completed auditing report displayed in the report viewer:
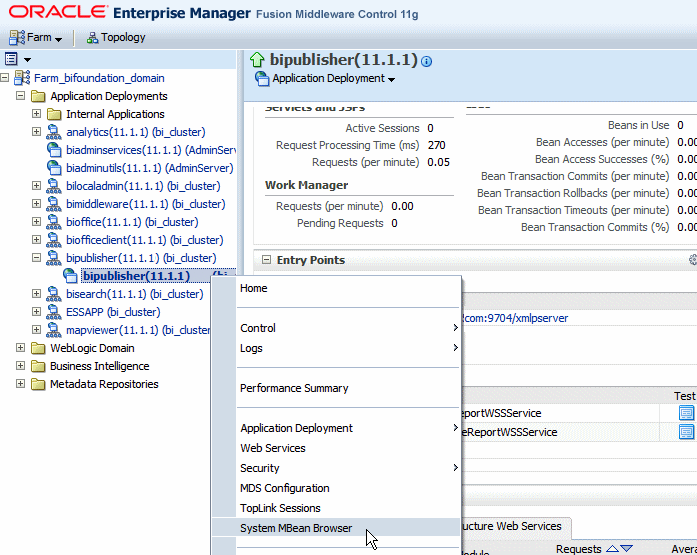
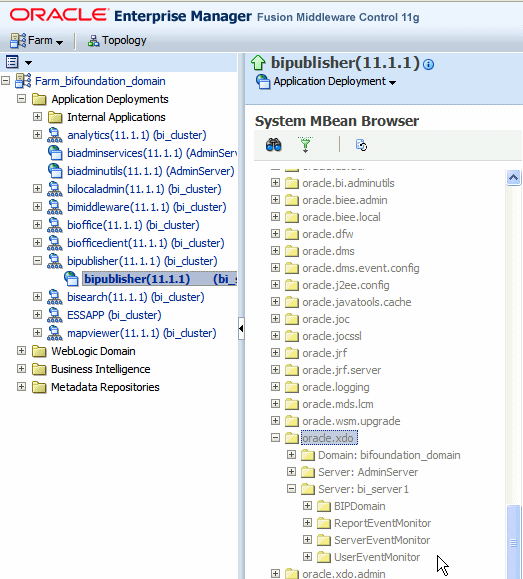
To view the performance statistics collected by the Report Event Monitor, Service Event Monitor, and User Event Monitor, navigate to the System MBean browser as follows:
In Oracle Fusion Middleware Control, locate the BI Publisher server. For example:
Under Application Deployments, expand bipublisher (11.1.1) (bi_cluster), and then right-click bipublisher (11.1.1)(bi_server1)
From the menu, click System MBean Browser, as shown in the following figure:
In the System MBean Browser, under the Application Defined MBeans, expand the oracle.xdo folder to view the BI Publisher MBeans. Expand the list and select the bean to view the details.
![]()
Copyright © 2010, 2011, Oracle and/or its affiliates. All rights reserved.