| Oracle® Database 2 Day DBA 11g Release 1 (11.1) Part Number B28301-03 |
|
|
View PDF |
| Oracle® Database 2 Day DBA 11g Release 1 (11.1) Part Number B28301-03 |
|
|
View PDF |
Oracle Database includes a set of advisors to help you manage and tune your database. This section contains background information about these advisors and instructions for their use. The following topics are covered:
Advisors are powerful tools for database management. They provide specific advice on how to address key database management challenges, covering a wide range of areas including space, performance, and undo management. In general, advisors produce more comprehensive recommendations than alerts. This is because alert generation is intended to be low cost and have minimal impact on performance, whereas advisors consume more resources and perform more detailed analysis. This, along with the what-if capability of some advisors, provides vital information for tuning that cannot be procured from any other source. You run advisors from Oracle Enterprise Manager Database Control (Database Control). Some are also run automatically during maintenance windows (time periods).
Advisors are provided to help you improve database performance. These advisors include Automatic Database Diagnostic Monitor (ADDM), SQL advisors, and memory advisors. For example, one of the memory advisors, the Shared Pool Advisor, graphically displays the impact on performance of changing the size of this component of the System Global Area (SGA).
You can run a performance advisor when faced with the following situations:
You want to resolve a problem in a specific area, for example, to determine why a given SQL statement is consuming 50 percent of CPU time and what to do to reduce its resource consumption.You can use the SQL Tuning Advisor.
During application development, you want to tune a new schema and its associated SQL workload for optimal performance. You can use the SQL Access Advisor.
You are planning to add memory to your system. You can use the Memory Advisor to determine the database performance impact of increasing your SGA or PGA (Program Global Area).
You can run all advisors from the Advisor Central home page, accessible through a link on the Database Home page. You can also invoke many of the advisors from the Performance page, through recommendations from ADDM, or from alerts.
Table 10-1 describes the performance advisors. Other advisors are listed in Table 10-2.
Table 10-1 Performance Advisors
| Advisor | Description |
|---|---|
|
ADDM makes it possible for Oracle Database to diagnose its own performance and determine how any identified problems can be resolved.See "Performance Self-Diagnostics: Automatic Database Diagnostic Monitor" and "Diagnosing Performance Problems Using ADDM". |
|
|
The SQL Tuning Advisor analyzes one or more SQL statements and makes recommendations for improving performance. This advisor is run automatically during the maintenance periods, but can also be run manually. See "About the Automatic SQL Tuning Advisor" and "Running the SQL Tuning Advisor". The SQL Access Advisor tunes a schema to a given SQL workload. For example, the SQL Access Advisor can provide recommendations for creating indexes, materialized views, or partitioned tables for a given workload. See "Running the SQL Access Advisor". |
|
The Memory Advisors provide graphical analyses of total memory target settings, SGA and PGA target settings, or SGA component size settings. You use these analyses to tune database performance and for what-if planning. Depending on the current memory management mode, different memory advisors are available.
See "Using the Memory Advisors". See "Managing Memory" for more information about memory management modes. |
Table 10-2 Other Advisors
| Advisor | Description |
|---|---|
|
The Segment Advisor provides advice on whether or not a segment is a good candidate for a shrink operation based on the level of space fragmentation within that segment. The advisor also reports on the historical growth trend of segments. You can use this information for capacity planning and for arriving at an informed decision about which segments to shrink. See "Reclaiming Unused Space". |
|
|
The Undo Advisor assists in correctly sizing the undo tablespace. The Undo Advisor can also be used to set the low threshold value of the undo retention period for any Oracle Flashback requirements. See "Computing the Minimum Undo Tablespace Size Using the Undo Advisor". |
The SQL advisors examine a given SQL statement or a set of SQL statements and provide recommendations to improve efficiency. These advisors can make various types of recommendations, such as creating SQL profiles (a collection of information that enables the query optimizer to create an optimal execution plan for a SQL statement), restructuring SQL statements, creating additional indexes, materialized views, or partitions, and refreshing optimizer statistics. Oracle Enterprise Manager Database Control (Database Control) enables you to accept and implement many of these recommendations with just a few mouse clicks.
The two SQL advisors are the SQL Tuning Advisor and the SQL Access Advisor.
SQL Tuning Advisor
You use the SQL Tuning Advisor to tune a single or multiple SQL statements. Typically, you run this advisor in response to an ADDM performance finding that recommends its use. You can also run it periodically on the most resource-intensive SQL statements, as well as on a SQL workload.
When tuning multiple SQL statements, the SQL Tuning Advisor does not recognize interdependencies between the SQL statements. It solves SQL performance problems by identifying problems with individual SQL statements, such as a poorly performing optimizer plan or the mistaken use of certain SQL structures.
You can run the SQL Tuning Advisor against the following sources:
Top Activity—The most resource-intensive SQL statements executed during the last hour. Use this option to tune SQL statements that might have caused recent performance problems.
Historical SQL— A set of SQL statements over any 24 hour window (time period). Use this option for proactive tuning of SQL statements.
SQL Tuning Sets (STS)—A set of SQL statements you provide. An STS can be created from SQL statements captured by AWR snapshots or from any SQL workload.
SQL Access Advisor
The SQL Access Advisor is primarily responsible for making schema modification recommendations. It can recommend that you create access structures such as indexes and materialized views to optimize SQL queries. It can also recommend that you partition tables, indexes, or materialized views to improve query performance.
The SQL Access Advisor takes a SQL workload as input. You can select your workload from different sources, including current and recent SQL activity, a SQL repository, or a user-defined workload such as from a development environment. The advisor then makes recommendation to improve the performance of the workload as a whole.
Statement Tuning and Workload Tuning
Note that both the SQL Tuning Advisor and the SQL Access Advisor provide index creation recommendations. The SQL Tuning Advisor recommends creation of indexes only when it anticipates exceptional performance gains for the SQL statement being tuned. However, creation of new indexes may adversely impact the performance of DML insert, update, and delete operations. The SQL Tuning advisor does not take this into account while generating new index recommendations.
The SQL Access Advisor, on the other hand, considers the impact of new indexes on the complete workload. As such, if an index improves performance of one SQL statement but adversely impacts the rest of the workload, the new index will not be recommended by the SQL Access Advisor. For this reason, the SQL Tuning Advisor always recommends validating its new index recommendation by running the SQL Access Advisor.
See Also:
Oracle Database 2 Day + Performance Tuning Guide for more information about tuning SQL statements with the SQL Tuning Advisor
Oracle Database 2 Day + Performance Tuning Guide for more information about the SQL Access Advisor
Beginning with Oracle Database 11g, the SQL Tuning Advisor runs automatically during system maintenance windows (time periods) as a maintenance task. During each automatic run, the advisor selects high-load SQL queries in the system and generates recommendations on how to tune these queries.
The Automatic SQL Tuning Advisor can be configured to automatically implement SQL profile recommendations. A SQL profile contains additional SQL statistics that are specific to the SQL statement and enable the query optimizer to generate a significantly better execution plan at run time. If you enable automatic implementation, then the advisor creates SQL profiles for only those SQL statements where the performance increase would be at least threefold. Other types of recommendations, such as the creation of new indexes, refreshing optimizer statistics, or restructuring SQL, can be implemented only manually. DML statements are not considered for tuning by the Automatic SQL Tuning Advisor.
You can view a summary of the results of automatic SQL tuning over a specified period (such as the previous 7 days), and a detailed report about recommendations made for all SQL statements that the SQL Tuning Advisor has processed. You can then implement selected recommendations. You can also view the recommendations that were automatically implemented.
You can control when the Automatic SQL Tuning Advisor runs, and you can disable it altogether if desired.
See Also:
Oracle Database Administrator's Guide for more information about automated maintenance tasks
The following are some of the configuration tasks that you might want to perform for the Automatic SQL Tuning Advisor:
Enable automatic implementation of SQL profile recommendations.
Automatic implementation is disabled by default.
Select the maintenance windows (time periods) in which the advisor runs.
The Automatic SQL Tuning Advisor runs in all maintenance windows by default.
Modify the start time and duration of existing maintenance windows or create new maintenance windows.
To configure the Automatic SQL Tuning Advisor:
Go to the Database Home page, logging in as user SYS.
Click Server to display the Server page.
In the Oracle Scheduler section, click Automated Maintenance Tasks.
The Automated Maintenance Tasks page appears.
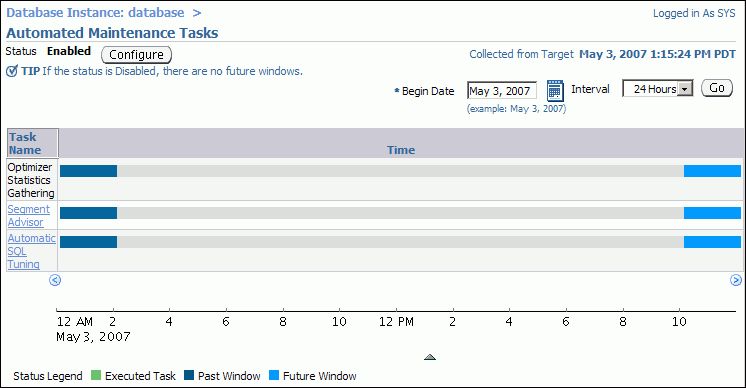
Click Configure.
The Automated Maintenance Tasks Configuration page appears.
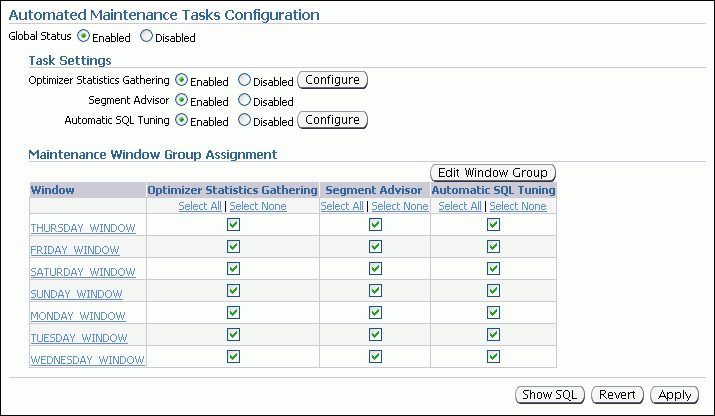
(Optional) To disable the Automatic SQL Tuning Advisor altogether, in the Task Settings section, click the Disabled option for Automatic SQL Tuning.
(Optional) To prevent the Automatic SQL Tuning Advisor from running in particular maintenance windows, in the Maintenance Window Group Assignment section, deselect check boxes under the Automatic SQL Tuning heading.
Click Apply to save any changes made so far.
A confirmation message is displayed.
To enable automatic implementation of SQL profile recommendations, complete the following steps:
In the Task Settings section, next to the Automatic SQL Tuning options, click Configure.
The Automatic SQL Tuning Settings page appears.

Next to Automatic Implementation of SQL Profiles, click the Yes option.
You must be logged in as user SYS to change this option.
Click Apply.
A confirmation message is displayed.
In the locator links at the top, left-hand side of the page, click Automated Maintenance Tasks Configuration to return to the Automated Maintenance Tasks Configuration page.
(Optional) To make changes to the start time and duration of existing maintenance windows, to disable individual maintenance windows, or to create additional maintenance windows, click Edit Window Group.
The Edit Window Group page appears. From this page you can change the settings of individual windows or you can add or remove windows to or from the window group MAINTENANCE_WINDOW_GROUP.
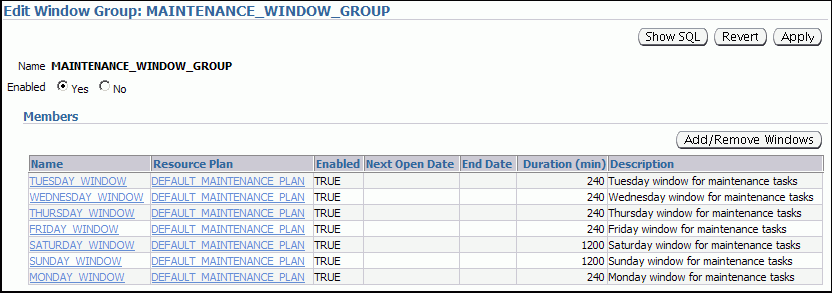
See the online Help for this page for more information.
Note:
If you create a new window (time period) to run automated maintenance tasks, you must add that window toMAINTENANCE_WINDOW_GROUP.See Also:
Oracle Database Administrator's Guide for more information about maintenance windows and how to configure them
You can track the activities of the Automatic SQL Tuning Advisor with Database Control.
To view automatic SQL tuning results:
Go to the Database Home page.
Click Server to display the Server page.
In the Oracle Scheduler section, click Automated Maintenance Tasks.
The Automated Maintenance Tasks page appears.
Click Automatic SQL Tuning.
The Automatic SQL Tuning Result Summary page appears, showing graphical summaries of the Automatic SQL Tuning Advisor activities and findings.
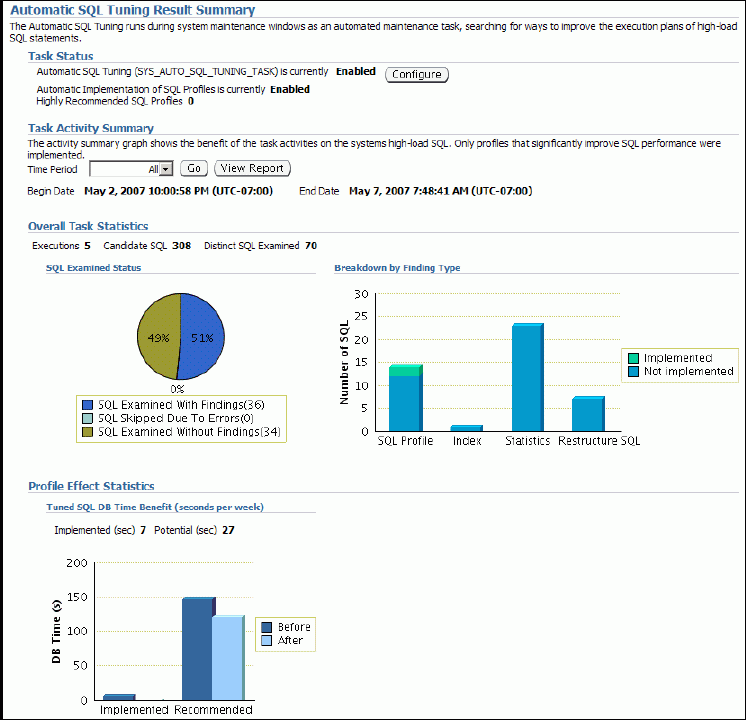
To view recommendations, click View Report under the heading Task Activity Summary.
The Automatic SQL Tuning Result Details page appears, showing the SQL statements for which recommendations were made during the designated period.
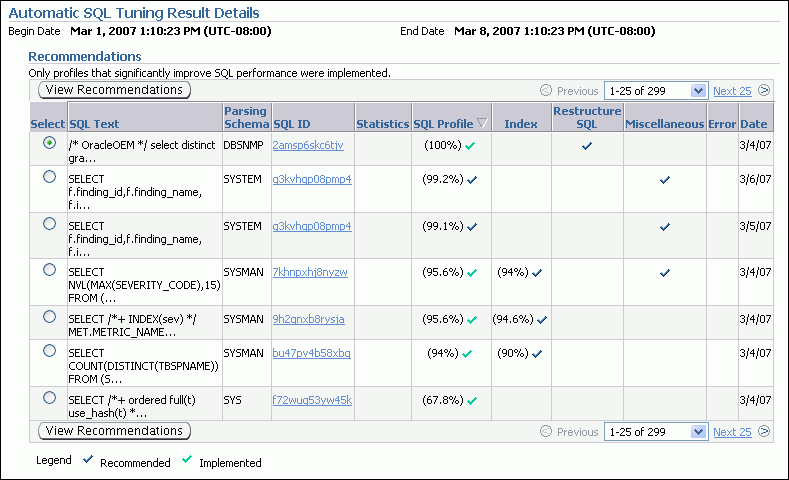
A green check mark in the SQL Profile column indicates a recommendation that was automatically implemented.
By default, automatic implementation is disabled. See "Configuring the Automatic SQL Tuning Advisor" for instructions for enabling it.
(Optional) Select a SQL statement in the Recommendations table (based on the SQL Text column), and then click View Recommendations.
The Recommendations for SQL ID page appears, describing each recommendation for the statement in detail. On this page, you can select a recommendation and then click Implement to implement it.
Use the SQL Tuning Advisor for tuning SQL statements. Typically, you run this advisor in response to an ADDM performance finding that recommends its use. You can also start the SQL Tuning Advisor manually. One reason to do this is to tune statements that the Automatic SQL Tuning Advisor has not considered for tuning.
As described in "About the SQL Advisors", the SQL Tuning Advisor can select SQL statements to tune from a number of sources. The following scenario assumes that you want to tune the SQL statements with the most activity:
To run the SQL Tuning Advisor:
Go to the Database Home page.
At the bottom of the page, under Related Links, click Advisor Central.
On the Advisor Central page, click SQL Advisors.
On the SQL Advisors page, click SQL Tuning Advisor.
The Schedule SQL Tuning Advisor page appears.
Under SQL Tuning Advisor Data Source Links, click Top Activity.
The Top Activity page appears. This page has a timeline graph showing the database activity based on the active sessions over the last hour.
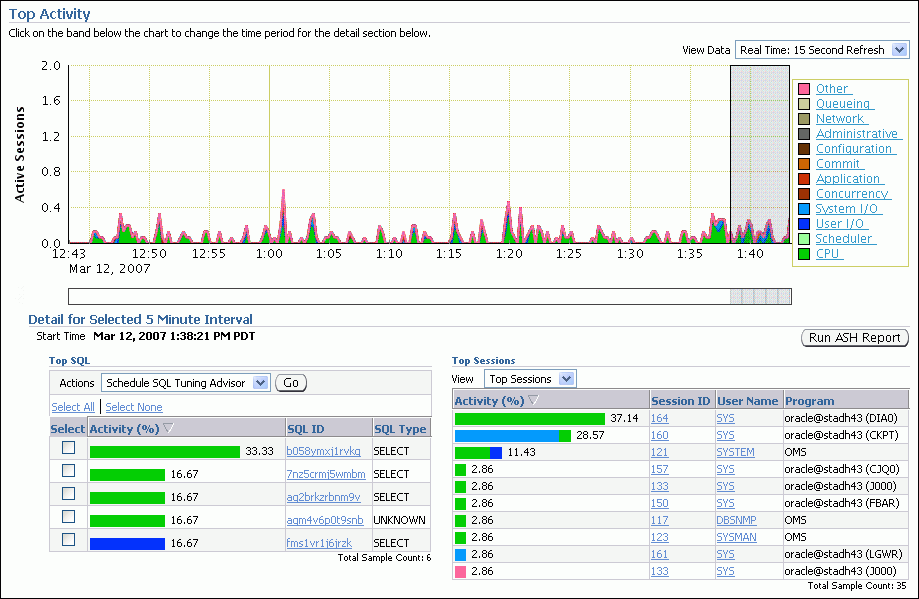
(Optional) Expand the timeline by selecting Historical from the View Data list at the upper right-hand side of the page.
Select an interval to analyze by clicking the bar under the timeline graph.
The Top SQL and Top Sessions tables show the activity within the selected period.
In the Top SQL section, select one or more SQL statements, and then click the Go button next to Schedule SQL Tuning Advisor.
The Schedule SQL Tuning Advisor page returns, indicating the statements that are to be tuned.
Enter a task name and description, select the scope for the analysis (Comprehensive or Limited), and select a start time for the analysis task.
Click OK.
A Processing page appears. When the task is complete, the SQL Tuning Results page appears, showing a summary of recommendations for each SQL statement analyzed.
The recommendation can include one or more of the following:
Accept the generated SQL profile.
Gather optimizer statistics on objects with stale or no statistics.
Rewrite a query for better performance.
Create an index to offer alternate, faster access paths to the query optimizer.
To view recommendations for a specified SQL statement, select a statement from the list of recommendations, and then click View.
The Recommendations for SQL ID page appears, showing one or more recommendations for the statement.
(Optional) Select a recommendation, and then click Implement.
The Implement Recommendation page appears. Depending on the type of recommendation, select options, and then click OK to proceed.
You run the SQL Access Advisor to get recommendations for improving the performance of a workload. You can run it on a periodic basis to avoid performance problems, or run it to verify schema change recommendations from the SQL Tuning Advisor.
To run the SQL Access Advisor:
Go to the Database Home page.
At the bottom of the page, under Related Links, click Advisor Central.
On the Advisor Central page, click SQL Advisors.
On the SQL Advisors page, click SQL Access Advisor.
A page appears prompting you for initial options. Click Help for information about the options for this page.
Select an option, and then click Continue.
The Workload Source page appears. It is the first page of the SQL Access Advisor wizard.
Click Help to obtain help for this and subsequent wizard pages. Follow directions and make the required selections for each wizard page, clicking Next when you are ready to proceed to the next page.
Continue through the wizard until you reach the Review page. Review your selections and then click Submit to start the analysis.
The Advisor Central page appears, displaying a confirmation message indicating that your task has been started successfully.
Click the Refresh button (not your browser's Refresh icon) to view the status of your task.
When your SQL Access Advisor task has completed, select View Result.
The Result for Task page appears.
The Summary subpage shows you the potential for improvement under the headings Workload I/O Cost and Query Execution Time Improvement.
The Recommendations subpage shows the recommendations, if any, for improving performance. A recommendation might consist of, for example, a SQL script with one or more CREATE INDEX statements, which you can run by clicking Schedule Implementation.
Adequate physical memory has a significant impact on the performance of your Oracle Database. With its automatic memory management capabilities, Oracle Database can automatically adjust the memory distribution among the various SGA and PGA components for optimal performance. These adjustments are made within the boundaries of the total amount of memory that you allocate to the database.
ADDM periodically evaluates the performance of your database to determine performance problems. If ADDM finds that the current amount of available memory is inadequate and adversely affecting performance, it can recommend that you increase memory allocations. You can select new memory allocations using the Memory Advisors.
Additionally, you can use the Memory Advisors to perform what-if analysis on the following:
The database performance benefits of adding physical memory to your database
The database performance impact of reducing the physical memory available to your database
See Also:
With the Memory Advisors, you can obtain memory sizing advice as follows:
If automatic memory management is enabled, you can get advice for setting the target amount of memory to allocate to the Oracle instance.
If automatic memory management is disabled and automatic shared memory management is enabled, you can gain advice on configuring the target sizes of the SGA and instance PGA.
If only manual shared memory management is enabled, you can get advice on sizing the shared pool, buffer cache, and instance PGA.
The following steps describe how to obtain memory sizing advice when Automatic Shared Memory Management is enabled.
To obtain memory sizing advice:
Go to the Database Home page.
At the bottom of the page, click Advisor Central.
On the Advisor Central page, click Memory Advisors.
The Memory Advisors page appears.
On the SGA subpage, next to the Total SGA Size field, click Advice.
The SGA Size Advice child page appears in a separate window. (Figure 10-3).
Improvement in DB Time (%) is plotted against Total SGA size. A higher number for Improvement in DB Time is better for performance.
In , the graph indicates that increasing the SGA size greater than 450 MB results in no performance gain. Thus, 450 MB is the recommended optimal SGA size.
Click OK to close the SGA Size Advice child page.
Near the top of the Memory Advisors page, click PGA to display the PGA subpage.
Next to Aggregate PGA Target, click Advice.
The PGA Target Advice page appears, plotting cache hit percentage against PGA target size.
The cache hit percentage is the percentage of read requests serviced by memory, as opposed to those requests serviced by reading from disk, which is slower. A higher hit percentage indicates better cache performance. The optimal zone for cache hit percentage is between 75 and 100 percent. However, it is not safe to conclude that your database is having performance problems simply because your cache hit percentage is not within the optimal zone. When the amount of currently available PGA memory is not adequate for optimal performance, ADDM automatically recommends adjusting this value in a performance finding.
Click OK to close the PGA Target Advice page.
See Also: