12 Managing Optimizer Statistics: Basic Topics
This chapter explains basic tasks relating to optimizer statistics management. "Managing Optimizer Statistics: Advanced Topics" covers advanced concepts and tasks.
This chapter contains the following topics:
12.1 About Optimizer Statistics Collection
In Oracle Database, optimizer statistics collection is the gathering of optimizer statistics for database objects, including fixed objects. The database can collect optimizer statistics automatically. You can also collect them manually using the DBMS_STATS package (see "Gathering Optimizer Statistics Manually").
12.1.1 Purpose of Optimizer Statistics Collection
The contents of tables and associated indexes change frequently, which can lead the optimizer to choose suboptimal execution plan for queries. Thus, statistics must be kept current to avoid any potential performance issues because of suboptimal plans.
To minimize DBA involvement, Oracle Database automatically gathers optimizer statistics at various times. Some automatic options are configurable, such enabling AutoTask to run DBMS_STATS.
12.1.2 User Interfaces for Optimizer Statistics Management
You can manage optimizer statistics either through Oracle Enterprise Manager Cloud Control (Cloud Control) or using PL/SQL on the command line.
12.1.2.1 Graphical Interface for Optimizer Statistics Management
The Manage Optimizer Statistics page in Cloud Control is a GUI that enables you to manage optimizer statistics.
12.1.2.1.1 Accessing the Database Home Page in Cloud Control
Oracle Enterprise Manager Cloud Control enables you to manage multiple databases within a single GUI-based framework.
To access a database home page using Cloud Control:
-
Log in to Cloud Control with the appropriate credentials.
-
Under the Targets menu, select Databases.
-
In the list of database targets, select the target for the Oracle Database instance that you want to administer.
-
If prompted for database credentials, then enter the minimum credentials necessary for the tasks you intend to perform.
See Also:
Oracle Enterprise Manager Cloud Control Introduction for an overview of Cloud Control12.1.2.1.2 Accessing the Manage Optimizer Statistics Page
You can perform most necessary tasks relating to optimizer statistics through pages linked to by the Manage Optimizer Statistics page.
To manage optimizer statistics using Cloud Control:
-
Access the Database Home page.
-
From the Performance menu, select SQL, then Optimizer Statistics.
The Manage Optimizer Statistics appears.
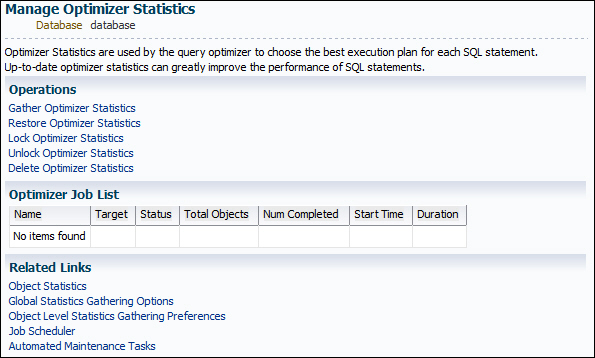
Description of the illustration manage_opt_stats.jpg
See Also:
Online Help for Oracle Enterprise Manager Cloud Control12.1.2.2 Command-Line Interface for Optimizer Statistics Management
You can use the DBMS_STATS package to perform most optimizer statistics tasks. Use the DBMS_AUTO_TASK_ADMIN PL/SQL package to enable and disable automatic statistics gathering.
See Also:
Oracle Database PL/SQL Packages and Types Reference to learn how to useDBMS_STATS and DBMS_AUTO_TASK_ADMIN12.2 Controlling Automatic Optimizer Statistics Collection
The automated maintenance tasks infrastructure (known as AutoTask) schedules tasks to run automatically in Oracle Scheduler windows known as maintenance windows. By default, one window is scheduled for each day of the week. Automatic optimizer statistics collection runs as part of AutoTask. By default, the collection runs in all predefined maintenance windows.
Note:
Data visibility and privilege requirements may differ when using automatic optimizer statistics collection with pluggable databases. See Oracle Database Administrator's Guide for a table that summarizes how manageability features work in a container database (CDB).To collect the optimizer statistics, the database calls an internal procedure that operates similarly to the GATHER_DATABASE_STATS procedure with the GATHER AUTO option. Automatic statistics collection honors all preferences set in the database.
The principal difference between manual and automatic collection is that the latter prioritizes database objects that need statistics. Before the maintenance window closes, automatic collection assesses all objects and prioritizes objects that have no statistics or very old statistics.
Note:
When gathering statistics manually, you can reproduce the object prioritization of automatic collection by using theDBMS_AUTO_TASK_IMMEDIATE package. This package runs the same statistics gathering job that is executed during the automatic nightly statistics gathering job.This section contains the following topics:
-
Controlling Automatic Optimizer Statistics Collection Using Cloud Control
-
Controlling Automatic Optimizer Statistics Collection from the Command Line
12.2.1 Controlling Automatic Optimizer Statistics Collection Using Cloud Control
You can enable and disable all automatic maintenance tasks, including automatic optimizer statistics collection, using Cloud Control.
The default window timing works well for most situations. However, you may have operations such as bulk loads that occur during the window. In such cases, to avoid potential conflicts that result from operations occurring at the same time as automatic statistics collection, Oracle recommends that you change the window accordingly.
To control automatic optimizer statistics collection using Cloud Control:
-
Access the Database Home page, as described in "Accessing the Database Home Page in Cloud Control."
-
From the Administration menu, select Oracle Scheduler, then Automated Maintenance Tasks.
The Automated Maintenance Tasks page appears.
This page shows the predefined tasks. To retrieve information about each task, click the corresponding link for the task.
-
Click Configure.
The Automated Maintenance Tasks Configuration page appears.
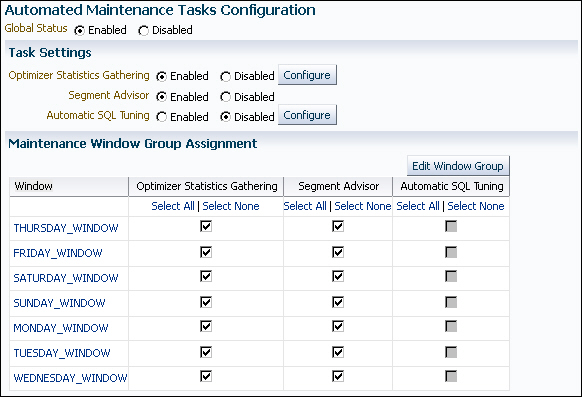
Description of the illustration sta_maint_task_config.jpg
By default, automatic optimizer statistics collection executes in all predefined maintenance windows in
MAINTENANCE_WINDOW_GROUP. -
Perform the following steps:
-
In the Task Settings section for Optimizer Statistics Gathering, select either Enabled or Disabled to enable or disable an automated task.
Note:
Oracle strongly recommends that you not disable automatic statistics gathering because it is critical for the optimizer to generate optimal plans for queries against dictionary and user objects. If you disable automatic collection, ensure that you have a good manual statistics collection strategy for dictionary and user schemas. -
To disable statistics gathering for specific days in the week, check the appropriate box next to the window name.
-
To change the characteristics of a window group, click Edit Window Group.
-
To change the times for a window, click the name of the window (for example, Monday Window), and then in the Schedule section, click Edit.
The Edit Window page appears.
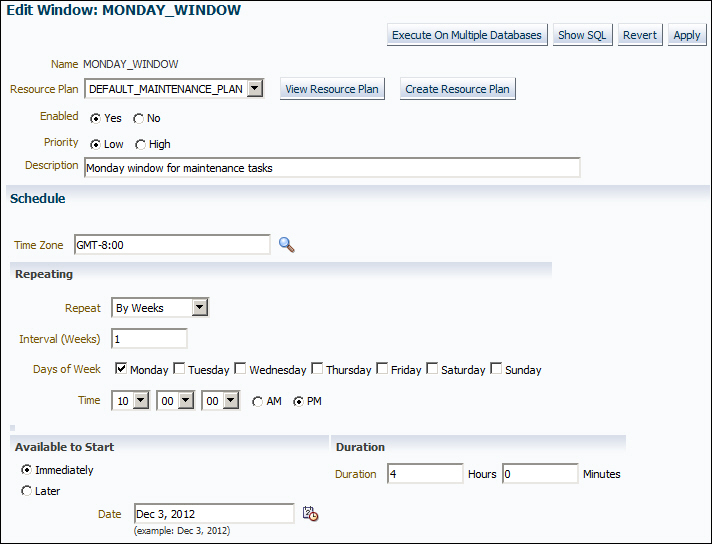
Description of the illustration edit_window.jpg
In this page, you can change the parameters such as duration and start time for window execution.
-
Click Apply.
-
See Also:
Online Help for Oracle Enterprise Manager Cloud Control12.2.2 Controlling Automatic Optimizer Statistics Collection from the Command Line
If you do not use Cloud Control to enable and disable automatic optimizer statistics collection, then you have the following options:
-
Run the
ENABLEorDISABLEprocedure in theDBMS_AUTO_TASK_ADMINPL/SQL package.This package is the recommended command-line technique. For both the
ENABLEorDISABLEprocedures, you can specify a particular maintenance window with thewindow_nameparameter. See Oracle Database PL/SQL Packages and Types Reference for complete reference information. -
Set the
STATISTICS_LEVELinitialization level toBASICto disable collection of all advisories and statistics, including Automatic SQL Tuning Advisor.Note:
Because monitoring and many automatic features are disabled, Oracle strongly recommends that you do not setSTATISTICS_LEVELtoBASIC.
To control automatic statistics collection using DBMS_AUTO_TASK_ADMIN:
-
Connect SQL*Plus to the database with administrator privileges, and then do one of the following:
-
To enable the automated task, execute the following PL/SQL block:
BEGIN DBMS_AUTO_TASK_ADMIN.ENABLE ( client_name => 'auto optimizer stats collection' , operation => NULL , window_name => NULL ); END; / -
To disable the automated task, execute the following PL/SQL block:
BEGIN
  DBMS_AUTO_TASK_ADMIN.DISABLE (
    client_name  => 'auto optimizer stats collection'
,   operation    => NULL
,   window_name  => NULL
);
END;
/
-
-
Query the data dictionary to confirm the change.
For example, query
DBA_AUTOTASK_CLIENTas follows:COL CLIENT_NAME FORMAT a31 SELECT CLIENT_NAME, STATUS FROM DBA_AUTOTASK_CLIENT WHERE CLIENT_NAME = 'auto optimizer stats collection';
Sample output appears as follows:
CLIENT_NAME                     STATUS
------------------------------- --------
auto optimizer stats collection ENABLED
To change the window attributes for automatic statistics collection:
-
Connect SQL*Plus to the database with administrator privileges.
-
Change the attributes of the maintenance window as needed.
For example, to change the Monday maintenance window so that it starts at 5 a.m., execute the following PL/SQL program:
BEGIN
  DBMS_SCHEDULER.SET_ATTRIBUTE (
    'MONDAY_WINDOW'
,   'repeat_interval'
,   'freq=daily;byday=MON;byhour=05;byminute=0;bysecond=0'
);
END;
/
See Also:
-
Oracle Database PL/SQL Packages and Types Reference to learn about the
DBMS_AUTO_TASK_ADMINpackage -
Oracle Database Reference to learn about the
STATISTICS_LEVELinitialization parameter
12.3 Setting Optimizer Statistics Preferences
This section contains the following topics:
-
Setting Global Optimizer Statistics Preferences Using Cloud Control
-
Setting Object-Level Optimizer Statistics Preferences Using Cloud Control
-
Setting Optimizer Statistics Preferences from the Command Line
12.3.1 About Optimizer Statistics Preferences
The optimizer statistics preferences set the default values of the parameters used by automatic statistics collection and the DBMS_STATS statistics gathering procedures. You can set optimizer statistics preferences at the table, schema, database (all tables), and global (tables with no preferences and any tables created in the future) levels. In this way, you can automatically maintain optimizer statistics when some objects require settings that differ from the default.
For example, by default the DBMS_STATS preference INCREMENTAL is set to false. You can set INCREMENTAL to true for a range-partitioned table when the last few partitions are updated. Also, when performing a partition exchange operation on a nonpartitioned table, Oracle recommends that you set INCREMENTAL to true and INCREMENTAL_LEVEL to TABLE. With these settings, DBMS_STATS gathers table-level synopses on this table (see "Maintaining Incremental Statistics for Partition Maintenance Operations").
12.3.1.1 Procedures for Setting Statistics Gathering Preferences
Table 12-1 summarizes the DBMS_STATS procedures that change the defaults of parameters used by the DBMS_STATS.GATHER_*_STATS procedures. Parameter values set in DBMS_STAT.GATHER_*_STATS override other settings. If a parameter has not been set, then the database checks for a table-level preference. If no table preference exists, then the database uses the global preference. See Oracle Database PL/SQL Packages and Types Reference for descriptions of CASCADE, METHOD_OPT, and the other parameters.
Table 12-1 Setting Preferences for Gathering Statistics
| DBMS_STATS Procedure | Scope |
|---|---|
|
|
Specified table only. |
|
|
All existing objects in the specified schema. This procedure calls |
|
|
All user-defined schemas in the database. You can include system-owned schemas such as This procedure calls |
|
|
Any object in the database that does not have an existing table preference. All parameters default to the global setting unless a table preference is set or the parameter is explicitly set in the With You can only set the |
See Also:
Oracle Database PL/SQL Packages and Types Reference to learn about theDBMS_STATS procedures for setting optimizer statistics12.3.1.2 Setting Statistics Preferences: Example
Table 12-2 illustrates the relationship between SET_TABLE_PREFS, SET_SCHEMA_STATS, and SET_DATABASE_PREFS.
Table 12-2 Changing Preferences for Statistics Gathering Procedures
| Action | Description |
|---|---|
SQL> SELECT DBMS_STATS.GET_PREFS ('incremental', 'sh',
 'costs') FROM DUAL;

DBMS_STATS.GET_PREFS('INCREMENTAL','SH','COSTS')
------------------------------------------------
TRUE
|
You query the |
SQL> EXEC DBMS_STATS.SET_TABLE_PREFS ('sh', 'costs',
 'incremental', 'false');

PL/SQL procedure successfully completed.
|
You use |
SQL> SELECT DBMS_STATS.GET_PREFS ('incremental', 'sh',
 'costs') FROM DUAL;

DBMS_STATS.GET_PREFS('INCREMENTAL','SH','COSTS')
------------------------------------------------
FALSE
|
You query the |
SQL> EXEC DBMS_STATS.SET_SCHEMA_PREFS ('sh',
 'incremental', 'true');

PL/SQL procedure successfully completed.
|
You use |
SQL> SELECT DBMS_STATS.GET_PREFS ('incremental', 'sh',
 'costs') FROM DUAL;

DBMS_STATS.GET_PREFS('INCREMENTAL','SH','COSTS')
------------------------------------------------
TRUE
|
You query the |
SQL> EXEC DBMS_STATS.SET_DATABASE_PREFS ('incremental',
 'false');

PL/SQL procedure successfully completed.
|
You use |
SQL> SELECT DBMS_STATS.GET_PREFS ('incremental', 'sh',
 'costs') FROM DUAL;

DBMS_STATS.GET_PREFS('INCREMENTAL','SH','COSTS')
------------------------------------------------
FALSE
|
You query the |
12.3.2 Setting Global Optimizer Statistics Preferences Using Cloud Control
A global preference applies to any object in the database that does not have an existing table preference. You can set optimizer statistics preferences at the global level using Cloud Control. See the Cloud Control Help for an explanation of the options on the preference page.
To set global optimizer statistics preferences using Cloud Control:
-
Go to the Manage Optimizer Statistics page, as explained in "Accessing the Manage Optimizer Statistics Page".
-
Click Global Statistics Gathering Options.
The Global Statistics Gathering Options page appears.
-
Make your desired changes, and click Apply.
See Also:
Online Help for Oracle Enterprise Manager Cloud Control12.3.3 Setting Object-Level Optimizer Statistics Preferences Using Cloud Control
You can set optimizer statistics preferences at the database, schema, and table level using Cloud Control.
To set object-level optimizer statistics preferences using Cloud Control:
-
Go to the Manage Optimizer Statistics page, as explained in "Accessing the Manage Optimizer Statistics Page".
-
Click Object Level Statistics Gathering Preferences.
The Object Level Statistics Gathering Preferences page appears.
-
To modify table preferences for a table that has preferences set at the table level, do the following (otherwise, skip to the next step):
-
Enter values in Schema and Table. Leave Table blank to see all tables in the schema.
The page refreshes with the table names.
-
Select the desired tables and click Edit Preferences.
The General subpage of the Edit Preferences page appears.
-
Change preferences as needed and click Apply.
-
-
To set preferences for a table that does not have preferences set at the table level, do the following (otherwise, skip to the next step):
-
Click Add Table Preferences.
The General subpage of the Add Table Preferences page appears.
-
In Table Name, enter the schema and table name.
-
Change preferences as needed and click OK.
-
-
To set preferences for a schema, do the following:
-
Click Edit Schema Preferences.
The General subpage of the Edit Schema Preferences page appears.
-
In Schema, enter the schema name.
-
Change preferences as needed and click OK.
-
See Also:
Online Help for Oracle Enterprise Manager Cloud Control12.3.4 Setting Optimizer Statistics Preferences from the Command Line
If you do not use Cloud Control to set optimizer statistics preferences, then you can invoke the DBMS_STATS procedures described in Table 12-1.
This task has the following prerequisites:
-
To set the global or database preferences, you must have
SYSDBAprivileges, or bothANALYZE ANY DICTIONARYandANALYZE ANYsystem privileges. -
To set schema preferences, you must connect as owner, or have
SYSDBAprivileges, or have theANALYZE ANYsystem privilege. -
To set table preferences, you must connect as owner of the table or have the
ANALYZE ANYsystem privilege.
To set optimizer statistics preferences from the command line:
-
Connect SQL*Plus to the database with the necessary privileges.
-
Optionally, call the
DBMS_STATS.GET_PREFSprocedure to see preferences set at the object level, or at the global level if a specific table is not set.For example, obtain the
STALE_PERCENTparameter setting for thesh.salestable as follows:SELECT DBMS_STATS.GET_PREFS('STALE_PERCENT', 'SH', 'SALES') FROM DUAL; -
Execute the appropriate procedure from Table 12-1, specifying the following parameters:
-
ownname- Set schema name (SET_TAB_PREFSandSET_SCHEMA_PREFSonly) -
tabname- Set table name (SET_TAB_PREFSonly) -
pname- Set parameter name -
pvalue- Set parameter value -
add_sys- Include system tables (optional,SET_DATABASE_PREFSonly)
The following example specifies that 13% of rows in
sh.salesmust change before the statistics on that table are considered stale:EXEC DBMS_STATS.SET_TABLE_PREFS('SH', 'SALES', 'STALE_PERCENT', '13'); -
-
Optionally, query the
*_TAB_STAT_PREFSview to confirm the change.For example, query
DBA_TAB_STAT_PREFSas follows:COL OWNER FORMAT a5 COL TABLE_NAME FORMAT a15 COL PREFERENCE_NAME FORMAT a20 COL PREFERENCE_VALUE FORMAT a30 SELECT * FROM DBA_TAB_STAT_PREFS;
Sample output appears as follows:
OWNER TABLE_NAME      PREFERENCE_NAME      PREFERENCE_VALUE
----- --------------- -------------------- ------------------------------
OE    CUSTOMERS       NO_INVALIDATE        DBMS_STATS.AUTO_INVALIDATE
SH    SALES           STALE_PERCENT        13
See Also:
Oracle Database PL/SQL Packages and Types Reference for descriptions of the parameter names and values for program units12.4 Gathering Optimizer Statistics Manually
As an alternative or supplement to automatic statistics gathering, you can use the DBMS_STATS package to gather statistics manually.
This section contains the following topics:
See Also:
-
Oracle Database PL/SQL Packages and Types Reference to learn about the
DBMS_STATSpackages
12.4.1 About Manual Statistics Collection with DBMS_STATS
Use the DBMS_STATS package to manipulate optimizer statistics. You can gather statistics on objects and columns at various levels of granularity: object, schema, and database. You can also gather statistics for the physical system, as explained in "Gathering System Statistics Manually".
Table 12-3 summarizes the DBMS_STATS procedures for gathering optimizer statistics. This package does not gather statistics for table clusters. However, you can gather statistics on individual tables in a table cluster.
Table 12-3 DBMS_STATS Procedures for Gathering Optimizer Statistics
| Procedure | Purpose |
|---|---|
|
|
Collects index statistics |
|
|
Collects table, column, and index statistics |
|
|
Collects statistics for all objects in a schema |
|
|
Collects statistics for all system schemas, including |
|
|
Collects statistics for all objects in a database |
When the OPTIONS parameter is set to GATHER STALE or GATHER AUTO, the GATHER_SCHEMA_STATS and GATHER_DATABASE_STATS procedures gather statistics for any table that has stale statistics and any table that is missing statistics. If a monitored table has been modified more than 10%, then the database considers these statistics stale and gathers them again.
Note:
As explained in "Controlling Automatic Optimizer Statistics Collection", you can configure a nightly job to gather statistics automatically.See Also:
Oracle Database PL/SQL Packages and Types Reference for complete syntax and semantics for theDBMS_STATS package12.4.2 Guidelines for Gathering Optimizer Statistics Manually
In most cases, automatic statistics collection is sufficient for database objects modified at a moderate speed. However, automatic collection may sometimes be inadequate or unavailable, as in the following cases:
-
You perform certain types of bulk load and cannot wait for the maintenance window to collect statistics because queries must be executed immediately. See "Online Statistics Gathering for Bulk Loads".
-
During a nonrepresentative workload, automatic statistics collection gathers statistics for fixed tables. See "Gathering Statistics for Fixed Objects".
-
Automatic statistics collection does not gather system statistics. See "Gathering System Statistics Manually".
-
Volatile tables are being deleted or truncated, and then rebuilt during the day. See "Gathering Statistics for Volatile Tables Using Dynamic Statistics".
This section offers guidelines for typical situations in which you may choose to gather statistically manually:
12.4.2.1 Guideline for Accurate Statistics
In the context of optimizer statistics, sampling is the gathering of statistics from a random subset of table rows. By enabling the database to avoid full table scans and sorts of entire tables, sampling minimizes the resources necessary to gather statistics.
The database gathers the most accurate statistics when it processes all rows in the table, which is a 100% sample. However, the larger the sample size, the longer the statistics gathering operation. The problem is determining a sample size that provides accurate statistics in a reasonable time.
DBMS_STATS uses sampling when a user specifies the parameter ESTIMATE_PERCENT, which controls the percentage of the rows in the table to sample. To maximize performance gains while achieving necessary statistical accuracy, Oracle recommends that the ESTIMATE_PERCENT parameter be set to DBMS_STATS.AUTO_SAMPLE_SIZE (the default). With this setting, the database uses a hash-based algorithm that is much faster than sampling. This algorithm reads all rows and produces statistics that are nearly as accurate as statistics from a 100% sample. The statistics computed using this technique are deterministic.
12.4.2.2 Guideline for Gathering Statistics in Parallel
By default, the database gathers statistics with the parallelism degree specified at the table or index level. You can override this setting with the degree argument to the DBMS_STATS gathering procedures. Oracle recommends setting degree to DBMS_STATS.AUTO_DEGREE. This setting enables the database to choose an appropriate degree of parallelism based on the object size and the settings for the parallelism-related initialization parameters.
The database can gather most statistics serially or in parallel. However, the database does not gather some index statistics in parallel, including cluster indexes, domain indexes, and bitmap join indexes. The database can use sampling when gathering parallel statistics.
Note:
Do not confuse gathering statistics in parallel with gathering statistics concurrently. See "About Concurrent Statistics Gathering".12.4.2.3 Guideline for Partitioned Objects
For partitioned tables and indexes, DBMS_STATS can gather separate statistics for each partition and global statistics for the entire table or index. Similarly, for composite partitioning, DBMS_STATS can gather separate statistics for subpartitions, partitions, and the entire table or index.
Use the granularity argument to the DBMS_STATS procedures to determine the type of partitioning statistics to be gathered. Oracle recommends setting granularity to the default value of AUTO to gather subpartition, partition, or global statistics, depending on partition type. The ALL setting gathers statistics for all types.
12.4.2.4 Guideline for Frequently Changing Objects
When tables are frequently modified, gather statistics often enough so that they do not go stale, but not so often that collection overhead degrades performance. You may only need to gather new statistics every week or month. The best practice is to use a script or job scheduler to regularly run the DBMS_STATS.GATHER_SCHEMA_STATS and DBMS_STATS.GATHER_DATABASE_STATS procedures.
12.4.2.5 Guideline for External Tables
Because the database does not permit data manipulation against external tables, the database never marks statistics on external tables as stale. If new statistics are required for an external table, for example, because the underlying data files change, then regather the statistics. Gather statistics manually for external tables with the same procedures that you use for regular tables.
12.4.3 Determining When Optimizer Statistics Are Stale
Stale statistics on a table do not accurately reflect its data. The database provides a table monitoring facility to help determine when a database object needs new statistics. Monitoring tracks the approximate number of DML operations on a table and whether the table has been truncated since the most recent statistics collection.
Run DBMS_STATS.FLUSH_DATABASE_MONITORING_INFO to immediately reflect the outstanding monitored information stored in memory. After running this procedure, check whether statistics are stale by querying the STALE_STATS column in DBA_TAB_STATISTICS and DBA_IND_STATISTICS. This column is based on data in the DBA_TAB_MODIFICATIONS view and the STALE_PERCENT preference for DBMS_STATS. The STALE_STATS column has the following possible values:
-
YESThe statistics are stale.
-
NOThe statistics are not stale.
-
null
The statistics are not collected.
Executing GATHER_SCHEMA_STATS or GATHER_DATABASE_STATS with the GATHER AUTO option collects statistics only for objects with no statistics or stale statistics.
This tutorial assumes the following:
-
Table monitoring is enabled for
sh.sales. It is enabled by default when theSTATISTICS_LEVELinitialization parameter is set toTYPICALorALL. -
You have the
ANALYZE_ANYsystem privilege so you can run theDBMS_STATS.FLUSH_DATABASE_MONITORING_INFOprocedure.
To determine stale statistics:
-
Connect SQL*Plus to the database with the necessary privileges.
-
Optionally, write the database monitoring information from memory to disk.
For example, execute the following procedure:
BEGIN
  DBMS_STATS.FLUSH_DATABASE_MONITORING_INFO;
END;
/
-
Query the data dictionary for stale statistics.
The following example queries stale statistics for the
sh.salestable (partial output included):COL PARTITION_NAME FORMAT a15 SELECT PARTITION_NAME, STALE_STATS FROM DBA_TAB_STATISTICS WHERE TABLE_NAME = 'SALES' AND OWNER = 'SH' ORDER BY PARTITION_NAME; PARTITION_NAME STA --------------- --- SALES_1995 NO SALES_1996 NO SALES_H1_1997 NO SALES_H2_1997 NO SALES_Q1_1998 NO SALES_Q1_1999 NO . . .
See Also:
-
Oracle Database Reference to learn about the
DBA_TAB_MODIFICATIONSview -
Oracle Database PL/SQL Packages and Types Reference to learn about the
DBMS_STATS.FLUSH_DATABASE_MONITORING_INFOprocedure
12.4.4 Gathering Schema and Table Statistics
Use GATHER_TABLE_STATS to collect table statistics, and GATHER_SCHEMA_STATS to collect statistics for all objects in a schema.
To gather schema statistics using DBMS_STATS:
-
Start SQL*Plus, and connect to the database with the appropriate privileges for the procedure that you intend to run.
-
Run the
GATHER_TABLE_STATSorGATHER_SCHEMA_STATSprocedure, specifying the desired parameters.Typical parameters include:
-
Owner -
ownname -
Object name -
tabname,indname,partname -
Degree of parallelism -
degree
-
Example 12-1 Gathering Statistics for a Table
This example uses the DBMS_STATS package to gather statistics on the sh.customers table with a parallelism setting of 2.
BEGIN
  DBMS_STATS.GATHER_TABLE_STATS (
    ownname => 'sh'
,   tabname => 'customers'
,   degree  => 2
);
END;
/
See Also:
Oracle Database PL/SQL Packages and Types Reference to learn about theGATHER_TABLE_STATS procedure12.4.5 Gathering Statistics for Fixed Objects
Fixed objects are dynamic performance tables and their indexes. These objects record current database activity.
Unlike other database tables, the database does not automatically use dynamic statistics for SQL statement referencing X$ tables when optimizer statistics are missing. Instead, the optimizer uses predefined default values. These defaults may not be representative and could potentially lead to a suboptimal execution plan. Thus, it is important to keep fixed object statistics current.
Oracle Database automatically gathers fixed object statistics as part of automated statistics gathering if they have not been previously collected (see "Controlling Automatic Optimizer Statistics Collection"). You can also manually collect statistics on fixed objects by calling DBMS_STATS.GATHER_FIXED_OBJECTS_STATS. Oracle recommends that you gather statistics when the database has representative activity.
You must have the SYSDBA or ANALYZE ANY DICTIONARY system privilege to execute this procedure.
To gather schema statistics using GATHER_FIXED_OBJECTS_STATS:
-
Start SQL*Plus, and connect to the database with the appropriate privileges for the procedure that you intend to run.
-
Run the
DBMS_STATS.GATHER_FIXED_OBJECTS_STATSprocedure, specifying the desired parameters.Typical parameters include:
-
Table identifier describing where to save the current statistics -
stattab -
Identifier to associate with these statistics within
stattab(optional) -statid -
Schema containing
stattab(if different from current schema) -statown
-
Example 12-2 Gathering Statistics for a Table
This example uses the DBMS_STATS package to gather fixed object statistics.
BEGIN
  DBMS_STATS.GATHER_FIXED_OBJECTS_STATS;
END;
/
See Also:
Oracle Database PL/SQL Packages and Types Reference to learn about theGATHER_TABLE_STATS procedure12.4.6 Gathering Statistics for Volatile Tables Using Dynamic Statistics
Statistics for volatile tables, which are tables modified significantly during the day, go stale quickly. For example, a table may be deleted or truncated, and then rebuilt.
When you set the statistics of a volatile object to null, Oracle Database dynamically gathers the necessary statistics during optimization using dynamic statistics. The OPTIMIZER_DYNAMIC_SAMPLING initialization parameter controls this feature.
Note:
As described in "Locking and Unlocking Optimizer Statistics," gathering representative statistics and them locking them is an alternative technique for preventing statistics for volatile tables from going stale.This tutorial assumes the following:
-
The
oe.orderstable is extremely volatile. -
You want to delete and then lock the statistics on the
orderstable to prevent the database from gathering statistics on the table. In this way, the database can dynamically gather necessary statistics as part of query optimization. -
The
oeuser has the necessary privileges to queryDBMS_XPLAN.DISPLAY_CURSOR.
To delete and the lock optimizer statistics:
-
Connect to the database as user
oe, and then delete the statistics for theoetable.For example, execute the following procedure:
BEGIN DBMS_STATS.DELETE_TABLE_STATS('OE','ORDERS'); END; / -
Lock the statistics for the
oetable.For example, execute the following procedure:
BEGIN DBMS_STATS.LOCK_TABLE_STATS('OE','ORDERS'); END; / -
You query the
orderstable.For example, use the following statement:
SELECT COUNT(order_id) FROM orders;
-
You query the plan in the cursor.
You run the following commands (partial output included):
SET LINESIZE 150
SET PAGESIZE 0

SELECT * FROM TABLE(DBMS_XPLAN.DISPLAY_CURSOR);

SQL_ID  aut9632fr3358, child number 0
-------------------------------------
SELECT COUNT(order_id) FROM orders

Plan hash value: 425895392

---------------------------------------------------------------------
| Id  | Operation          | Name   | Rows  | Cost (%CPU)| Time     |
---------------------------------------------------------------------
|   0 | SELECT STATEMENT   |        |       |     2 (100)|          |
|   1 |  SORT AGGREGATE    |        |     1 |            |          |
|   2 |   TABLE ACCESS FULL| ORDERS |   105 |     2   (0)| 00:00:01 |
---------------------------------------------------------------------

Note
-----
   - dynamic statistics used for this statement (level=2)
The Note in the preceding execution plan shows that the database used dynamic statistics for the
SELECTstatement.
See Also:
"Controlling Dynamic Statistics"12.4.7 Gathering Optimizer Statistics Concurrently
Oracle Database enables you to gather statistics on multiple tables or partitions concurrently. This section contains the following topics:
12.4.7.1 About Concurrent Statistics Gathering
When concurrent statistics gathering mode is enabled, the database can simultaneously gather optimizer statistics for the following:
-
Multiple tables in a schema
-
Multiple partitions or subpartitions in a table
Concurrency can reduce the overall time required to gather statistics by enabling the database to fully use multiple CPUs.
Note:
Concurrent statistics gathering mode does not rely on parallel query processing, but is usable with it.12.4.7.1.1 How DBMS_STATS Gathers Statistics Concurrently
Oracle Database employs the following tools and technologies to create and manage multiple statistics gathering jobs concurrently:
-
Oracle Scheduler
-
Oracle Database Advanced Queuing (AQ)
-
Oracle Database Resource Manager (the Resource Manager)
Enable concurrent statistics gathering by setting the CONCURRENT preference with DBMS_STATS.SET_GLOBAL_PREF (see "Enabling Concurrent Statistics Gathering").
The database runs as many concurrent jobs as possible. The Job Scheduler decides how many jobs to execute concurrently and how many to queue. As running jobs complete, the scheduler dequeues and runs more jobs until the database has gathered statistics on all tables, partitions, and subpartitions. The maximum number of jobs is bounded by the JOB_QUEUE_PROCESSES initialization parameter and available system resources.
In most cases, the DBMS_STATS procedures create a separate job for each table partition or subpartition. However, if the partition or subpartition is very small or empty, the database may automatically batch the object with other small objects into a single job to reduce the overhead of job maintenance.
The following figure illustrates the creation of jobs at different levels, where Table 3 is a partitioned table, and the other tables are nonpartitioned. Job 3 acts as a coordinator job for Table 3, and creates a job for each partition in that table, and a separate job for the global statistics of Table 3. This example assumes that incremental statistics gathering is disabled; if enabled, then the database derives global statistics from partition-level statistics after jobs for partitions complete.
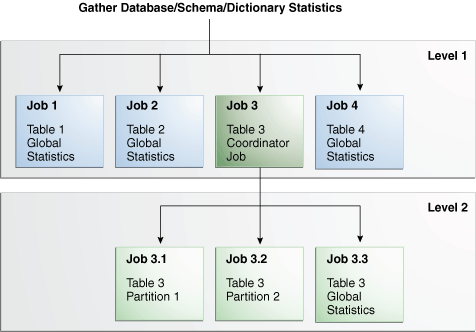
Description of the illustration tgsql_vm_036.png
See Also:
-
Oracle Database PL/SQL Packages and Types Reference to learn about the
DBMS_STATSpackage -
Oracle Database Reference to learn about the
JOB_QUEUE_PROCESSESinitialization parameter
12.4.7.1.2 Concurrent Statistics Gathering and Resource Management
The DBMS_STATS package does not explicitly manage resources used by concurrent statistics gathering jobs that are part of a user-initiated statistics gathering call. Thus, the database may use system resources fully during concurrent statistics gathering. To address this situation, use the Resource Manager to cap resources consumed by concurrent statistics gathering jobs. The Resource Manager must be enabled to gather statistics concurrently.
The system-supplied consumer group ORA$AUTOTASK registers all statistics gathering jobs. You can create a resource plan with proper resource allocations for ORA$AUTOTASK to prevent concurrent statistics gathering from consuming all available resources. If you lack your own resource plan, and if choose not to create one, then consider activating the Resource Manager with the system-supplied DEFAULT_PLAN.
Note:
TheORA$AUTOTASK consumer group is shared with the maintenance tasks that automatically run during the maintenance windows. Thus, when concurrency is activated for automatic statistics gathering, the database automatically manages resources, with no extra steps required.See Also:
Oracle Database Administrator's Guide to learn about the Resource Manager12.4.7.2 Enabling Concurrent Statistics Gathering
To enable concurrent statistics gathering, use the DBMS_STATS.SET_GLOBAL_PREFS procedure to set the CONCURRENT preference. Possible values are as follows:
-
MANUALConcurrency is enabled only for manual statistics gathering.
-
AUTOMATICConcurrency is enabled only for automatic statistics gathering.
-
ALLConcurrency is enabled for both manual and automatic statistics gathering.
-
OFFConcurrency is disabled for both manual and automatic statistics gathering. This is the default value.
This tutorial in this section explains how to enable concurrent statistics gathering.
This tutorial has the following prerequisites:
-
In addition to the standard privileges for gathering statistics, you must have the following privileges:
-
CREATE JOB -
MANAGE SCHEDULER -
MANAGE ANY QUEUE
-
-
The
SYSAUXtablespace must be online because the scheduler stores its internal tables and views in this tablespace. -
The
JOB_QUEUE_PROCESSESinitialization parameter must be set to at least4. -
The Resource Manager must be enabled.
By default, the Resource Manager is disabled. If you do not have a resource plan, then consider enabling the Resource Manager with the system-supplied
DEFAULT_PLAN(see Oracle Database Administrator's Guide).
This tutorial assumes that you want to do the following:
-
Enable concurrent statistics gathering
-
Gather statistics for the
shschema -
Monitor the gathering of the
shstatistics
To enable concurrent statistics gathering:
-
Connect SQL*Plus to the database with the appropriate privileges, and then enable the Resource Manager.
The following example uses the default plan for the Resource Manager:
ALTER SYSTEM SET RESOURCE_MANAGER_PLAN = 'DEFAULT_PLAN';
-
Set the
JOB_QUEUE_PROCESSESinitialization parameter to at least twice the number of CPU cores.In Oracle Real Application Clusters, the
JOB_QUEUE_PROCESSESsetting applies to each node.Assume that the system has 4 CPU cores. The following example sets the parameter to
8(twice the number of cores):ALTER SYSTEM SET JOB_QUEUE_PROCESSES=8;
-
Confirm that the parameter change took effect.
For example, enter the following command in SQL*Plus (sample output included):
SHOW PARAMETER PROCESSES;

NAME                                 TYPE        VALUE
------------------------------------ ----------- ------------------------------
_high_priority_processes             string      VKTM
aq_tm_processes                      integer     1
db_writer_processes                  integer     1
gcs_server_processes                 integer     0
global_txn_processes                 integer     1
job_queue_processes                  integer     8
log_archive_max_processes            integer     4
processes                            integer     100
-
Enable concurrent statistics.
For example, execute the following PL/SQL anonymous block:
BEGIN DBMS_STATS.SET_GLOBAL_PREFS('CONCURRENT','ALL'); END; / -
Confirm that the statistics were enabled.
For example, execute the following query (sample output included):
SELECT DBMS_STATS.GET_PREFS('CONCURRENT') FROM DUAL; DBMS_STATS.GET_PREFS('CONCURRENT') ------------------------------------------------------------------------------- ALL -
Gather the statistics for the
SHschema.For example, execute the following procedure:
EXEC DBMS_STATS.GATHER_SCHEMA_STATS('SH'); -
In a separate session, monitor the job progress by querying
DBA_OPTSTAT_OPERATION_TASKS.For example, execute the following query (sample output included):
SET LINESIZE 1000 COLUMN TARGET FORMAT a17 COLUMN TARGET_TYPE FORMAT a25 COLUMN JOB_NAME FORMAT a14 COLUMN START_TIME FORMAT a40 SELECT TARGET, TARGET_TYPE, JOB_NAME, TO_CHAR(START_TIME, 'dd-mon-yyyy hh24:mi:ss') FROM DBA_OPTSTAT_OPERATION_TASKS WHERE STATUS = 'IN PROGRESS' AND OPID = (SELECT MAX(ID) FROM DBA_OPTSTAT_OPERATIONS WHERE OPERATION = 'gather_schema_stats'); TARGET TARGET_TYPE JOB_NAME TO_CHAR(START_TIME,' ----------------- ------------------------- -------------- -------------------- SH.SALES TABLE (GLOBAL STATS ONLY) ST$T292_1_B29 30-nov-2012 14:22:47 SH.SALES TABLE (COORDINATOR JOB) ST$SD290_1_B10 30-nov-2012 14:22:08 -
In the original session, disable concurrent statistics gathering.
For example, execute the following query:
EXEC DBMS_STATS.SET_GLOBAL_PREFS('CONCURRENT','OFF');
See Also:
-
Oracle Database PL/SQL Packages and Types Reference to learn how to use the
DBMS_STATS.SET_GLOBAL_PREFSprocedure
12.4.7.3 Configuring the System for Parallel Execution and Concurrent Statistics Gathering
When CONCURRENT statistics gathering is enabled, you can execute each statistics gathering job in parallel. This combination is useful when you are analyzing large tables, partitions, or subpartitions.
The following procedure describes the recommended configuration.
To configure the system for parallel execution and concurrent statistics gathering:
-
Connect SQL*Plus to the database with the administrator privileges.
-
Disable the parallel adaptive multiuser initialization parameter.
For example, use the following SQL statement:
ALTER SYSTEM SET PARALLEL_ADAPTIVE_MULTI_USER=false;
-
Enable parallel statement queuing.
Perform the following steps:
-
If Oracle Database Resource Manager (the Resource Manager) is not activated, then activate it. By default, the Resource Manager is activated only during the maintenance windows.
-
Create a temporary resource plan in which the consumer group
OTHER_GROUPShas queuing enabled.
The following sample script illustrates one way to create a temporary resource plan (
pqq_test), and enable the Resource Manager with this plan:-- connect as a user with dba privileges BEGIN DBMS_RESOURCE_MANAGER.CREATE_PENDING_AREA(); DBMS_RESOURCE_MANAGER.CREATE_PLAN('pqq_test', 'pqq_test'); DBMS_RESOURCE_MANAGER.CREATE_PLAN_DIRECTIVE( 'pqq_test' , 'OTHER_GROUPS' , 'OTHER_GROUPS directive for pqq' , parallel_target_percentage => 90 , max_utilization_limit => 90 ); DBMS_RESOURCE_MANAGER.SUBMIT_PENDING_AREA(); END; / ALTER SYSTEM SET RESOURCE_MANAGER_PLAN = 'pqq_test' SID='*'; -
See Also:
-
Oracle Database Reference to learn about the
PARALLEL_ADAPTIVE_MULTI_USERinitialization parameter -
Oracle Database Administrator's Guide to learn how to manage resources with the Resource Manager
12.4.7.4 Monitoring Statistics Gathering Operations
To monitor statistics gathering jobs, use the following views:
-
This view contains the history of tasks that are performed or currently in progress as part of statistics gathering operations (recorded in
DBA_OPTSTAT_OPERATIONS). Each task represents a target object to be processed in the corresponding parent operation. -
This view contains a history of statistics operations performed or currently in progress at the table, schema, and database level using the
DBMS_STATSpackage.
The TARGET column in the preceding views shows the target object for that statistics gathering job in the following form:
OWNER.TABLE_NAME.PARTITION_OR_SUBPARTITION_NAME
All statistics gathering job names start with the string ST$.
To display currently running statistics tasks and jobs:
-
To list statistics gathering currently running tasks from all user sessions, use the following SQL statement (sample output included):
SELECT OPID, TARGET, JOB_NAnME,
       (SYSTIMESTAMP - START_TIME) AS elapsed_time
FROM   DBA_OPTSTAT_OPERATION_TASKS
WHERE  STATUS = 'IN PROGRESS';

OPID TARGET                    JOB_NAME      ELAPSED_TIME
---- ------------------------- ------------- --------------------------
 981 SH.SALES.SALES_Q4_1998    ST$T82_1_B29  +000000000 00:00:00.596321
 981 SH.SALES                  ST$SD80_1_B10 +000000000 00:00:27.972033
To display completed statistics tasks and jobs:
-
To list only completed tasks and jobs from a particular operation, first identify the operation ID from the
DBA_OPTSTAT_OPERATIONSview based on the statistics gathering operation name, target, and start time. After you identify the operation ID, you can query theDBA_OPTSTAT_OPERATION_TASKSview to find the corresponding tasks in that operationFor example, to list operations with the ID 981, use the following commands in SQL*Plus (sample output included):
VARIABLE id NUMBER
EXEC :id := 985

SELECT TARGET, JOB_NAME, (END_TIME - START_TIME) AS ELAPSED_TIME
FROM   DBA_OPTSTAT_OPERATION_TASKS
WHERE  STATUS <> 'IN PROGRESS'
AND    OPID = :id;

TARGET                    JOB_NAME      ELAPSED_TIME
------------------------- ------------- --------------------------
SH.SALES_TRANSACTIONS_EXT               +000000000 00:00:45.479233
SH.CAL_MONTH_SALES_MV     ST$SD88_1_B10 +000000000 00:00:45.382764
SH.CHANNELS               ST$SD88_1_B10 +000000000 00:00:45.307397
To display statistics gathering tasks and jobs that have failed:
-
Use the following SQL statement (partial sample output included):
SET LONG 10000

SELECT TARGET, JOB_NAME,
       (END_TIME - START_TIME) AS ELAPSED_TIME, NOTES
FROM   DBA_OPTSTAT_OPERATION_TASKS
WHERE  STATUS = 'FAILED';

TARGET             JOB_NAME ELAPSED_TIME               NOTES
------------------ -------- -------------------------- ----------------------
SYS.OPATCH_XML_INV          +000000007 02:36:31.130314 <error>ORA-20011:
                                                       Approximate NDV failed:
                                                       ORA-29913: error in
.
.
.
12.4.8 Gathering Incremental Statistics on Partitioned Objects
Incremental statistics scan only changed partitions. Starting in Oracle Database 11g, incremental statistics maintenance improves the performance of gathering statistics on large partitioned table by deriving global statistics from partition-level statistics.
This section contains the following topics:
-
How Incremental Statistics Maintenance Derives Global Statistics
-
Maintaining Incremental Statistics for Partition Maintenance Operations
-
Maintaining Incremental Statistics for Tables with Stale or Locked Partition Statistics
12.4.8.1 Purpose of Incremental Statistics
In a typical case, an application loads data into a new partition of a range-partitioned table. As applications add new partitions and load data, the database must gather statistics on the new partition and keep global statistics up to date.
Without incremental statistics, statistics collection typically uses a two-pass approach:
-
The database scans the table to gather the global statistics.
-
The database scans the changed partitions to gather their partition-level statistics.
The full scan of the table for global statistics collection can be very expensive, depending on the size of the table. As the table adds partitions, the longer the execution time for GATHER_TABLE_STATS because of the full table scan required for the global statistics. The database must perform the scan of the entire table even if only a small subset of partitions change. In contrast, incremental statistics enable the database to avoid these full table scans.
12.4.8.2 How Incremental Statistics Maintenance Derives Global Statistics
Starting in Oracle Database 11g, the database avoids a full table scan when computing global statistics by deriving global statistics from the partition statistics. The database can accurately derive some statistics from partition statistics. For example, the number of rows at the global level is the sum of number of rows of partitions. Even global histograms can be derived from partition histograms.
However, the database cannot derive all statistics from partition-level statistics. For example, the database cannot derive the NDV of a column from partition-level NDVs. So, the database maintains a structure called a synopsis for each column at the partition level. A synopsis can be viewed as a sample of distinct values. The database can accurately derive the NDV for each column by merging partition-level synopses.
When incremental statistics maintenance is enabled, the database does the following:
-
Gathers statistics and creates synopses for changed partitions only
-
Merges partition-level synopses into a global synopsis automatically
-
Derives global statistics automatically from the partition-level statistics and global synopses
Example 12-3 Deriving Global Statistics
The following graphic shows how the database gathers statistics for the initial six partitions of the sales table, and then creates synopses for each partition (S1, S2, and so on). The database creates global statistics by aggregating the partition-level statistics and synopses.
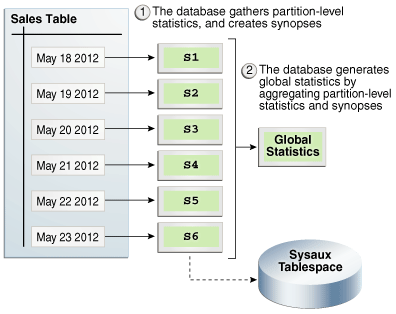
Description of the illustration tgsql_vm_074.png
The following graphic shows a new partition, containing data for May 24, being added to the sales table. The database gathers statistics for the newly added partition, retrieves synopses for the other partitions, and then aggregates the synopses to create global statistics.
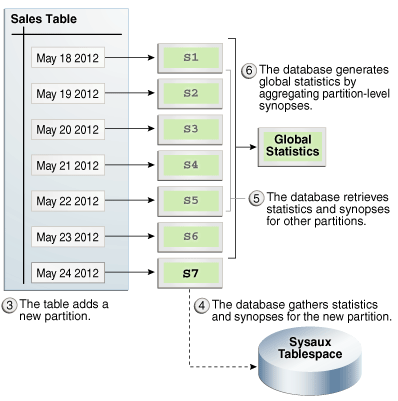
Description of the illustration tgsql_vm_075.png
12.4.8.3 How to Enable Incremental Statistics Maintenance
Use DBMS_STATS.SET_TABLE_PREFS to set the INCREMENTAL value, and in this way control incremental statistics maintenance. When INCREMENTAL is set to false (default), the database always uses a full table scan to maintain global statistics. When the following criteria are met, the database updates global statistics incrementally by scanning only the partitions that have changed:
-
The
INCREMENTALvalue for the partitioned table istrue. -
The
PUBLISHvalue for the partitioned table istrue. -
The user specifies
AUTO_SAMPLE_SIZEforESTIMATE_PERCENTandAUTOforGRANULARITYwhen gathering statistics on the table.
Enabling incremental statistics maintenance has the following consequences:
-
The
SYSAUXtablespace consumes additional space to maintain global statistics for partitioned tables. -
If a table uses composite partitioning, then the database only gathers statistics for modified subpartitions. The database does not gather statistics at the subpartition level for unmodified subpartitions. In this way, the database reduces work by skipping unmodified partitions.
-
If a table uses incremental statistics, and if this table has a locally partitioned index, then the database gathers index statistics at the global level and for modified (not unmodified) index partitions. The database does not generate global index statistics from the partition-level index statistics. Rather, the database gathers global index statistics by performing a full index scan.
12.4.8.4 Maintaining Incremental Statistics for Partition Maintenance Operations
A partition maintenance operation is a partition-related operation such as adding, exchanging, merging, or splitting table partitions. Oracle Database 12c introduces the following enhancements for maintaining incremental statistics:
-
If a partition maintenance operation triggers statistics gathering, then the database can reuse synopses that would previously have been dropped with the old segments.
-
DBMS_STATScan create a synopsis on a nonpartitioned table. The synopsis enables the database to maintain incremental statistics as part of a partition exchange operation without having to explicitly gather statistics on the partition after the exchange.
When the DBMS_STATS preference INCREMENTAL is set to true on a table, the INCREMENTAL_LEVEL preference controls which synopses are collected and when. This preference takes the following values:
-
TABLEDBMS_STATSgathers table-level synopses on this table. You can only setINCREMENTAL_LEVELtoTABLEat the table level, not at the schema, database, or global level. -
PARTITION(default)DBMS_STATSonly gathers synopsis at the partition level of partitioned tables.
When performing a partition exchange, to have synopses after the exchange for the partition being exchanged, set INCREMENTAL to true and INCREMENTAL_LEVEL to TABLE on the table to be exchanged with the partition.
This tutorial assumes the following:
-
You want to load empty partition
p_sales_01_2010in asalestable. -
You create a staging table
t_sales_01_2010, and then populate the table. -
You want the database to maintain incremental statistics as part of the partition exchange operation without having to explicitly gather statistics on the partition after the exchange.
To maintain incremental statistics as part of a partition exchange operation:
-
Set incremental statistics preferences for staging table
t_sales_01_2010.For example, run the following statement:
BEGIN DBMS_STATS.SET_TABLE_PREFS ( 'sh' , 't_sales_01_2010' , 'INCREMENTAL' , 'true' ); DBMS_STATS.SET_TABLE_PREFS ( 'sh' , 't_sales_01_2010' , 'INCREMENTAL_LEVEL' , 'table' ); END; -
Gather statistics on staging table
t_sales_01_2010.For example, run the following PL/SQL code:
BEGIN DBMS_STATS.GATHER_TABLE_STATS ( ownname => 'SH' , tabname => 'T_SALES_01_2010' ); END; /DBMS_STATSgathers table-level synopses ont_sales_01_2010. -
Ensure that the
INCREMENTALpreference istrueon thesh.salestable.For example, run the following PL/SQL code:
BEGIN DBMS_STATS.SET_TABLE_PREFS ( 'sh' , 'sales' , 'INCREMENTAL' , 'true' ); END; / -
If you have never gathered statistics on
sh.salesbefore withINCREMENTALset totrue, then gather statistics on the partition to be exchanged.For example, run the following PL/SQL code:
BEGIN DBMS_STATS.GATHER_TABLE_STATS ( 'sh' , 'sales' , 'p_sales_01_2010' , granularity=>'partition' ); END; / -
Perform the partition exchange.
For example, use the following SQL statement:
ALTER TABLE sales EXCHANGE PARTITION p_sales_01_2010 WITH TABLE t_sales_01_2010
After the exchange, the partitioned table has both statistics and a synopsis for partition
p_sales_01_2010.In releases before Oracle Database 12c, the preceding statement swapped the segment data and statistics of
p_sales_01_2010witht_sales_01_2010. The database did not maintain synopses for nonpartitioned tables such ast_sales_01_2010. To gather global statistics on the partitioned table, you needed to rescan thep_sales_01_2010partition to obtain its synopses.
See Also:
Oracle Database PL/SQL Packages and Types Reference to learn more aboutDBMS_STATS.SET_TABLE_PREFS12.4.8.5 Maintaining Incremental Statistics for Tables with Stale or Locked Partition Statistics
Starting in Oracle Database 12c, incremental statistics can automatically calculate global statistics for a partitioned table even if the partition or subpartition statistics are stale and locked.
When incremental statistics are enabled in releases before Oracle Database 12c, if any DML occurs on a partition, then the optimizer considers statistics on this partition to be stale. Thus, DBMS_STATS must gather the statistics again to accurately aggregate the global statistics. Furthermore, if DML occurs on a partition whose statistics are locked, then DBMS_STATS cannot regather the statistics on the partition, so a full table scan is the only means of gathering global statistics. The necessity to regather statistics creates performance overhead.
In Oracle Database 12c, the statistics preference INCREMENTAL_STALENESS controls how the database determines whether the statistics on a partition or subpartition are stale. This preference takes the following values:
-
USE_STALE_PERCENTA partition or subpartition is not considered stale if DML changes are less than the
STALE_PERCENTpreference specified for the table. The default value ofSTALE_PERCENTis10, which means that if DML causes more than 10% of row changes, then the table is considered stale. -
USE_LOCKED_STATSLocked partition or subpartition statistics are not considered stale, regardless of DML changes.
-
NULL(default)A partition or subpartition is considered stale if it has any DML changes. This behavior is identical to the Oracle Database 11g behavior. When the default value is used, statistics gathered in incremental mode are guaranteed to be the same as statistics gathered in nonincremental mode. When a nondefault value is used, statistics gathered in incremental mode might be less accurate than those gathered in nonincremental mode.
You can specify USE_STALE_PERCENT and USE_LOCKED_STATS together. For example, you can write the following anonymous block:
BEGIN
  DBMS_STATS.SET_TABLE_PREFS (
    null
,   't'
,   'incremental_staleness'
,   'use_stale_percent, use_locked_stats'
);
END;
This tutorial assumes the following:
-
The
STALE_PERCENTfor a partitioned table is set to10. -
The
INCREMENTALvalue is set totrue. -
The table has had statistics gathered in
INCREMENTALmode before. -
You want to discover how statistics gathering changes depending on the setting for
INCREMENTAL_STALENESS, whether the statistics are locked, and the percentage of DML changes.
To test for tables with stale or locked partition statistics:
-
Set
INCREMENTAL_STALENESStoNULL.Afterward, 5% of the rows in one partition change because of DML activity.
-
Use
DBMS_STATSto gather statistics on the table.DBMS_STATSregathers statistics for the partition that had the 5% DML activity, and incrementally maintains the global statistics. -
Set
INCREMENTAL_STALENESStoUSE_STALE_PERCENT.Afterward, 5% of the rows in one partition change because of DML activity.
-
Use
DBMS_STATSto gather statistics on the table.DBMS_STATSdoes not regather statistics for the partition that had DML activity (because the changes are under the staleness threshold of 10%), and incrementally maintains the global statistics. -
Lock the partition statistics.
Afterward, 20% of the rows in one partition change because of DML activity.
-
Use
DBMS_STATSto gather statistics on the table.DBMS_STATSdoes not regather statistics for the partition because the statistics are locked. The database gathers the global statistics with a full table scan.Afterward, 5% of the rows in one partition change because of DML activity.
-
Use
DBMS_STATSto gather statistics on the table.When you gather statistics on this table,
DBMS_STATSdoes not regather statistics for the partition because they are not considered stale. The database maintains global statistics incrementally using the existing statistics for this partition. -
Set
INCREMENTAL_STALENESStoUSE_LOCKED_STATSandUSE_STALE_PERCENT.Afterward, 20% of the rows in one partition change because of DML activity.
-
Use
DBMS_STATSto gather statistics on the table.Because
USE_LOCKED_STATSis set,DBMS_STATSignores the fact that the statistics are stale and uses the locked statistics. The database maintains global statistics incrementally using the existing statistics for this partition.
See Also:
Oracle Database PL/SQL Packages and Types Reference to learn more aboutDBMS_STATS.SET_TABLE_PREFS12.5 Gathering System Statistics Manually
System statistics describe the system's hardware characteristics, such as I/O and CPU performance and utilization, to the optimizer. System statistics enable the optimizer to choose a more efficient execution plan. Oracle recommends that you gather system statistics when a physical change occurs in the environment, for example, the server has faster CPUs, more memory, or different disk storage.
12.5.1 About Gathering System Statistics with DBMS_STATS
To gather system statistics, use DBMS_STATS.GATHER_SYSTEM_STATS. When the database gathers system statistics, it analyzes activity in a specified time period (workload statistics) or simulates a workload (noworkload statistics). The input arguments to DBMS_STATS.GATHER_SYSTEM_STATS are:
-
NOWORKLOADThe optimizer gathers statistics based on system characteristics only, without regard to the workload.
-
INTERVALAfter the specified number of minutes has passed, the optimizer updates system statistics either in the data dictionary, or in an alternative table (specified by
stattab). Statistics are based on system activity during the specified interval. -
STARTandSTOPSTARTinitiates gathering statistics.STOPcalculates statistics for the elapsed period (sinceSTART) and refreshes the data dictionary or an alternative table (specified bystattab). The optimizer ignoresINTERVAL. -
EXADATAThe system statistics consider the unique capabilities provided by using Exadata, such as large I/O size and high I/O throughput. The optimizer sets the multiblock read count and I/O throughput statistics along with CPU speed.
Table 12-4 lists the optimizer system statistics gathered by DBMS_STATS and the options for gathering or manually setting specific system statistics.
Table 12-4 Optimizer System Statistics in the DBMS_STAT Package
| Parameter Name | Description | Initialization | Options for Gathering or Setting Statistics | Unit |
|---|---|---|---|---|
|
|
Represents noworkload CPU speed. CPU speed is the average number of CPU cycles in each second. |
At system startup |
Set |
Millions/sec. |
|
|
Represents the time it takes to position the disk head to read data. I/O seek time equals seek time + latency time + operating system overhead time. |
At system startup 10 (default) |
Set |
ms |
|
|
Represents the rate at which an Oracle database can read data in the single read request. |
At system startup 4096 (default) |
Set |
Bytes/ms |
|
|
Represents workload CPU speed. CPU speed is the average number of CPU cycles in each second. |
None |
Set |
Millions/sec. |
|
|
Maximum I/O throughput is the maximum throughput that the I/O subsystem can deliver. |
None |
Set |
Bytes/sec. |
|
|
Slave I/O throughput is the average parallel execution server I/O throughput. |
None |
Set |
Bytes/sec. |
|
|
Single-block read time is the average time to read a single block randomly. |
None |
Set |
ms |
|
|
Multiblock read is the average time to read a multiblock sequentially. |
None |
Set |
ms |
|
|
Multiblock count is the average multiblock read count sequentially. |
None |
Set |
blocks |
See Also:
Oracle Database PL/SQL Packages and Types Reference for detailed information on the procedures in theDBMS_STATS package for implementing system statistics12.5.2 Guidelines for Gathering System Statistics
The database automatically gathers essential parts of system statistics at startup. CPU and I/O characteristics tend to remain constant over time. Typically, these characteristics only change when some aspect of the configuration is upgraded. For this reason, Oracle recommends that you gather system statistics only when a physical change occurs in your environment, for example, the server gets faster CPUs, more memory, or different disk storage.
Note the following guidelines:
-
Oracle Database initializes noworkload statistics to default values at the first instance startup. Oracle recommends that you gather noworkload statistics after you create new tablespaces on storage that is not used by any other tablespace.
-
The best practice is to capture statistics in the interval of time when the system has the most common workload. Gathering workload statistics does not generate additional overhead.
12.5.3 Gathering Workload Statistics
Use DBMS_STATS.GATHER_SYSTEM_STATS to capture statistics when the database has the most typical workload. For example, database applications can process OLTP transactions during the day and generate OLAP reports at night.
12.5.3.1 About Workload Statistics
Workload statistics include the following statistics listed in Table 12-4:
-
Single block (
sreadtim) and multiblock (mreadtim) read times -
Multiblock count (
mbrc) -
CPU speed (
cpuspeed) -
Maximum system throughput (
maxthr) -
Average parallel execution throughput (
slavethr)
The database computes sreadtim, mreadtim, and mbrc by comparing the number of physical sequential and random reads between two points in time from the beginning to the end of a workload. The database implements these values through counters that change when the buffer cache completes synchronous read requests.
Because the counters are in the buffer cache, they include not only I/O delays, but also waits related to latch contention and task switching. Thus, workload statistics depend on system activity during the workload window. If system is I/O bound (both latch contention and I/O throughput), then the statistics promote a less I/O-intensive plan after the database uses the statistics.
As shown in Figure 12-1, if you gather workload statistics, then the optimizer uses the mbrc value gathered for workload statistics to estimate the cost of a full table scan.
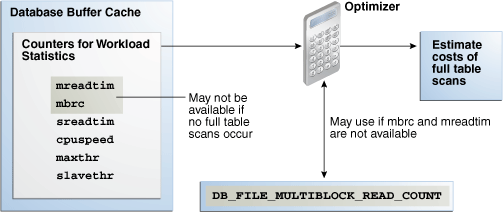
When gathering workload statistics, the database may not gather the mbrc and mreadtim values if no table scans occur during serial workloads, as is typical of OLTP systems. However, full table scans occur frequently on DSS systems. These scans may run parallel and bypass the buffer cache. In such cases, the database still gathers the sreadtim because index lookups use the buffer cache.
If the database cannot gather or validate gathered mbrc or mreadtim values, but has gathered sreadtim and cpuspeed, then the database uses only sreadtim and cpuspeed for costing. In this case, the optimizer uses the value of the initialization parameter DB_FILE_MULTIBLOCK_READ_COUNT to cost a full table scan. However, if DB_FILE_MULTIBLOCK_READ_COUNT is 0 or is not set, then the optimizer uses a value of 8 for calculating cost.
Use the DBMS_STATS.GATHER_SYSTEM_STATS procedure to gather workload statistics. The GATHER_SYSTEM_STATS procedure refreshes the data dictionary or a staging table with statistics for the elapsed period. To set the duration of the collection, use either of the following techniques:
-
Specify
STARTthe beginning of the workload window, and thenSTOPat the end of the workload window. -
Specify
INTERVALand the number of minutes before statistics gathering automatically stops. If needed, you can useGATHER_SYSTEM_STATS (gathering_mode=>'STOP')to end gathering earlier than scheduled.
See Also:
Oracle Database PL/SQL Packages and Types Reference to learn about the initialization parameterDB_FILE_MULTIBLOCK_READ_COUNT12.5.3.2 Using GATHER_SYSTEM_STATS with START and STOP
This tutorial explains how to set the workload interval with the START and STOP parameters of GATHER_SYSTEM_STATS.
This tutorial assumes the following:
-
The hour between 10 a.m. and 11 a.m. is representative of the daily workload.
-
You intend to collect system statistics directly in the data dictionary.
To gather workload statistics using START and STOP:
-
Start SQL*Plus and connect to the database with administrator privileges.
-
Start statistics collection.
For example, at 10 a.m., execute the following procedure to start collection:
EXECUTE DBMS_STATS.GATHER_SYSTEM_STATS( gathering_mode => 'START' );
-
Generate the workload.
-
End statistics collection.
For example, at 11 a.m., execute the following procedure to end collection:
EXECUTE DBMS_STATS.GATHER_SYSTEM_STATS( gathering_mode => 'STOP' );
The optimizer can now use the workload statistics to generate execution plans that are effective during the normal daily workload.
-
Optionally, query the system statistics.
For example, run the following query:
COL PNAME FORMAT a15
SELECT PNAME, PVAL1
FROM   SYS.AUX_STATS$
WHERE  SNAME = 'SYSSTATS_MAIN';
See Also:
Oracle Database PL/SQL Packages and Types Reference to learn about theDBMS_STATS.GATHER_SYSTEM_STATS procedure12.5.3.3 Using GATHER_SYSTEM_STATS with INTERVAL
This tutorial explains how to set the workload interval with the INTERVAL parameter of GATHER_SYSTEM_STATS.
This tutorial assumes the following:
-
The database application processes OLTP transactions during the day and runs OLAP reports at night. To gather representative statistics, you collect them during the day for two hours and then at night for two hours.
-
You want to store statistics in a table named
workload_stats. -
You intend to switch between the statistics gathered.
To gather workload statistics using INTERVAL:
-
Start SQL*Plus and connect to the production database as administrator
dba1. -
Create a table to hold the production statistics.
For example, execute the following PL/SQL program to create user statistics table
workload_stats:BEGIN DBMS_STATS.CREATE_STAT_TABLE ( ownname => 'dba1' , stattab => 'workload_stats' ); END; / -
Ensure that
JOB_QUEUE_PROCESSESis not0so thatDBMS_JOBjobs and Oracle Scheduler jobs run.ALTER SYSTEM SET JOB_QUEUE_PROCESSES = 1;
-
Gather statistics during the day.
For example, gather statistics for two hours with the following program:
BEGIN DBMS_STATS.GATHER_SYSTEM_STATS ( interval => 120 , stattab => 'workload_stats' , statid => 'OLTP' ); END; / -
Gather statistics during the evening.
For example, gather statistics for two hours with the following program:
BEGIN DBMS_STATS.GATHER_SYSTEM_STATS ( interval => 120 , stattab => 'workload_stats' , statid => 'OLAP' ); END; / -
In the day or evening, import the appropriate statistics into the data dictionary.
For example, during the day you can import the OLTP statistics from the staging table into the dictionary with the following program:
BEGIN
  EXECUTE DBMS_STATS.IMPORT_SYSTEM_STATS (
    stattab => 'workload_stats'
,   statid  => 'OLTP'
);
END;
/
For example, during the night you can import the OLAP statistics from the staging table into the dictionary with the following program:
BEGIN
  EXECUTE DBMS_STATS.IMPORT_SYSTEM_STATS (
    stattab => 'workload_stats'
,   statid  => 'OLAP'
);
END;
/
See Also:
Oracle Database PL/SQL Packages and Types Reference to learn about theDBMS_STATS.GATHER_SYSTEM_STATS procedure12.5.4 Gathering Noworkload Statistics
Noworkload statistics capture characteristics of the I/O system. By default, Oracle Database uses noworkload statistics and the CPU cost model. The values of noworkload statistics are initialized to defaults at the first instance startup. You can also use the DBMS_STATS.GATHER_SYSTEM_STATS procedure to gather noworkload statistics manually.
Noworkload statistics include the following system statistics listed in Table 12-4:
-
I/O transfer speed (
iotfrspeed) -
I/O seek time (
ioseektim) -
CPU speed (
cpuspeednw)
The major difference between workload statistics and noworkload statistics is in the gathering method. Noworkload statistics gather data by submitting random reads against all data files, whereas workload statistics uses counters updated when database activity occurs. If you gather workload statistics, then Oracle Database uses them instead of noworkload statistics.
To gather noworkload statistics, run DBMS_STATS.GATHER_SYSTEM_STATS with no arguments or with the gathering mode set to noworkload. There is an overhead on the I/O system during the gathering process of noworkload statistics. The gathering process may take from a few seconds to several minutes, depending on I/O performance and database size.
When you gather noworkload statistics, the database analyzes the information and verifies it for consistency. In some cases, the values of noworkload statistics may retain their default values. You can either gather the statistics again, or use SET_SYSTEM_STATS to set the values manually to the I/O system specifications.
This tutorial assumes that you want to gather noworkload statistics manually.
To gather noworkload statistics manually:
-
Start SQL*Plus and connect to the database with administrator privileges.
-
Gather the noworkload statistics.
For example, run the following statement:
BEGIN DBMS_STATS.GATHER_SYSTEM_STATS ( gathering_mode => 'NOWORKLOAD' ); END; -
Optionally, query the system statistics.
For example, run the following query:
COL PNAME FORMAT a15

SELECT PNAME, PVAL1
FROM   SYS.AUX_STATS$
WHERE  SNAME = 'SYSSTATS_MAIN';
See Also:
Oracle Database PL/SQL Packages and Types Reference to learn about theDBMS_STATS.GATHER_SYSTEM_STATS procedure12.5.5 Deleting System Statistics
Use the DBMS_STATS.DELETE_SYSTEM_STATS function to delete system statistics. This procedure deletes workload statistics collected using the INTERVAL or START and STOP options, and then resets the default to noworkload statistics. However, if the stattab parameter specifies a table for storing statistics, then the subprogram deletes all system statistics with the associated statid from the statistics table.
This tutorial assumes the following:
-
You gathered statistics for a specific intensive workload, but no longer want the optimizer to use these statistics.
-
You stored workload statistics in the default location, not in a user-specified table.
To delete system statistics:
-
Start SQL*Plus and connect to the database as a user with administrative privileges.
-
Delete the system statistics.
For example, run the following statement:
EXEC DBMS_STATS.DELETE_SYSTEM_STATS;
See Also:
Oracle Database PL/SQL Packages and Types Reference to learn about theDBMS_STATS.DELETE_SYSTEM_STATS procedure