MySQL community server is a free open source, popular and cross-platform database management system. It supports both SQL and NoSQL, and has a pluggable storage engine architecture. Additionally, it also comes with multiple database connectors for different programming languages, allowing you to develop applications using any of the well known languages, and many other features.
It has many use cases under document storage, cloud, high availability systems, IoT (Internet of Things), hadoop, big data, data warehousing, LAMP or LEMP stack for supporting high-volume website/apps and much more.
In this article, we will explain a fresh installation of MySQL 8.0 database system on Ubuntu 18.04 Bionic Beaver. Before we move onto the actual installation steps, let’s look at a summary of:
What’s New in MySQL 8.0
- The database now incorporates a transactional data dictionary.
- Comes with Atomic DDL statement support.
- Enhanced security and account management.
- Improvements to resource management.
- Several InnoDB enhancements.
- New type of backup lock.
- Default character set has changed to utf8mb4 from latin1.
- A couple of JSON enhancements.
- Comes with regular expression support using International Components for Unicode (ICU).
- New error logging which now uses the MySQL component architecture.
- Enhancements to MySQL replication.
- Supports common table expressions(both non-recursive and recursive).
- Has an enhanced optimizer.
- Additional window functions and more.
Step 1: Add MySQL Apt Repository
Luckily, there is an APT repository for installing the MySQL server, client, and other components. You need to add this MySQL repository to your system’s package sources list; start by downloading the repository package using the wget tool from the command line.
$ wget -c https://dev.mysql.com/get/mysql-apt-config_0.8.10-1_all.deb
Then install the MySQL repository package using the following dpkg command.
$ sudo dpkg -i mysql-apt-config_0.8.10-1_all.deb
Note that in the package installation process, you will be prompted to choose MySQL server version and other components such as cluster, shared client libraries, or the MySQL workbench that you want to configure for installation.
MySQL server version mysql-8.0 will be auto-selected, then scroll down to the last option Ok and click [Enter]to finish the configuration and installation of the release package, as shown in the screenshot.
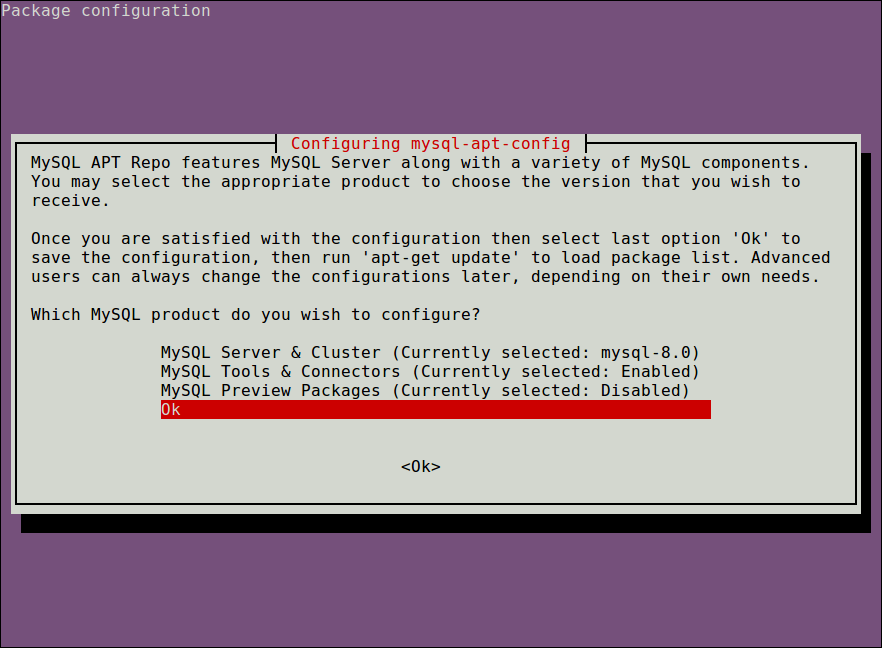
Configure MySQL APT Config
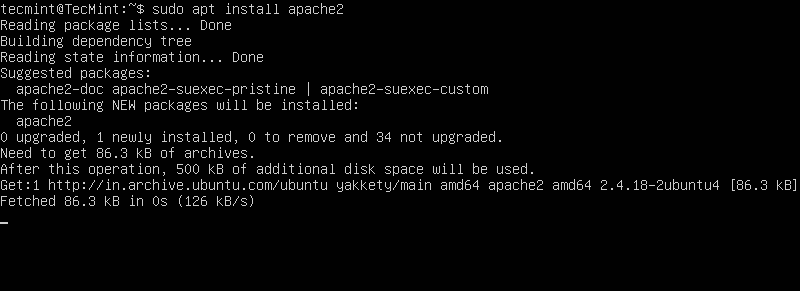
Step 2: Install MySQL Server in Ubuntu 18.04
Next, download the latest package information from all configured repositories, including the recently added MySQL repository.
$ sudo apt update
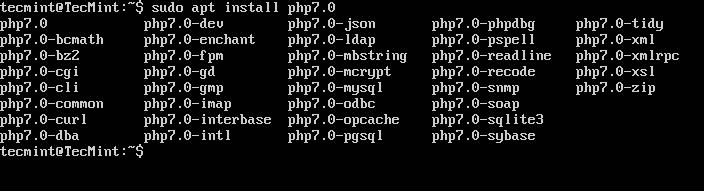
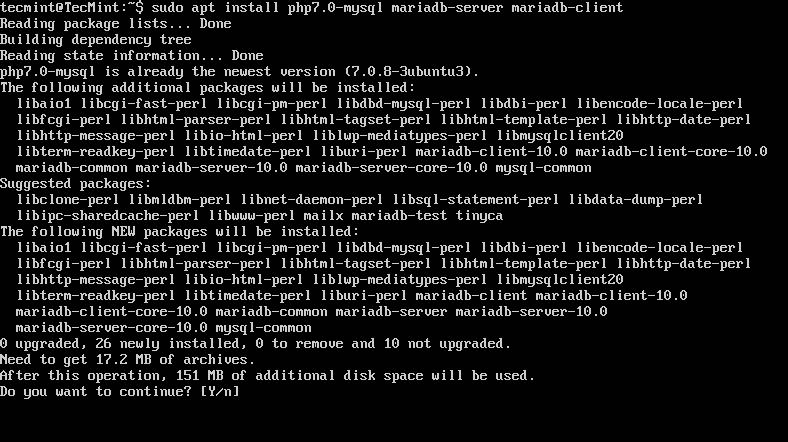
Then run the following command to install packages for the MySQL community server, client and the database common files.
$ sudo apt-get install mysql-server
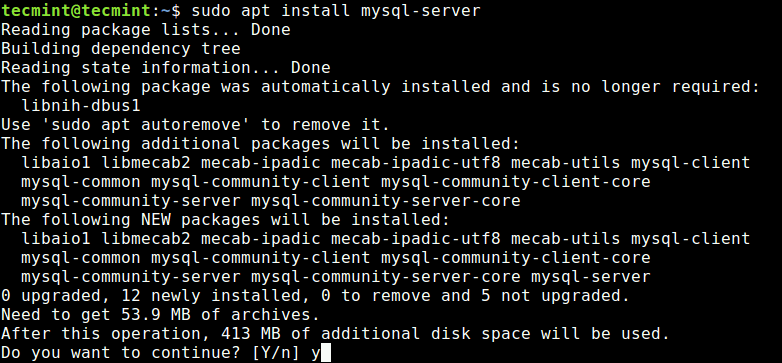
Install MySQL 8.0 in Ubuntu 18.04
Through the installation process, you will be asked to enter a password for the root user for your MySQL server, re-enter the password to confirm it and press [Enter].

Set MySQL Root Password
Next, the MySQL server authentication plugin configuration message will appear, read through it and use the right arrow to choose Ok and press [Enter] to continue.
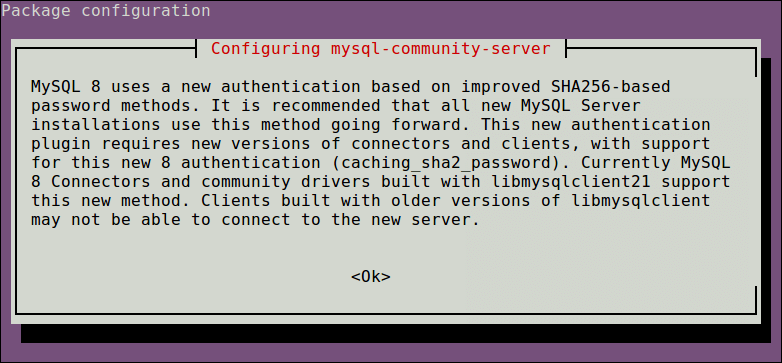
MySQL Authentication Configuration
Afterwards, you will be asked to select the default authentication plugin to use, then use the right arrow to choose Ok and press [Enter] to complete the package configuration.
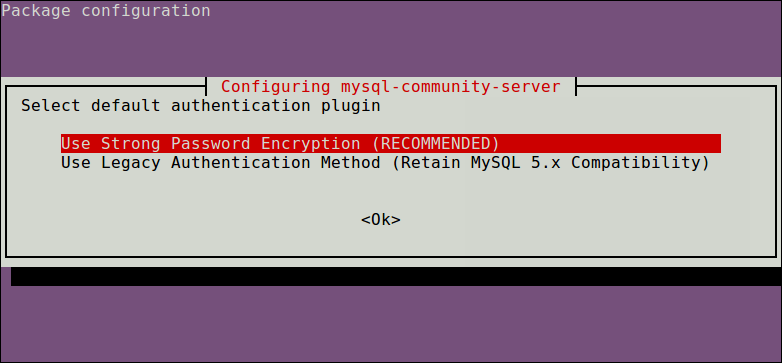
Select MySQL Authentication Plugin
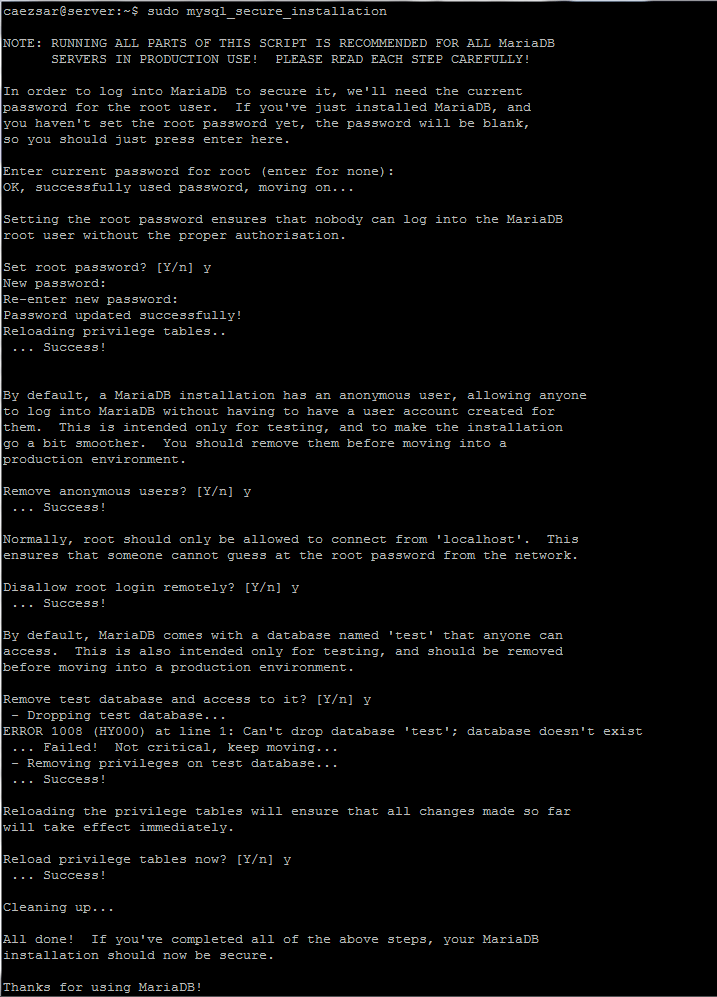
Step 3: Secure MySQL Server Installation
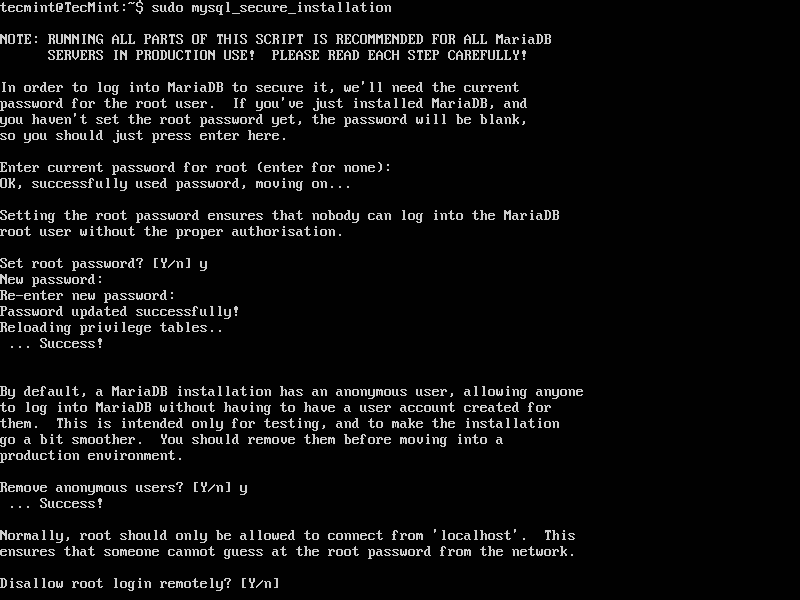
By default, the MySQL installation is unsecure. To secure it, run the security script which comes with the binary package. You will be asked to enter the root password you set during the installation process. Then also choose whether to use the VALIDATE PASSWORD plugin or not.
You can also change the root password you set before (as we have done in this example). Then enter yes/y to the following security questions:
- Remove anonymous users? (Press y|Y for Yes, any other key for No) :
y - Disallow root login remotely? (Press y|Y for Yes, any other key for No) :
y - Remove test database and access to it? (Press y|Y for Yes, any other key for No) :
y - Reload privilege tables now? (Press y|Y for Yes, any other key for No) :
y
Launch the script by issuing the following command.
$ sudo mysql_secure_installation
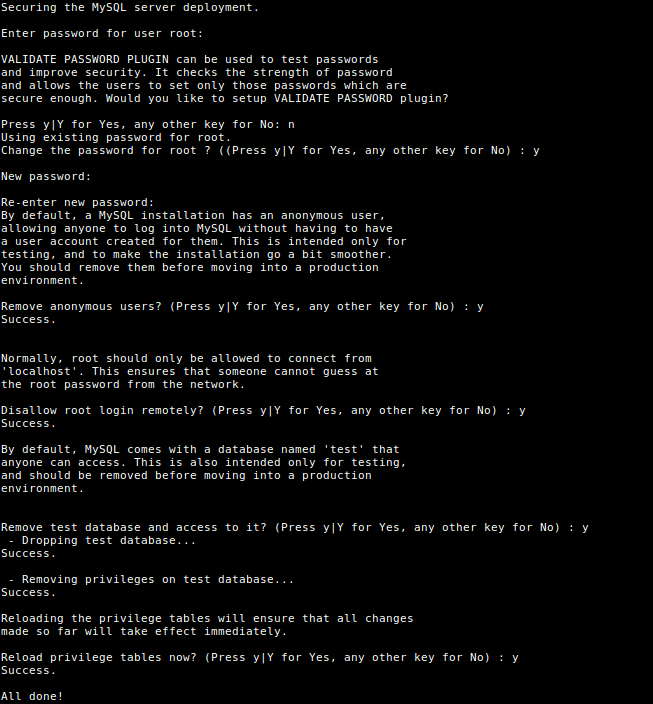
Secure MySQL Server Installation
To further secure your MySQL server, read our article 12 MySQL/MariaDB Security Best Practices for Linux.
Step 4: Managing MySQL Server via Systemd
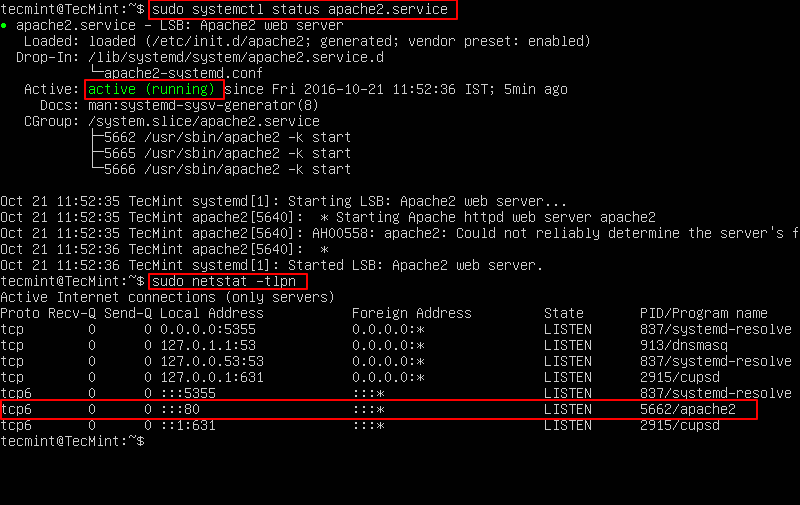
On Ubuntu, after installing a package, it’s service(s) are usually started automatically once the package is configured. You can check if the MySQL server is up and running using following command.
$ sudo systemctl status mysql
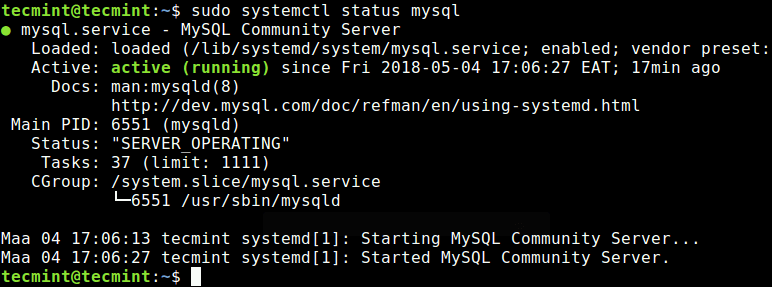
Check MySQL Server Status
If for one reason or the other, it isn’t auto-started, use the commands below to start and enable it to start at system boot time, as follows.
$ sudo systemctl status mysql
$ sudo systemctl enable mysql
Step 5: Install Extra MySQL Products and Components
In addition, you can install extra MySQL components that you feel you need in order to work with the server, such as mysql-workbench-community, libmysqlclient18 and many others.
$ sudo apt-get update
$ sudo apt-get install mysql-workbench-community libmysqlclient18
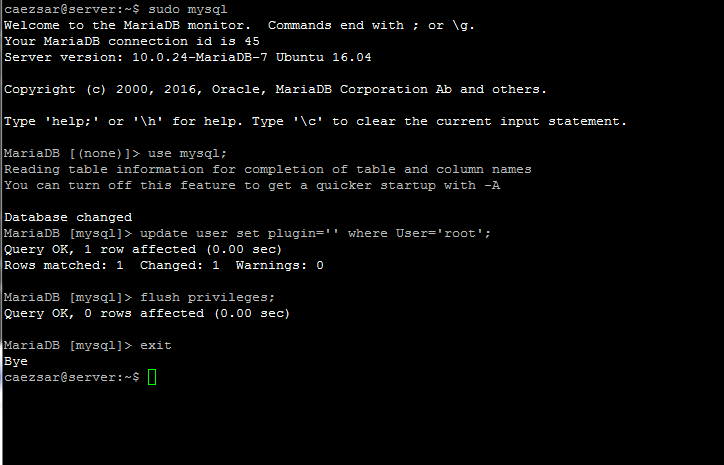
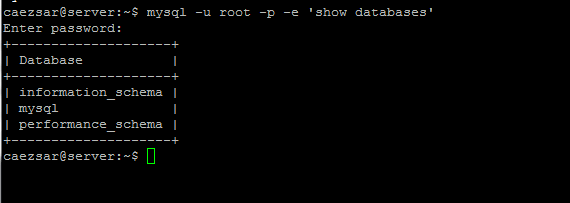
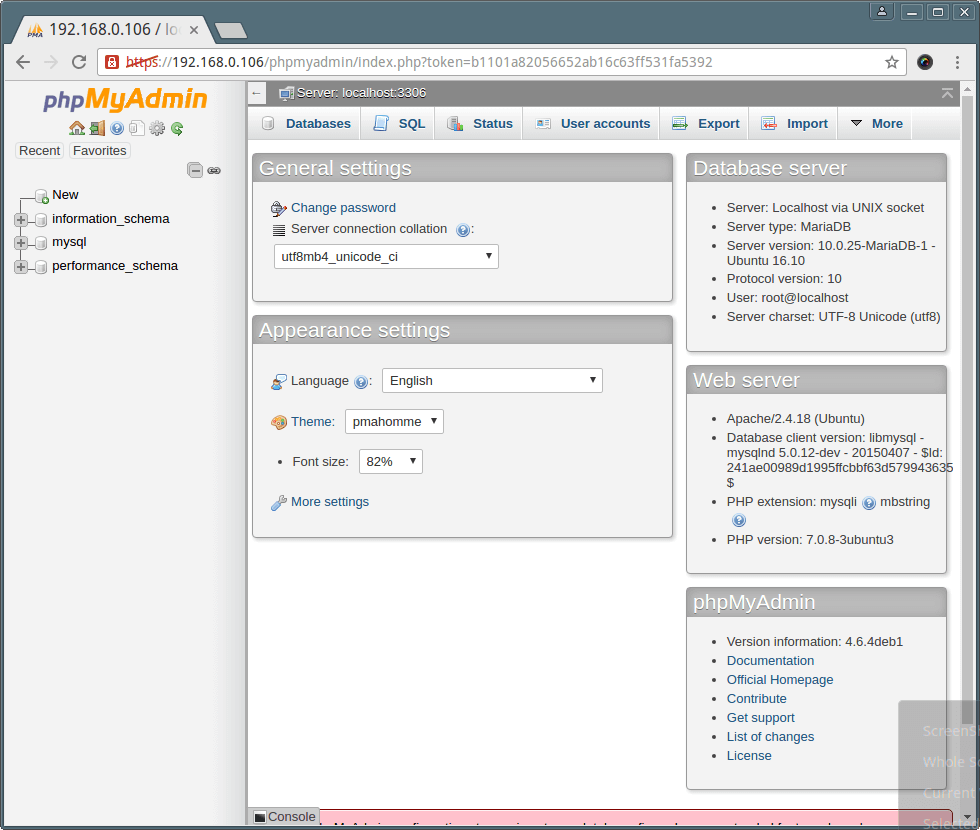
Finally, to access the MySQL shell, issue the following command.
$ sudo mysql -u root -p
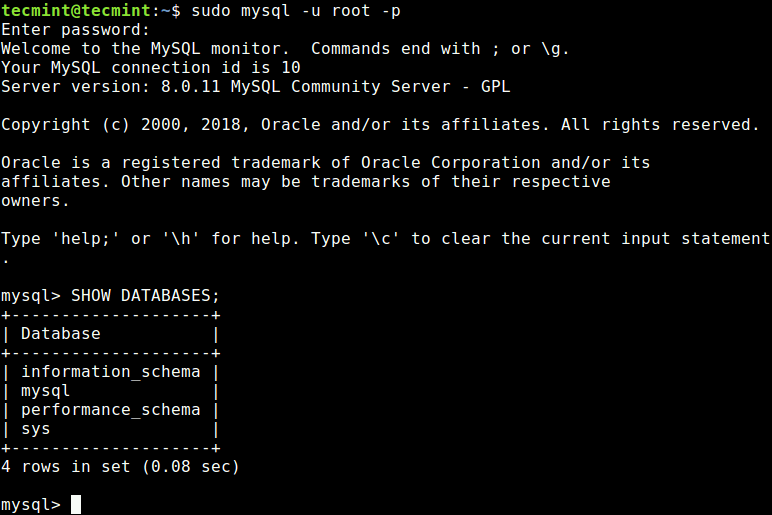
Connect to MySQL Server
For more information, read the MySQL 8.0 Release Notes.
That’s It! In this article, we have explained how to install MySQL 8.0 in Ubuntu 18.04 Bioni Beaver. If you have any questions or thoughts to share, use the comment form below to reach us.