In this article, we will learn how to monitor linux server using various shell commands and tools. Monitor linux server is crucial for maintaining the health and performance of your servers, workstations, or any computing devices. We’ll cover the creation of a basic script that tracks CPU usage, memory consumption, and disk space.
Table of Contents
Prerequisites
Step #1:Create a file in Ubuntu
Step #2:Write Shell script to monitor linux server
Step #3:Make file executable
Step #4:Run the script
Prerequisites
AWS Account with Ubuntu 24.04 LTS EC2 Instance.
Basic knowledge of Shell scripting.
Step #1:Create a file in Ubuntu
Open the terminal and use the nano command to create a new file.
nano monitor_resources.sh
Step #2:Write Shell script to monitor linux server
Write the script to monitor linux server into the file.
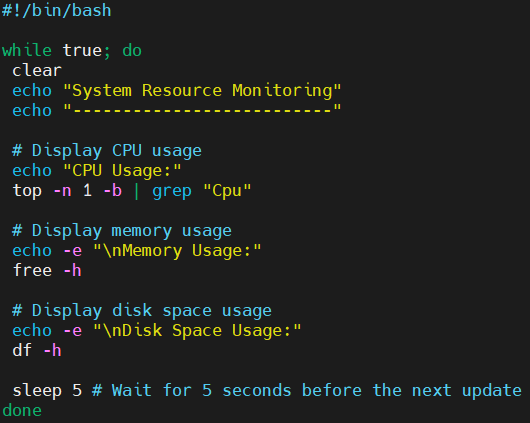
Following is a shell script to monitor system resources such as CPU usage, memory usage, disk space of linux server:
—————————————————
------------------------------------
#!/bin/bash
while true; do
clear
echo "System Resource Monitoring"
echo "--------------------------"
# Display CPU usage
echo "CPU Usage:"
top -n 1 -b | grep "Cpu"
# Display memory usage
echo -e "\nMemory Usage:"
free -h
# Display disk space usage
echo -e "\nDisk Space Usage:"
df -h
sleep 5 # Wait for 5 seconds before the next update
done
---------------------------------
Save the file and exit the editor.
Explanation of the Script:Shebang (#!/bin/bash): Specifies the shell to be used for interpreting the script.
while Loop: Creates an infinite loop that repeatedly gathers and displays system resource information.
clear: Clears the terminal screen for a cleaner display.
Display CPU Usage: Uses the top command with the -n 1 flag to display a single iteration of CPU usage information. The grep “Cpu” command filters out the relevant line.
Display Memory Usage: Uses the free command with the -h flag to display memory usage in a human-readable format.
Display Disk Space Usage: Uses the df command with the -h flag to display disk space usage in a human-readable format.
sleep 5: Pauses the loop for 5 seconds before gathering and displaying resource information again.
----------------------------------
Step #3:Make file executable
Change the file permissions to make it executable using the chmod command.
chmod +x monitor_resources.sh
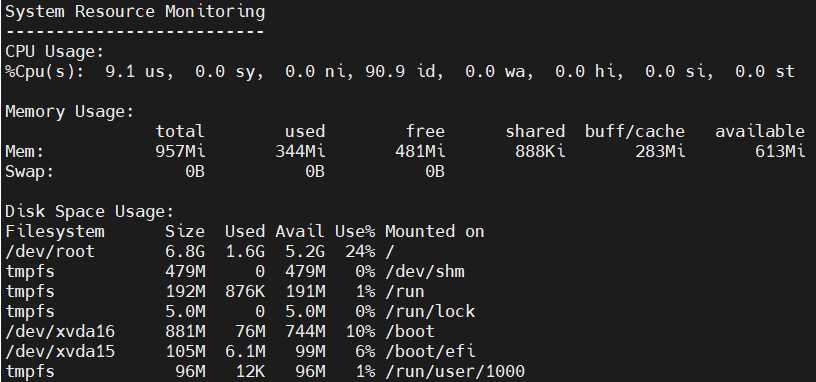
Run the script by executing the following command:
./monitor_resources.shOutput:
The terminal will now display system resource information, updating every 5 seconds. To stop the script, press CTRL + C.
Conclusion:
In conclusion, to monitor linux server using shell scripts on Ubuntu provides a straightforward and efficient way to keep track of CPU usage, memory consumption, and disk space. By following the steps to create, write, make executable, and run the monitor_resources.sh script, you can easily gather and display essential system information in real-time.
TeamViewer has long been a go-to solution for remote desktop access and collaboration across various platforms. However, for Linux users, finding reliable alternatives that seamlessly integrate with their systems has been a constant quest.
In 2024, the Linux ecosystem has witnessed significant advancements, leading to a surge in alternatives that offer robust features and compatibility.
In this article, we will explore the best TeamViewer alternatives for Linux, addressing frequently asked questions to help users make informed choices.
Contents:
1. Ammyy Admin
2. AnyDesk
3. RealVNC
4. TightVNC
5. Remmina
6. Chrome Remote Desktop
7. DWService
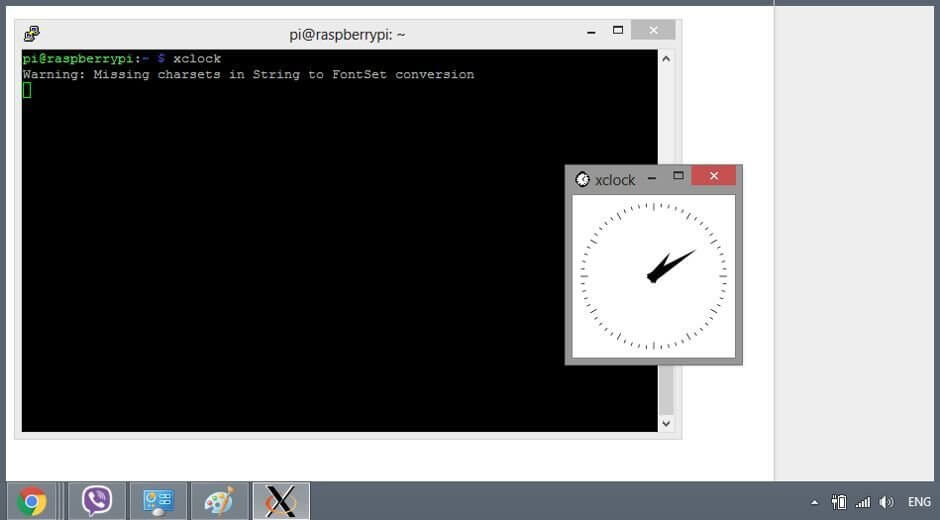
8. TigerVNC
9. X2Go
10. Apache Guacamole
11. RustDesk – Remote Desktop Access Software
Conclusion
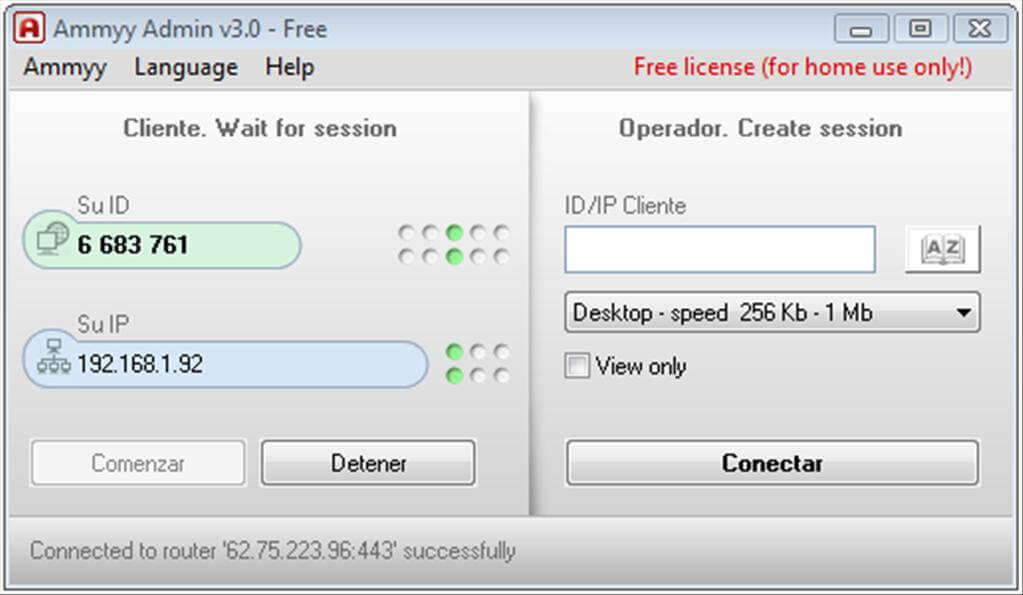
1. Ammyy Admin
Ammyy Admin is a proprietary remote desktop access software with a focus on stability, security, and simplicity used by more than 80 000 000 personal and corporate users.. It is free for personal use.
Ammyy Admin is excellent for system administration tasks, remote office actions e.g. file sharing, and online conference meetings. It runs as a portable execution file so it does not require any installation.
Ammyy Admin
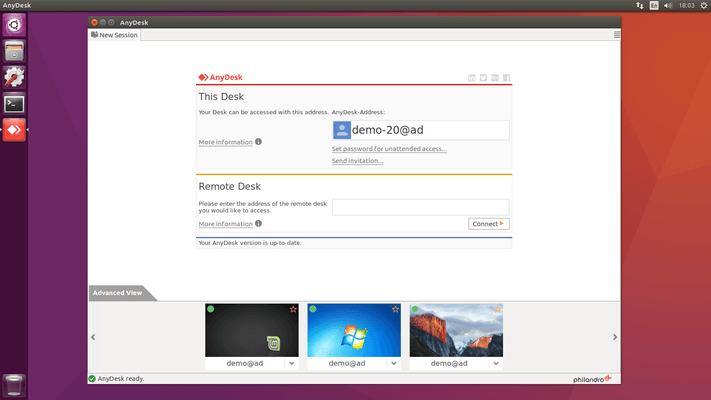
2. AnyDesk
AnyDesk is a modern proprietary multi-platform remote desktop software and has gained popularity as a versatile remote desktop software compatible with Linux.
Known for its low latency and high-quality resolution, AnyDesk supports both free for private use and subscription packages for Lite, Professional, and Enterprise versions for Business use.
It features high frame rates, real-time collaboration, effective bandwidth use, fail-safe Erlang network, low latency, session recording, automated updates, custom aliases, etc. It also offers various security, administration, and flexibility features.
You are free to take it for a test drive – no installation required.
AnyDesk
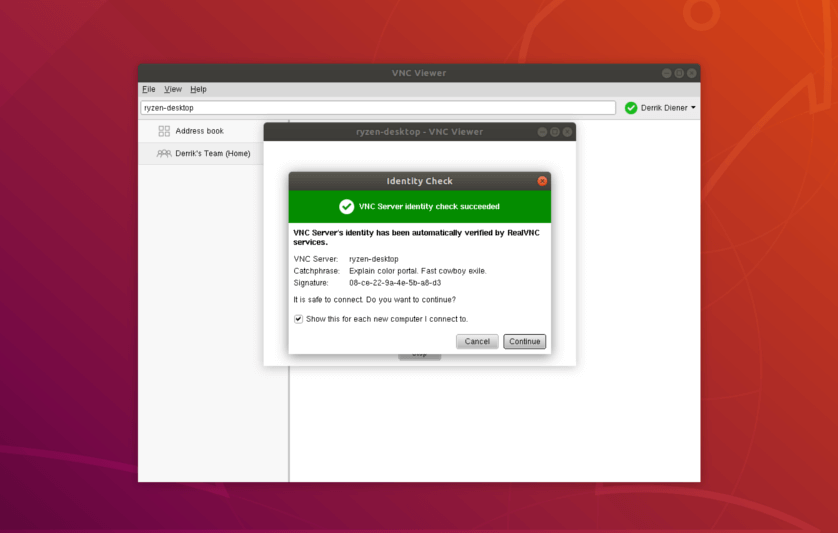
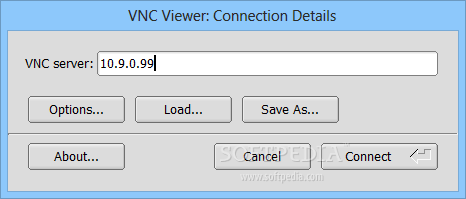
3. RealVNC
RealVNC a renowned remote access software, provides seamless connectivity across multi-platform. With Support for Linux, Windows, and macOS, RealVNC ensures efficient remote desktop solutions for personal and professional use such as OEMs, managed service providers, system administrators, IT experts, etc.
RealVNC is an enterprise-grade remote desktop access solution with tons of features, 250+ million downloads, 90+ thousand enterprise customers, 100+ major OEMs, and it is available for free private use.
RealVNC
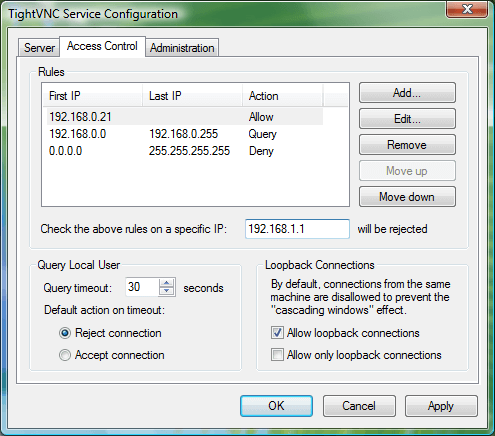
4. TightVNC
TightVNC is a lightweight and efficient remote desktop software that utilizes the Virtual Network Computing (VNC) protocol. Renowned for its simplicity and reliability, TightVNC enables users to access and control their Linux, Windows, or macOS machines remotely.
It excels in providing a fast and responsive remote desktop experience, making it an ideal choice for users who prioritize performance. With support for various platforms and a focus on ease of use, TightVNC remains a popular choice for those seeking a straightforward solution for remote desktop access on their systems.
TightVNC
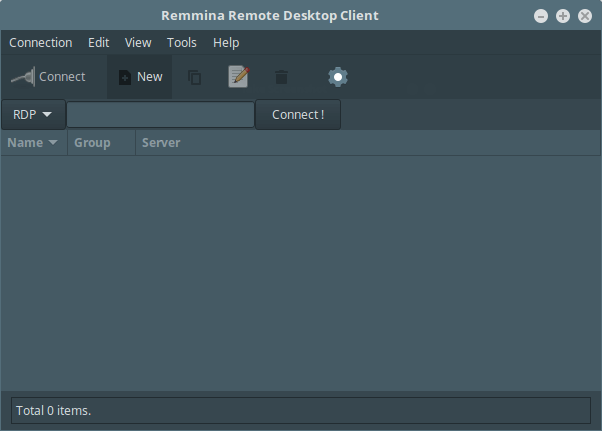
5. Remmina
Remmina is a feature-rich POSIX (Portable Operating System Interface) software that enables users to remotely access any Operating System with Linux.
It developed to serve system administrators as well as travellers whether they’re working from small netbooks or large monitors. It has support for several network protocols including RDP, VNC, NX, SSH, EXEC, SPICE, and XDMCP.
Remmina also features an integrated and consistent UI and is free to use for both personal and commercial purposes.
Remmina stands out as a free, open-source remote desktop client designed for the GNOME desktop environment. Supporting various protocols like VNC, RDP, SSH, and others, Remmina offers a customizable and easy-to-use interface. Users can manage multiple remote connections simultaneously, making it an ideal choice for those dealing with diverse servers.
Remmina Desktop Sharing Client
To install Remmina on Ubuntu, simply copy and paste the following commands on a terminal window.
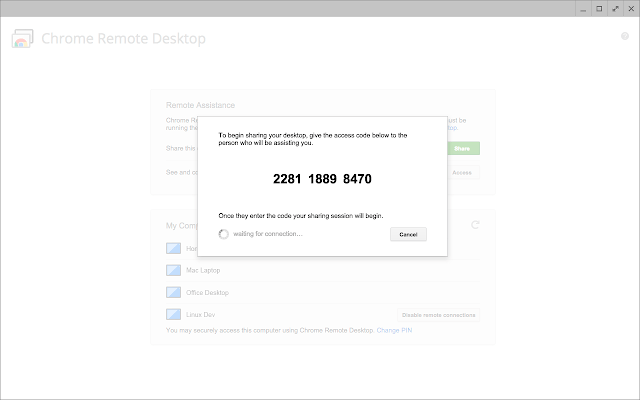
With Chrome Remote Desktop, you can access a Chromebook or any other computer through the Google Chrome browser – a process unofficially referred to as Chromoting. It streams the desktop using VP8 which makes it responsive with good quality.
Chrome Remote Desktop is a free proprietary extension, but it doesn’t exactly replace Team Viewer because you can only use it for remote access. No meetings, file sharing, etc, so consider it if you’re on a budget or need only remote desktop access and control.
Chrome Remote Desktop
7. DWService
DMService is a lightweight, free, cross-platform, and open-source remote desktop access software with an emphasis on ease of use, security, and performance.
It can be installed on all popular desktop platforms or run completely from your web browser – all you will have to do is log in. Its features include support for terminal sessions, an inbuilt text editor, resource management, log watch, and file sharing.
DWService
8. TigerVNC
TigerVNC an open-source implementation of the Virtual Network Computing (VNC) protocol, prioritizes performance and efficiency. It excels in delivering a fast and reliable remote desktop experience, making it suitable for users who prioritize speed and responsiveness.
TigerVNC is compatible with Linux, Windows, and macOS, ensuring seamless connectivity across platforms
TigerVNC has an almost uniform UI across platforms and is extensible with plugin extensions which can be used to add TLS encryption and advanced authentication methods, among other features.
It is important to note that TigerVNC isn’t a centralized service given that its servers are owned by a different company. And also unlike TeamViewer, it requires port forwarding.
TigerVNC
TigerVNC is available to install from the default distribution repository on Ubuntu, Debian, Fedora, OpenSUSE, FreeBSD, Arch Linux, Red Hat Enterprise Linux, and SUSE Linux Enterprise.
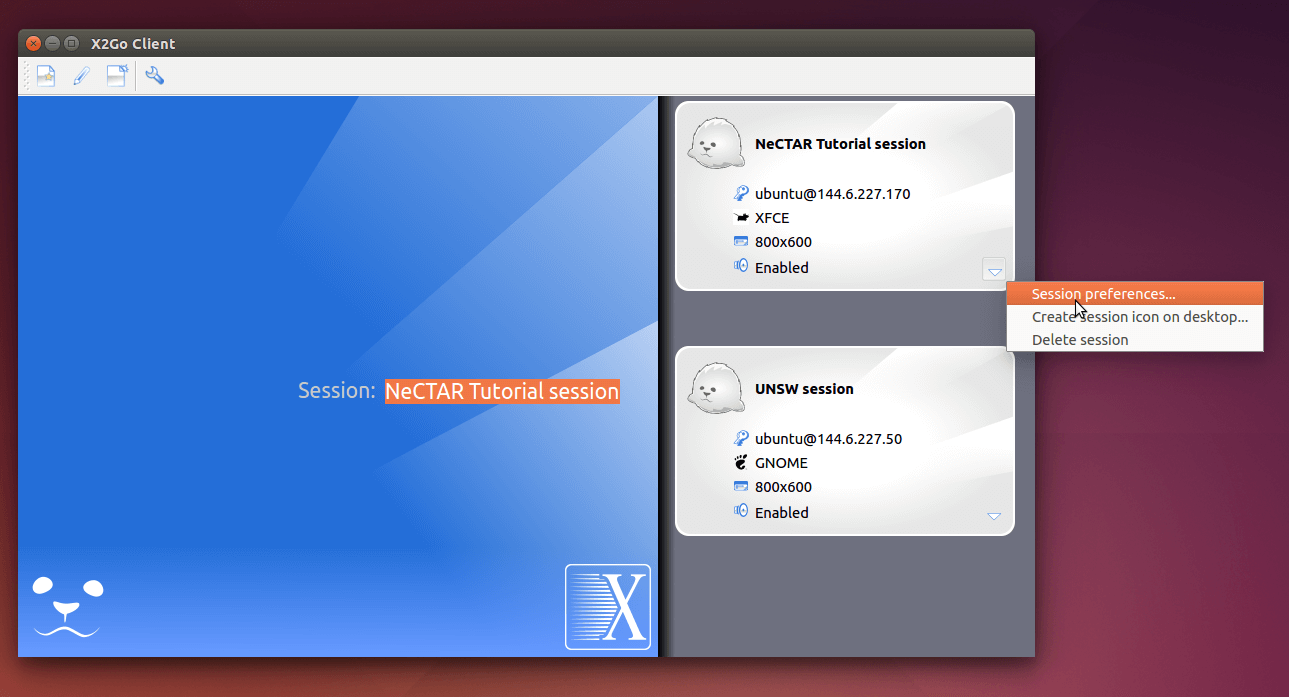
9. X2Go
X2Go is a free, open-source, and cross-platform remote desktop software that works using a modified NX 3 protocol and it works excellently even over low bandwidths.
You can use it to access any Linux GUI and that of a Windows system via a proxy. It also offers sound support, reconnecting to a session from another client, and file sharing.
X2Go
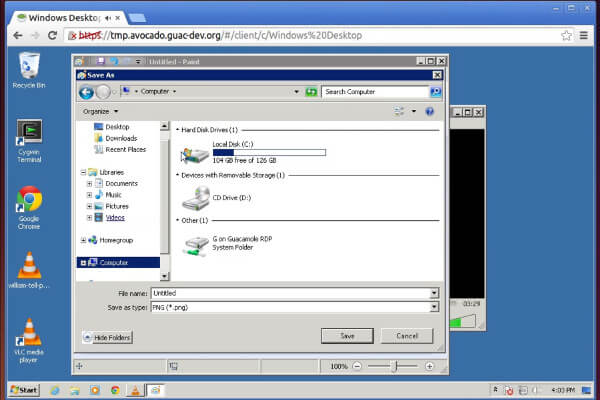
10. Apache Guacamole
Apache Guacamole is a free and open-source HTML5 web-based remote desktop gateway for accessing any computer from anywhere – all you need is an internet connection.
Apache Guacamole offers users the convenience of accessing both physical and cloud systems in a true cloud computing fashion.
It supports all the standard protocols not excluding RDP and VNC protocols, can be used at enterprise levels, does not require any plugins whatsoever, and administrators can monitor/kill connections in real-time as well as manage user profiles.
Apache Guacamole
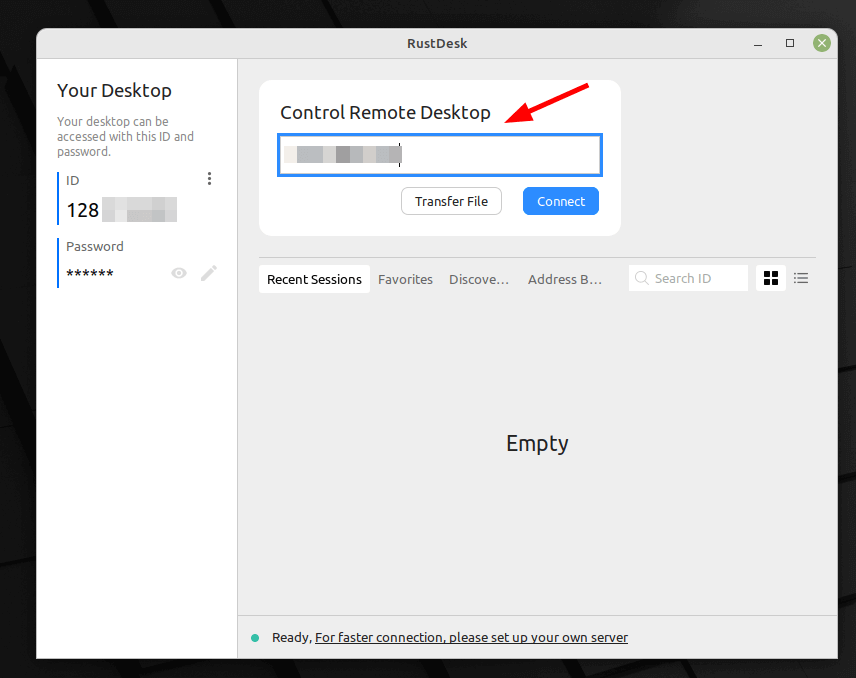
11. RustDesk – Remote Desktop Access Software
RustDesk is a promising remote desktop application for Linux that provides a user-friendly interface, file transfer, multi-monitor support, and clipboard sharing, catering to diverse remote desktop needs.
With RustDesk’s focus on security and privacy, users can enjoy end-to-end encryption and the ability to host their own servers, ensuring data protection and control.
RustDesk – Remote Desktop Access Software
Conclusion
That wraps up our list of the best gui remote client alternatives for Linux in 2024. Which one have you chosen?
In this article, We are going to cover Real time Kubernetes Interview Questions and Answers for Freshers and Experienced Candidate | Scenario Based Kubernetes Interview Questions and Answers | Kubernetes Troubleshooting Interview Questions and Answers.
Table of Contents:
Kubernetes Interview Questions and Answers
Kubernetes Networking and Security Interview Questions and Answers
Advanced Kubernetes Interview Questions and Answers
Kubernetes Pod Troubleshooting Interview Questions and Answers
Scenario Based Kubernetes Interview Questions and Answers
Scenario 1: Troubleshooting a deployment
Scenario 2: Scaling an application
Scenario 3: Handling a node failure
Scenario 4: Scaling Applications
Scenario 5: Rolling Updates
Scenario 6: Troubleshooting Pods
Scenario 7: Persistent Volumes
Scenario 8: Service Discovery
Scenario 9: Deploying StatefulSets
Scenario 10: ConfigMaps and Secrets
Kubernetes Interview Questions and Answers
1. What is Kubernetes
Kubernetes is one of the Leading open source Container Orchestration Engine. It is used to automatic cluster deployment, scaling and manage containerized applications.
2. What is difference between Docker Swarm and Kubernetes
Docker Swarm
Kubernetes
It is Clustering for Docker Container
It is Container Orchestration
Setup is Easy
Setup is Hard
Application deployment using Pods, Deployments and Service
Application deployment using only Service
Auto scaling is Not Possible
Auto scaling is possible
It has no GUI Dashboard
It has GUI Dashboard
It supports logging and monitoring using ELK Stack,Grafana,Influx,etc.
It does not support
3. What is Kubeadm
Kubeadm helps for installing and configuring Kubernetes cluster using command line.
4. What are Kubeadm commands ?
Command Name
Purpose
kubeadm init
Used on Master node and It is used to initialize and configure any node as a master node.
kubeadm join
Used on worker node and It is used to initialize and configure any node as worker node.
kubeadm token
It is used to genrate token.
kubeadm version
It used to check kubeadm version.
5. What are Kubernetes Cluster components on Master node
API Server, Scheduler, Controller Manager, ETCD
6. What are Kubernetes Cluster components on Worker node
Kubelet, Kubeproxy, Pods, Container
7. What is API Server
It is used to exposing various API’s. It is used to create,delete and update any object inside the cluster using kubectl command. API objects can be pods,containers,deployments,services..etc.
8. What is Scheduler ?
Scheduler is responsible for physically scheduling pods across multiple nodes, depending upon when we submit requirement to API server, scheduler schedules pod accordingly.
9. What is Controller Manager?
It is responsible overall health of entire cluster such as no of nodes insides the cluster, up and running status as per specification.
10. What is ETCD
etcd is light weight key-value database, it stores information like about current state of cluster,..etc.
11. What is Worker node in Kubernetes?
Worker node can be any Physical Server or Virtual Machine where containers are deployed , containers can be docker,rocket,.etc.
12. What is Kubelet ?
Kubelet is primary agent which runs on each worker node.It ensures containers are running in pod.
13. What is Kubeproxy?
It is core Networking component of Kubernetes cluster, it is responsible for entire network configuration, it maintains distributed network across all containers, pods and nodes.
14. What is Pod?
Pod is scheduling unit in Kubernetes, it consists of one or more container. With the help of pod we can deploy one or more container.
15. What are the different types of services in Kubernetes ?
Below are different types of services in Kubernetes:
Cluster IP – It is used to expose the service on internal IP within cluster.
Node Port – It is used to expose the service from outside.
Load Balancer – It creates external load balancer and assigns external IP to service.
External Name Creating – It is used expose the service using name.
16. What is the difference between deployment and service in Kubernetes ?
Deployment is an object in Kubernetes, using Deployment we can create and manage pods using replica set from template.
Deployment manages creating Pods using of Replica Sets
Service is responsible to allow network access to a set of pods.
17. What is the difference between pod and deployment in Kubernetes?
Pod is scheduling unit in Kubernetes, it consists of one or more container. With the help of pod we can deploy one or more container.
Deployment is an object in Kubernetes, using Deployment we can create and manage pods using replica set from template.
Both are objects in the Kubernetes API
18. What is the difference between config map and secrets in Kubernetes?
Config maps stores application configuration in a plain text format.
Secrets store sensitive data like password in an encrypted format
19. What is namespace in Kubernetes?
Using namespace, we can logically organize objects in the cluster like pod and deployments. When you create Kubernetes cluster , default, kube-system and kube-public namespace are available.
20. What is ingress in Kubernetes?
Ingress is a collection of routing rules for external services running in a Kubernetes cluster.
21. What is Namespace in Kubernetes/k8s ?
It is Kubernetes objects which is used to create multiple virtual clusters within same physical cluster.
We can deploy Pods, deployment, service within each Virtual Cluster called as Kubernetes Namespace.
22. What is use of Namespace in Kubernetes ?
Suppose you have Dev, QA and Prod Environment in your project and you want separate each environment in same cluster and deploy pods, deployments and services also.
In this scenario you can separate these resource in by creating Namespaces for Dev,QA,Prod and create pods, deployments, services.
23. What is ingress in Kubernetes ?
Ingress it is a Kubernetes objects which allows access to your Kubernetes services from outside/external.
Using Ingress we can expose pod’s port like 80 ,443 from outside network of Kubernetes over internet.
24. What are the different types of Ingress Controller in Kubernetes?
Below are some most used Ingress controllers on Kubernetes Cluster
Nginx Ingress Controller
AWS ALB
Traefik
Azure Application Gateway
HA Proxy
Contour
Istio
25. What is Replication Controller in Kubernetes ?
A Replication Controller ensures that a specified number of pod replicas are running at any given time. In other words, a Replication Controller makes sure that a pod or a homogeneous set of pods is always up and available.
26. What is ReplicaSet’s in Kubernetes ?
A ReplicaSet’s purpose is to maintain a stable set of replica Pods running at any given time. As such, it is often used to guarantee the availability of a specified number of identical Pods. The ReplicaSets are also known as next generation replication controller.
ReplicaSets checks whether the target pod is already managed by another controller as well (like a Deployment or another ReplicaSet).
27. What is the Difference between Kubernetes Replication Controllers and ReplicaSets
Replication Controller and Replica Set do almost the same thing. Both of them ensure that a specified number of pod replicas are running at any given time.
The difference comes with the usage of selectors to replicate pods. Replica Set use Set-Based selectors which gives more flexibility while replication controllers use Equity-Based selectors.
28. Why we need replication in Kubernetes ?
A container or pod may crash because of multiple reasons. The main purpose of using Replication is Reliability, Load Balancing, and Scaling. It ensures that the pre-defined pods always exists.
To understand this in an easier manner lets take an example ->
Lets assume we are running our application on a single pod. What if for some reason our application crashes and the pod fails. Users will no longer be able to access our application.
To prevent users from losing access to our application we would like to have more than one instances of our application running at the same time. That way if one pod fails we still have our application running on the other one. The replication controller helps us run multiple instances of a single pod in the Kubernetes cluster. Thus providing high availability.
Kubernetes Networking and Security Interview Questions and Answers.
How does Kubernetes handle networking for applications?
Kubernetes uses a service mesh to provide networking for applications. A service mesh is a dedicated infrastructure layer for handling communication between microservices.
What is a Kubernetes ingress controller?
An ingress controller is a component that handles incoming traffic to a Kubernetes cluster. It is responsible for routing traffic to the correct service based on the hostname or URL.
How does Kubernetes secure applications?
Kubernetes provides a number of security features, including network policies, pod security policies, and role-based access control (RBAC).
Advanced Kubernetes Interview Questions and Answers.
How does Kubernetes handle horizontal pod autoscaling (HPA)?
HPA is a controller that automatically scales the number of pods in a deployment based on CPU or memory usage.
What are the different ways to manage persistent storage in Kubernetes?
Kubernetes supports a number of different ways to manage persistent storage, including using PersistentVolumes (PVs), PersistentVolumeClaims (PVCs), and CSI drivers.
How does Kubernetes handle log collection and monitoring?
Kubernetes provides a number of tools for log collection and monitoring, including the Fluentd logging agent and the Heapster metrics server.
What is difference between Kubectl Describe vs kubectl get Get vs kubectl Explain
1. The kubectl describe command is used to display detailed information about specific Kubernetes resources. eg. kubectl describe pod my-pod -n my-namespace
2. The kubectl get command is used to retrieve a curated list of Kubernetes resources of a particular type of resource in the cluster. It provides a view of the current state of multiple resources. eg. kubectl get pods -n my-namespace
3. The kubectl explain command is used to retrieve detailed information about the structure and properties of Kubernetes resources. eg. kubectl explain pod
Difference between Cilium and Calico network plugin?
Cilium and Calico are both popular networking solutions used in Kubernetes environments,
but they have some different features and focuses which might make one more suitable than the other depending on the specific needs of a deployment.
Cilium: 1. BPF-based Networking:
Cilium utilizes eBPF (extended Berkeley Packet Filter), a powerful Linux kernel technology, to provide highly efficient network and security capabilities.
eBPF allows Cilium to perform networking, security, and load balancing functionalities directly in the Linux kernel without requiring traditional kernel modules or network proxies.
2. Security:
Cilium is highly focused on security. It offers network policies for container-based environments, API-aware network security, and support for transparent encryption.
3. Scalability and Performance:
Thanks to eBPF, Cilium is known for high performance and scalability, particularly in environments with high throughput and low latency requirements.
4. Service Mesh Integration:
Cilium integrates well with service mesh technologies like Istio, providing efficient load balancing and networking capabilities.
Calico: 1. Flexibility in Data Planes:
Calico provides options to use either standard Linux networking and routing capabilities or eBPF for more advanced scenarios.
This flexibility can be useful in different deployment environments.
2. Network Policy Enforcement:
Calico is well-known for its robust implementation of Kubernetes network policies, offering fine-grained control over network communication.
3. Cross-Platform Support:
Calico supports a wide range of platforms and environments, including Kubernetes, OpenShift, Docker EE, OpenStack, and bare-metal services.
4. Performance:
While Calico can use eBPF for high performance, its standard mode using IP routing and iptables is also very efficient and scalable.
Choosing Between Cilium and Calico:
If your primary focus is on advanced networking capabilities, leveraging the latest kernel technologies for performance, and tight integration with service meshes, Cilium is a strong choice.
If you need a flexible, platform-agnostic solution that offers robust network policy enforcement and can operate in a wide variety of environments, Calico might be more suitable.
Ultimately, the choice between Cilium and Calico will depend on the specific requirements of your infrastructure, such as performance needs, security requirements, existing technology stack, and your team’s familiarity with these tools.
What are different storage options are available in Kubernetes?
Answer:
• 𝗘𝗺𝗽𝘁𝘆𝗗𝗶𝗿 -> created when the Pod is assigned to a node -> RAM & Disk based mounting options -> Volume is initially empty
• 𝗟𝗼𝗰𝗮𝗹 -> represents a mounted local storage device -> only be used as a statically created PV -> Dynamic provisioning not supported -> must set a PV nodeAffinity
• 𝗛𝗼𝘀𝘁𝗽𝗮𝘁𝗵 -> mounts a file or dir from the host node’s FS to Pod -> presents many security risks- Avoid it -> Mostly useful for Static Pod! 𝗪𝗵𝘆? (static Pods cannot access CM)
• 𝗣𝗩𝗖 -> expanding PVC is enabled by default -> used to mount a PersistentVolume -> we can pre-bind PV & PVC
• 𝗦𝗲𝗰𝗿𝗲𝘁 -> secret volumes are backed by tmpfs (a RAM-backed fs) so they are never written to non-volatile storage -> A Secret is always mounted as readOnly
• 𝗖𝗼𝗻𝗳𝗶𝗴𝗠𝗮𝗽 -> Provides a way to inject config data into pods -> You must create a CM before you can use it -> CM is always mounted as readOnly.
• 𝗖𝗦𝗜 -> defines standard interface for container orchestration -> CSI compatible volume driver need to deployed -> Most widely used Option
Kubernetes Pod Troubleshooting Interview Questions and Answers:
1. POD OOM (Out of Memory) Errors-Pod exceeds memory limits Resolution: Analyze resource usage: `kubectl top pod<pod-name>`. Adjust memory requests/limits in pod spec.
2. Kubernetes Pod High CPU Usage – Pod consumes excessive CPU. Resolution: Monitor CPU utilization: `kubectl top pod <pod-name>`. Optimize application performance or scale horizontally.
3. Kubernetes Pods Stuck in Pending State – Insufficient resources or scheduling issues. – Resolution: Increase cluster capacity or adjust pod requests/limits. Review node conditions: `kubectl describe node`.
4. Kubernetes Pod Network Connectivity Issues – Pod unable to communicate with external resources. – Resolution: Diagnose network configurations: `kubectl describe pod <pod-name>`. Check network policies and firewall rules.
5. Kubernetes Pod Storage Volume Errors – Failure in accessing or mounting volumes. – Resolution: Verify volume configurations: `kubectl describe pod <pod-name>`. Check storage class availability and permissions.
6. Kubernetes pod Crashes and Restarting Pods- Application errors or resource constraints. – Resolution: Review pod logs: `kubectl logs <pod-name>`. Address application bugs or adjust resource allocations.
7. Kubernetes pod Failed Liveness or Readiness Probes – Pod fails health checks, affecting availability. – Resolution: Inspect probe configurations: `kubectl describe pod <pod-name>`. Adjust probe settings or application endpoints.
8. Kubernetes Pod Eviction due to Resource Pressure – Cluster resource scarcity triggers pod eviction. – Resolution: Monitor cluster resource usage: `kubectl top nodes`. Scale resources or optimize pod configurations.
9. Docker Image Pull Failures – Issues fetching container images from the registry. – Resolution: Verify image availability and credentials. Troubleshoot network connectivity with the registry.
10. Kubernetes Pod Security Policy Violations – Pods violate cluster security policies. – Resolution: Review pod security policies: `kubectl describe pod <pod-name>`. Adjust pod configurations to comply with policies.
Scenario Based Kubernetes Interview Questions and Answers:
Scenario 1: Troubleshooting a deployment
You have deployed a new application to your Kubernetes cluster, but it is not working as expected. How would you troubleshoot the issue?
Answer:
Check the deployment logs: The first step is to check the logs of the deployment to see if there are any errors or warnings. You can use the kubectl logs command to view the logs of a pod.
Check the pod status: You can also use the kubectl get pods command to check the status of the pods in the deployment. Make sure that all of the pods are running and that they are in a healthy state.
Check the service status: If the pods are healthy, but the application is still not working, you can check the status of the service that exposes the application. Make sure that the service is running and that it is configured correctly.
Check the ingress controller: If you are using an ingress controller to route traffic to your application, you can check the logs of the ingress controller to see if there are any errors.
Use kubectl exec: If you need to troubleshoot the application further, you can use the kubectl exec command to run a command inside of a container.
Scenario 2: Scaling an application
Your application is experiencing a surge of traffic and you need to scale it up quickly. How would you do this?
Answer:
Horizontal Pod Autoscaling (HPA): If you have configured HPA for your deployment, it will automatically scale the number of pods up based on the CPU or memory usage of the application.
Manual scaling: If you do not have HPA configured, you can manually scale your deployment by editing the .yaml file and increasing the number of replicas.
Blue-green deployment: If you want to avoid downtime during a scaling operation, you can use a blue-green deployment strategy. This involves deploying a new version of your application to a separate set of pods and then switching traffic to the new pods once they are ready.
Scenario 3: Handling a node failure
One of the nodes in your Kubernetes cluster has failed. How would you recover from this?
Answer:
Kubelet will restart pods: The Kubelet on the failed node will detect that the node is down and will restart the pods that were running on that node on other healthy nodes in the cluster.
Services will continue to function: The services that expose the application will continue to function, even if some of the pods are down. This is because Kubernetes uses a service mesh to handle communication between pods, and the service mesh will automatically route traffic to the healthy pods.
New node can be added: Once the failed node has been replaced, the Kubelet on the new node will report to the master node and join the cluster. The master node will then reschedule the pods that were running on the failed node to the new node.
Scenario 4: Scaling Applications
Question: How would you scale a Kubernetes deployment when you observe an increase in traffic to your application?
Answer: You can scale a deployment using the kubectl scale command. For example, to scale a deployment named “app-deployment” to three replicas, you would use:
This will ensure that three pods are running to handle increased traffic.
Scenario 5: Rolling Updates
Question: Describe the process of performing a rolling update for a Kubernetes deployment.
Answer: To perform a rolling update, you can use the kubectl set image command. For instance, to update the image of a deployment named “app-deployment” to a new version, you would use:
bash
kubectl set image deployment/app-deployment container-name=new-image:tag
Kubernetes will gradually replace the old pods with new ones, ensuring zero downtime during the update.
Scenario 6: Troubleshooting Pods
Question: A pod is not running as expected. How would you troubleshoot and identify the issue?
Answer: First, use kubectl get pods to check the status of the pod. Then, use kubectl describe pod <pod-name> to get detailed information, including events and container statuses. Inspecting the pod’s logs using kubectl logs <pod-name>for each container can provide insights into issues. Additionally, using kubectl exec -it <pod-name> -- /bin/sh allows you to access the pod’s shell for further debugging.
Scenario 7: Persistent Volumes
Question: Explain how you would manage persistent storage in Kubernetes.
Answer: Persistent Volumes (PVs) and Persistent Volume Claims (PVCs) are used for storage. A PV represents a physical storage resource, and a PVC is a request for storage by a pod. Admins create PVs, and users claim storage by creating PVCs. Pods reference PVCs. Storage classes define the type and characteristics of the storage. The YAML files for PVs, PVCs, and the deployment or pod need to be configured accordingly.
Scenario 8: Service Discovery
Question: How does service discovery work in Kubernetes, and how can services communicate with each other?
Answer: Kubernetes uses DNS for service discovery. Each service gets a DNS entry formatted as <service-name>.<namespace>.svc.cluster.local. Pods within the same namespace can communicate using this DNS. To enable communication between services in different namespaces, use the full DNS name, including the namespace. Kubernetes Services abstract the underlying pods, providing a stable endpoint for communication.
Scenario 9: Deploying StatefulSets
Question: Explain when you would use a StatefulSet instead of a Deployment, and how does it handle pod identity?
Answer: Use StatefulSets for stateful applications like databases, where each pod needs a unique identity and stable network identity. StatefulSets provide guarantees about the ordering and uniqueness of pods. Pods in a StatefulSet get a unique and stable hostname (e.g., <pod-name>-0, <pod-name>-1). This is crucial for applications requiring persistent storage and where the order of deployment and scaling matters.
Scenario 10: ConfigMaps and Secrets
Question: How do you manage configuration data and sensitive information in Kubernetes?
Answer: ConfigMaps are used to manage configuration data, while Secrets are used for sensitive information. ConfigMaps can be created from literal values or configuration files and mounted into pods as volumes or environment variables. Secrets store sensitive information and are mounted similarly. Ensure that access to Secrets is properly restricted, and consider using tools like Helm for managing and templating configuration.
Conclusion:
We have covered, Kubernetes Interview Questions and Answers for Freshers and Experienced Candidate. If you need any support please comment.
Before you can use an SD card or USB drive, it needs to be formatted and partitioned. Typically most USB drives and SD cards come preformatted using the FAT file system and do not need to be formatted out of the box. However, in some cases, you may need to format the drive.
In Linux, you can use a graphical tool like GParted or command-line tools such as fdisk or parted to format the drive and create the required partitions.
This article explains how to format a USB Drive or SD Card on Linux using the parted utility.
It’s important to note that formatting is a destructive process, and it will erase all the existing data. If you have data on the UDB drive or the SD card, make sure you back it up.
Installing parted
GNU Parted is a tool for creating and managing partition tables. The parted package is pre-installed on most Linux distros nowadays. You can check if it is installed on your system by typing:
Before formatting the drive, you can securely wipe out all the data on it by overwriting the entire drive with random data. This ensures that the data cannot be recovered by any data recovery tool.
You need to completely wipe the data only if the device is going to be given away. Otherwise, you can skip this step.
Be very careful before running the following command and irrevocably erase the drive data. The of=... part of the dd command must point to the target drive:
Depending on the size of the drive, the process will take some time to complete.
Once the disk is erased, the dd command will print “No space left on device”:
15455776768 bytes (15 GB, 14 GiB) copied, 780 s, 19.8 MB/s
dd: error writing '/dev/sdb': No space left on device
3777356+0 records in
3777355+0 records out
15472047104 bytes (15 GB, 14 GiB) copied, 802.296 s, 19.3 MB/s

Creating a Partition and Formatting

The most common file systems are exFAT and NTFS on Windows, EXT4 on Linux, and FAT32, which can be used on all operating systems.

We will show you how to format your USB drive or SD card to FAT32 or EXT4. Use EXT4 if you intend to use the drive only on Linux systems, otherwise format it with FAT32. A single partition is sufficient for most use cases.

Format with FAT32

First, create the partition table by running the following command:

$ sudo parted /dev/sdb --script -- mklabel msdos

Create a Fat32 partition that takes the whole space:
mke2fs 1.44.1 (24-Mar-2018)
/dev/sdb1 contains a vfat file system
Creating filesystem with 3777024 4k blocks and 944704 inodes
Filesystem UUID: 72231e0b-ddef-44c9-a35b-20e2fb655b1c
Superblock backups stored on blocks:
	32768, 98304, 163840, 229376, 294912, 819200, 884736, 1605632, 2654208

Allocating group tables: done
Writing inode tables: done
Creating journal (16384 blocks): done
Writing superblocks and filesystem accounting information: done
Verify it by printing the partition table:
$ sudo parted /dev/sdb --script print
The output should look something like this:Model:
Kingston DataTraveler 3.0 (scsi) Disk /dev/sdb: 15.5GB Sector size (logical/physical): 512B/512B Partition Table: gpt Disk Flags: Number Start End Size File system Name Flags 1 1049kB 15.5GB 15.5GB ext4 primary
Conclusion
Formatting a USB drive or SD card on Linux is a pretty straight forward process. All you need to do is insert the drive, create a partition table, and format it with FAT32 or your preferred file system.
So you were trying to customize your Ubuntu desktop but messed it up to end up with no Unity, no Launcher and no Dash? Don’t panic, there is a solution for this issue.
Fix no Unity, no Launcher, no Dash in Ubuntu 14.04 – 20.04.
At login time, use Ctrl+Alt+F1 to access the command line interface. You will have to use your username and password here. Once logged in, use the following commands:
Hope this fixes the issue with Ubuntu 14.04 – 20.04.
Alternative 1:
If the above solution did not work for you, try removing everything from config using the command below. You can still open the terminal using the shortcut Ctrl+Alt+T.
mv ~/.config ~/.config_backup
This will reset everything and your Ubuntu system will resemble to the looks of a fresh install. Installed applications will be untouched.
If even that did not work for you, there is another trick which I used in Ubuntu 12.10. But it still works for Ubuntu 17.10 GNOME.
Fix no Unity, no Launcher, no Dash in Ubuntu
I was installing Ubuntu on my friend’s laptop the other day when I encountered this strange scenario. After the fresh install when I boot into Ubuntu, there was no Unity, no side launcher, no dash, nothing. All it had was just the default wallpaper.
Ubuntu Desktop Without Unity
Clearly, something was broken. I tried the good old technique to reset Unity and Compiz in Ubuntu, did not work. After looking for hours in the forum, I came up with this awesome one-liner solution.
Use Ctrl+Alt+T to open the terminal. Now use the following command in the terminal:
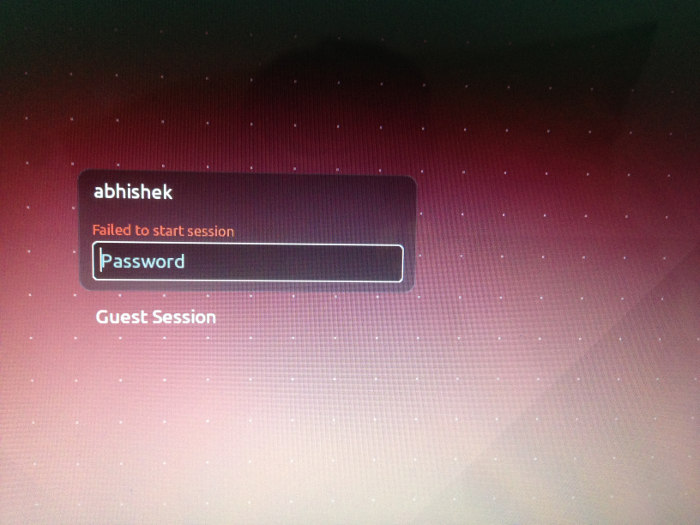
Unable to log in to Ubuntu because of ‘failed to start session’ error? Here’s what you could try.
I was trying to log in to Ubuntu as usual. I entered my password and it did not log me in even with the correct password. Instead, it showed me failed to start session in red colors. I could not even log in to the guest session.
In this quick post, we shall see how to fix failed to start session issue in Ubuntu 16.04-20.04 and earlier versions.
Fix failed to start session in Ubuntu
The reason here is that somehow your Unity desktop has been messed up. You can try several way to recover it. Let’s see how to do it.
When you are at login, press Ctrl+Alt+F1. It will take you to command line interface from the GUI. In here, type your username and password. Now, you can try the following command to install Unity Desktop:
sudo apt-get install ubuntu-desktop
If it is already installed, try reinstalling:
sudo apt-get install --reinstall ubuntu-desktop
Once it is installed or reinstalled. Use the following command to reboot the system:
sudo reboot
It will reboot and bring you back to login screen. Try login now. You should be able to log in. If you are still unlucky, try to use the alternative below:
Alternative method:
As an alternative you can use the command below to reconfigure the packaging:
sudo dpkg-reconfigure -a
At times, this should fix the failed to start session issue in Ubuntu. But it was not that easy for me. I used another approach which is slightly dirty. When I noticed that reinstalling Unity and reconfiguring the packages did not make any difference, I installed GNOME instead using a command like this:
This time at reboot, I was able to boot in to GNOME desktop or even choose to boot in to Ubuntu default, i.e. Unity. A word of warning, Unity may seem broken after installing Gnome. Change the theme and icons to that of Ambiance, instead of the default (Adawita).
That helped me fix “failed to load session” error in Ubuntu. Did it work for you? Do let me know if you have questions or suggestions.
Kubernetes is an open-source container orchestration platform that automates the deployment, scaling, and management of containerized applications.
What is a container?
A container is a lightweight, standalone, executable software package that includes everything needed to run an application, including code, runtime, system tools, libraries, and settings.
What are the benefits of using Kubernetes?
Kubernetes automates application deployment, scaling, and management, making it easy to deploy and manage container-based applications at scale. Other benefits include: Simplified application management Improved scaling and availability Easy deployment and rollback Improved resource utilization Increased portability and flexibility
What is a Kubernetes cluster?
A Kubernetes cluster is a set of nodes that run containerized applications managed by the Kubernetes control plane.
What is a node in Kubernetes?
A node is a worker machine in Kubernetes that runs containerized applications.
What is a pod in Kubernetes?
A pod is the smallest deployable unit in Kubernetes that represents a single instance of a running process in a container. Kubernetes Architecture
What is the Kubernetes control plane?
The Kubernetes control plane is a set of components that manages and orchestrates the Kubernetes cluster. It includes the following components: API server etcd kube-scheduler kube-controller-manager cloud-controller-manager
What is the API server in Kubernetes?
The API server is the front-end interface for the Kubernetes control plane that exposes the Kubernetes API.
What is etcd in Kubernetes?
etcd is a distributed, reliable, and highly available key-value store used to store the configuration data for the Kubernetes cluster.
What is the Kubernetes scheduler?
The Kubernetes scheduler is responsible for scheduling pods to run on available nodes in the cluster based on available resources and other scheduling requirements.
What is the kube-controller-manager?
The kube-controller-manager is responsible for running various controller processes that monitor the state of the cluster and make changes as necessary.
What is the cloud-controller-manager?
The cloud-controller-manager is responsible for managing integration with cloud providers, such as AWS, GCP, or Azure.
What is a Kubernetes worker node?
A Kubernetes worker node is a physical or virtual machine that runs containerized applications and services. It includes the following components: Kubelet kube-proxy container runtime
What is the kubelet in Kubernetes?
The kubelet is an agent that runs on each node and communicates with the Kubernetes API server to manage the container lifecycle.
What is the kube-proxy in Kubernetes?
The kube-proxy is responsible for managing network routing between pods and services in the Kubernetes cluster.
What is a container runtime in Kubernetes?
A container runtime is responsible for starting and stopping containers on a node. Examples include Docker, containerd, and CRI-O.
Why use namespace in Kubernetes?
Namespaces in Kubernetes are used for dividing cluster resources between users. It helps the environment where more than one user spread projects or teams and provides a scope of resources.
Kubernetes Networking:
What is a Kubernetes service?
A Kubernetes service is an abstraction layer that exposes a set of pods as a network service, allowing them to communicate with each other and with other services outside the cluster.
What is a Kubernetes DNS?
Kubernetes DNS is a service that provides DNS resolution for services and pods in a Kubernetes cluster.
What is a pod network in Kubernetes?
A pod network is a network overlay that connects pods in a Kubernetes cluster.
What is the Kubernetes CNI (Container Networking Interface)?
The Kubernetes CNI is a specification that defines a standardized interface for integrating with container networking plugins. Deploying Applications in Kubernetes
What is a Kubernetes deployment?
A Kubernetes deployment defines a desired state for a group of replicas of a pod, and manages the rollout and rollback of updates to the pod replicas.
What is a Kubernetes pod template?
A Kubernetes pod template defines the desired configuration for a pod, including the container image, environment variables, and other settings.
What is a Kubernetes replica set?
A Kubernetes replica set ensures that a specified number of replicas of a pod are running at any given time.
What is a Kubernetes stateful set?
A Kubernetes stateful set manages the deployment, scaling, and ongoing state of a set of stateful pods, such as databases or other stateful applications.
What is a Kubernetes daemon set?
A Kubernetes daemon set ensures that a specific pod runs on all or some nodes in the cluster.
What is a Kubernetes job?
A Kubernetes job runs a specific task to completion, such as running a batch job or performing a data processing task.
Kubernetes Scheduling and Scaling:
What is Kubernetes scheduling?
Kubernetes scheduling is the process of assigning a running pod to a node in the cluster.
What is Kubernetes scheduling policy?
Kubernetes scheduling policy is a set of rules and criteria used to determine which node in the cluster should run a specific pod.
What is a Kubernetes affinities?
Kubernetes affinities are rules that determine the preferred scheduling of pods based on various factors, such as the existence of a specific data volume or the location of a specific node.
What is a Kubernetes anti-affinities?
Kubernetes anti-affinities are rules that determine the preferred scheduling of pod based on factors that should be avoided, such as running two replicas of a pod on the same node.
What is Kubernetes horizontal pod autoscaling (HPA)?
Kubernetes HPA automatically scales the number of replicas of a pod based on the current demand for resources.
What is Kubernetes Vertical Pod Autoscaling (VPA)?
Kubernetes VPA automatically adjusts the resource requirements of a pod based on the current resource usage.
What is Kubernetes cluster autoscaling?
Kubernetes cluster autoscaling automatically scales the number of nodes in a cluster based on the current demand for resources. Monitoring and Logging in Kubernetes
What is Kubernetes monitoring?
Kubernetes monitoring is the process of monitoring the health and performance of a Kubernetes cluster and its applications.
What is Kubernetes logging?
Kubernetes logging is the process of collecting and analyzing the logs generated by the applications and services running in a Kubernetes cluster.
What is Kubernetes Prometheus?
Kubernetes Prometheus is an open-source monitoring and alerting toolkit that collects metrics and data from the Kubernetes API server.
What is Kubernetes Grafana?
Kubernetes Grafana is an open-source data visualization and analysis tool that provides real-time monitoring and analysis of Kubernetes clusters.
What is Kubernetes Fluentd?
Kubernetes Fluentd is an open-source data collection and forwarding tool that aggregates logs and sends them to a central location for analysis and storage.
What is Kubernetes Kibana?
Kubernetes Kibana is an open-source data visualization and analysis tool that provides real-time analysis of logs and other data generated by Kubernetes clusters.
Kubernetes Security:
What is Kubernetes RBAC (Role-Based Access Control)?
Kubernetes RBAC is a method of controlling access to Kubernetes resources based on user roles and permissions.
What is Kubernetes TLS (Transport Layer Security)?
Kubernetes TLS is a security protocol used to secure client-server communications within a Kubernetes cluster.
What is Kubernetes network policies?
Kubernetes network policies are rules that control the flow of network traffic between pods and services within a Kubernetes cluster.
What is Kubernetes pod security policies?
Kubernetes pod security policies are a set of policies that control the security settings for pods deployed in a Kubernetes cluster.
What is Kubernetes secrets?
Kubernetes secrets are a secure way to store sensitive information, such as passwords, API keys, and other authentication tokens, used by applications running in a Kubernetes cluster.
What is Kubernetes pod security context?
Kubernetes pod security context provides a way to set security-related attributes on a per-pod basis, such as user and group IDs, and file permissions.
Kubernetes Tools and APIs:
What is kubectl?
kubectl is the command-line tool used to interact with a Kubernetes cluster.
What is the Kubernetes API?
The Kubernetes API is a RESTful API used to manage and operate Kubernetes clusters.
What is Kubernetes Helm?
Kubernetes Helm is a package manager for Kubernetes that helps you deploy, manage and upgrade Kubernetes applications.
What is Kubernetes Dashboard?
Kubernetes Dashboard is a web-based user interface for managing and monitoring Kubernetes clusters.
Debugging and Troubleshooting in Kubernetes:
What is Kubernetes pod readiness probe?
Kubernetes pod readiness probe is used to determine if a pod is ready to serve traffic.
What is Kubernetes pod liveness probe?
Kubernetes pod liveness probe is used to determine if a pod is alive and running.
How do you troubleshoot a Kubernetes pod?
Troubleshooting a Kubernetes pod involves checking logs, investigating resource utilization, and inspecting the pod status and events.
What is Kubernetes kubectl logs?
Kubernetes kubectl logs is the command to retrieve the logs generated by a specific pod.
What is Kubernetes kubectl describe?
Kubernetes kubectl describe is the command to get detailed information about a Kubernetes object, such as a pod, replication controller, or service. Kubernetes Cluster Administration:
What is Kubernetes cluster management?
Kubernetes cluster management involves configuring and maintaining the Kubernetes control plane, worker nodes, and network settings.
What is Kubernetes API server authorization?
Kubernetes API server authorization controls who can access and perform actions against the Kubernetes API server.
What is Kubernetes cluster backup and restore?
Kubernetes cluster backup and restore involves backing up and restoring the configuration and data stored in the Kubernetes objects, such as pods, services, and deployments.
How does Kubernetes perform a rolling update?
Kubernetes performs a rolling update by gradually upgrading the replicas of a pod, ensuring that the application remains available and responsive during the update.
Kubernetes Best Practices:
What are the best practices for deploying applications in Kubernetes?
Best practices for deploying applications in Kubernetes include: Using declarative deployment methods, such as Deployments or Helm charts Separating concerns between services by deploying them in separate namespaces Using liveness and readiness probes to ensure the health of the application Setting resource limits and requests to ensure adequate resources for the application
What are the best practices for Kubernetes cluster security?
Best practices for Kubernetes cluster security include: Implementing Role-Based Access Control (RBAC) Using network policies to control traffic within the cluster Restricting external access to cluster components and API servers Implementing secured node access and communication between nodes in the cluster
What are the best practices for Kubernetes performance optimization?
Best practices for Kubernetes performance optimization include: Setting resource limits and requests to ensure adequate resources for the application Using horizontal and vertical pod autoscaling Optimizing container images for size and performance Monitoring and tuning system and application performance Developing with Kubernetes
What is Kubernetes operator?
Kubernetes operator is an extension of the Kubernetes API that enables the automation of complex application or cluster management operations.
What is Kubernetes custom resource definition?
Kubernetes custom resource definition is a way to extend the Kubernetes API with custom resources and APIs that are specific to a particular application or framework.
What is Kubernetes CRD controller?
Kubernetes CRD controller is used to define the behavior of the custom resources and their interactions with other Kubernetes components. Kubernetes Networking
What is Kubernetes Istio?
Kubernetes Istio is an open-source service mesh that provides traffic management, observability, and security for microservices-based applications.
What is Kubernetes service mesh?
Kubernetes service mesh is a dedicated infrastructure layer for managing service-to-service communication within a Kubernetes cluster.
What is Kubernetes Ingress?
Kubernetes Ingress is an API object that defines rules for directing inbound traffic to Kubernetes services.
What is Kubernetes gateway?
Kubernetes gateway is a network entry point that manages incoming and outgoing traffic for a service mesh.
Kubernetes Runtime:
What is Kubernetes containerd?
Kubernetes containerd is a lightweight, non-intrusive container runtime for Kubernetes.
What is Kubernetes CRI-O?
Kubernetes CRI-O is a container runtime designed specifically for Kubernetes, providing a lightweight and fast container runtime for Kubernetes environments.
What is Kubernetes KubeVirt?
Kubernetes KubeVirt is an open-source virtual machine runtime for Kubernetes, allowing users to deploy and manage virtual machines alongside Kubernetes workloads.
What is Kubernetes Kata Containers?
Kubernetes Kata Containers is a secure container runtime option for Kubernetes, providing hardware-implemented isolation to ensure security and isolation between containers.
Kubernetes Cloud-Native Development:
What is Kubernetes cloud-native development?
Kubernetes cloud-native development is a software development methodology that maximizes the use of Kubernetes to build, deploy, and manage cloud-native applications.
What is Kubernetes software development kit (SDK)?
Kubernetes software development kit (SDK) is a set of tools and libraries that help developers build, deploy and manage cloud-native applications on Kubernetes.
What is Kubernetes Helm?
Kubernetes Helm is a package manager for Kubernetes that provides templating and deployment automation for cloud-native applications.
Miscellaneous: What is the difference between a deployment and a stateful set in Kubernetes?
Deployments are used for stateless applications, while stateful sets are used for stateful applications, such as databases or other applications that require persistent and stable storage.
What is Kubernetes Configuration Management?
Kubernetes Configuration Management is the automated management of configuration files and settings across a Kubernetes cluster.
What is Kubernetes container orchestration?
Kubernetes container orchestration is the automated process of deploying, scaling, and managing containerized applications in a Kubernetes cluster.
What is Kubernetes containerization?
Kubernetes containerization is the process of packaging an application and all its dependencies into a container for deployment and management.
What is Kubernetes cloud deployment?
Kubernetes cloud deployment is the deployment of Kubernetes clusters on cloud platforms, such as AWS, Azure, or GCP.
What is Kubernetes on-premises deployment?
Kubernetes on-premises deployment is the deployment of Kubernetes clusters on private or enterprise servers and data centers.
Conclusion: These are some of the most commonly asked Kubernetes questions with detailed answers.
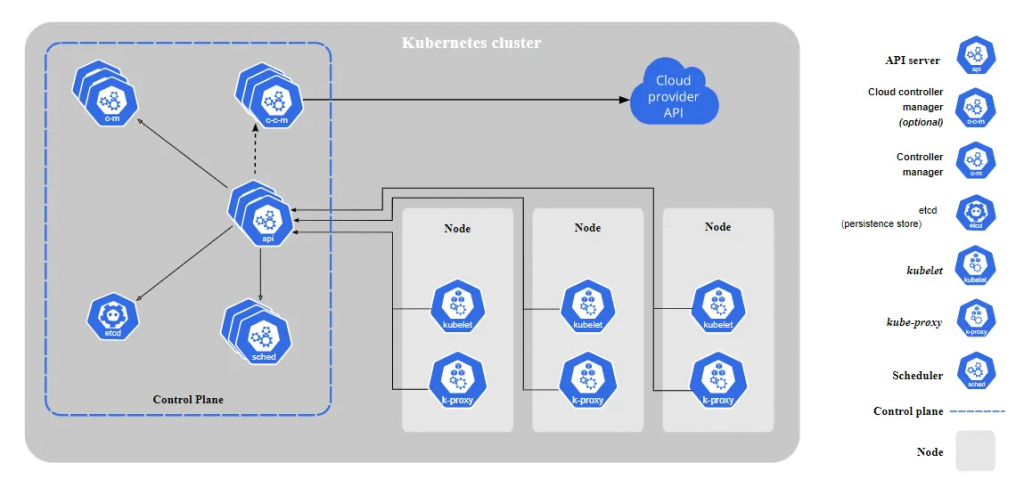
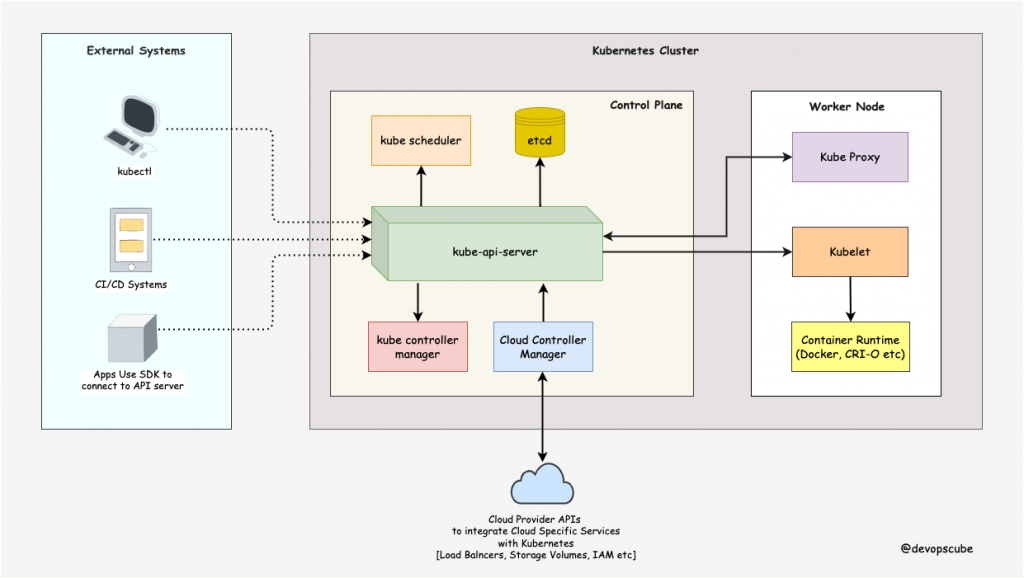
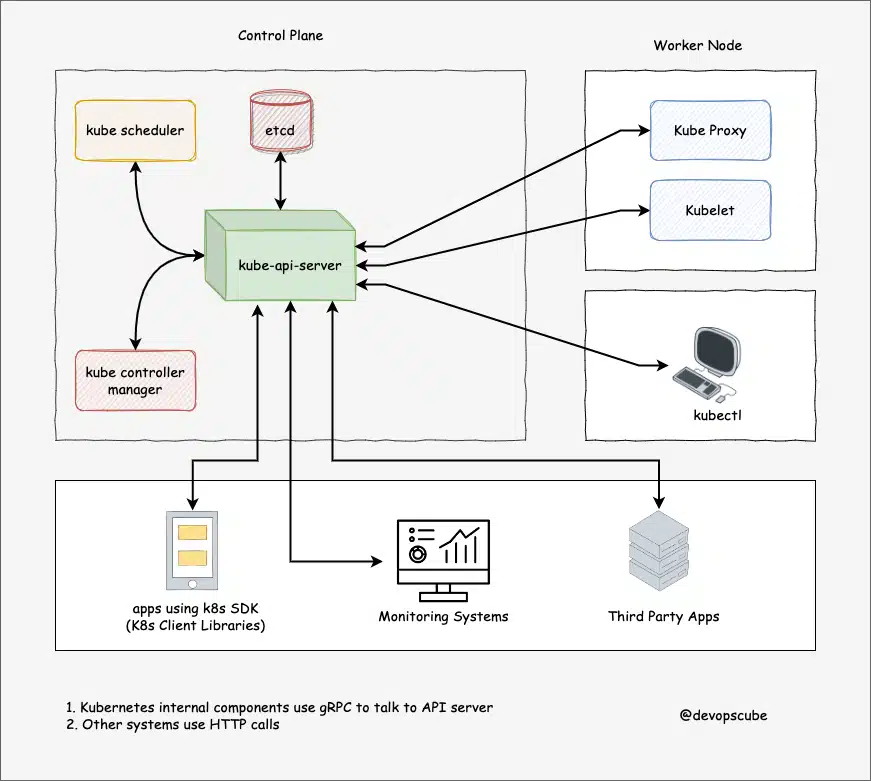
The following Kubernetes architecture diagram shows all the components of the Kubernetes cluster and how external systems connect to the Kubernetes cluster.
The first and foremost thing you should understand about Kubernetes is, that it is a distributed system. Meaning, it has multiple components spread across different servers over a network. These servers could be Virtual machines or bare metal servers. We call it a Kubernetes cluster.
A Kubernetes cluster consists of control plane nodes and worker nodes.
Control Plane
The control plane is responsible for container orchestration and maintaining the desired state of the cluster. It has the following components.
kube-apiserver
etcd
kube-scheduler
kube-controller-manager
cloud-controller-manager
Worker Node
The Worker nodes are responsible for running containerized applications. The worker Node has the following components.
kubelet
kube-proxy
Container runtime
Kubernetes Control Plane Components
First, let’s take a look at each control plane component and the important concepts behind each component.
1. kube-apiserver
The kube-api server is the central hub of the Kubernetes cluster that exposes the Kubernetes API.
End users, and other cluster components, talk to the cluster via the API server. Very rarely monitoring systems and third-party services may talk to API servers to interact with the cluster.
So when you use kubectl to manage the cluster, at the backend you are actually communicating with the API server through HTTP REST APIs. However, the internal cluster components like the scheduler, controller, etc talk to the API server using gRPC.
The communication between the API server and other components in the cluster happens over TLS to prevent unauthorized access to the cluster.
Kubernetes api-server is responsible for the following
API management: Exposes the cluster API endpoint and handles all API requests.
Authentication (Using client certificates, bearer tokens, and HTTP Basic Authentication) and Authorization (ABAC and RBAC evaluation)
Processing API requests and validating data for the API objects like pods, services, etc. (Validation and Mutation Admission controllers)
It is the only component that communicates with etcd.
api-server coordinates all the processes between the control plane and worker node components.
api-server has a built-in bastion apiserver proxy. It is part of the API server process. It is primarily used to enable access to ClusterIP services from outside the cluster, even though these services are typically only reachable within the cluster itself.
Note: To reduce the cluster attack surface, it is crucial to secure the API server. The Shadowserver Foundation has conducted an experiment that discovered 380 000 publicly accessible Kubernetes API servers.
2. etcd
Kubernetes is a distributed system and it needs an efficient distributed database like etcd that supports its distributed nature. It acts as both a backend service discovery and a database. You can call it the brain of the Kubernetes cluster.
etcd is an open-source strongly consistent, distributed key-value store. So what does it mean?
Strongly consistent: If an update is made to a node, strong consistency will ensure it gets updated to all the other nodes in the cluster immediately. Also if you look at CAP theorem, achieving 100% availability with strong consistency and & Partition Tolerance is impossible.
Distributed: etcd is designed to run on multiple nodes as a cluster without sacrificing consistency.
Key Value Store: A nonrelational database that stores data as keys and values. It also exposes a key-value API. The datastore is built on top of BboltDB which is a fork of BoltDB.
etcd uses raft consensus algorithm for strong consistency and availability. It works in a leader-member fashion for high availability and to withstand node failures.
So how does etcd work with Kubernetes?
To put it simply, when you use kubectl to get kubernetes object details, you are getting it from etcd. Also, when you deploy an object like a pod, an entry gets created in etcd.
In a nutshell, here is what you need to know about etcd.
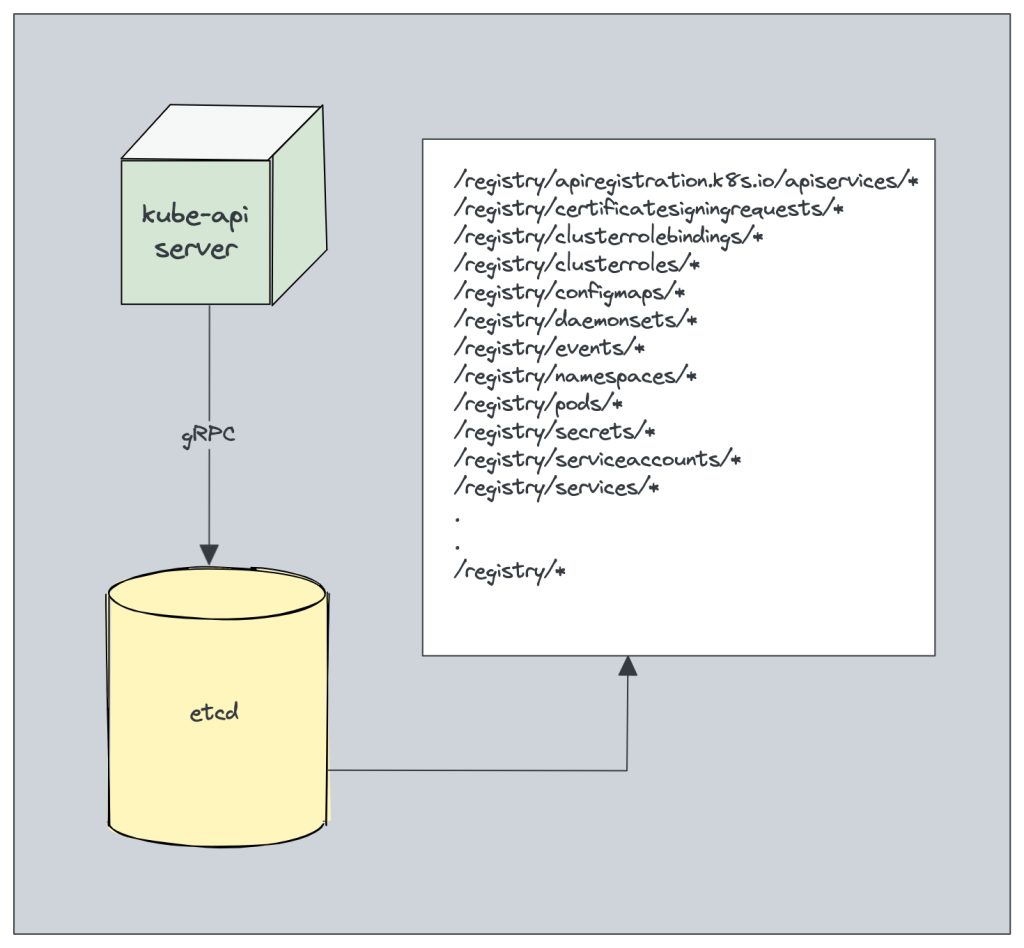
etcd stores all configurations, states, and metadata of Kubernetes objects (pods, secrets, daemonsets, deployments, configmaps, statefulsets, etc).
etcd allows a client to subscribe to events using Watch() API . Kubernetes api-server uses the etcd’s watch functionality to track the change in the state of an object.
etcd exposes key-value API using gRPC. Also, the gRPC gateway is a RESTful proxy that translates all the HTTP API calls into gRPC messages. This makes it an ideal database for Kubernetes.
etcd stores all objects under the /registry directory key in key-value format. For example, information on a pod named Nginx in the default namespace can be found under /registry/pods/default/nginx
Also, etcd it is the only Statefulset component in the control plane.
3. kube-scheduler
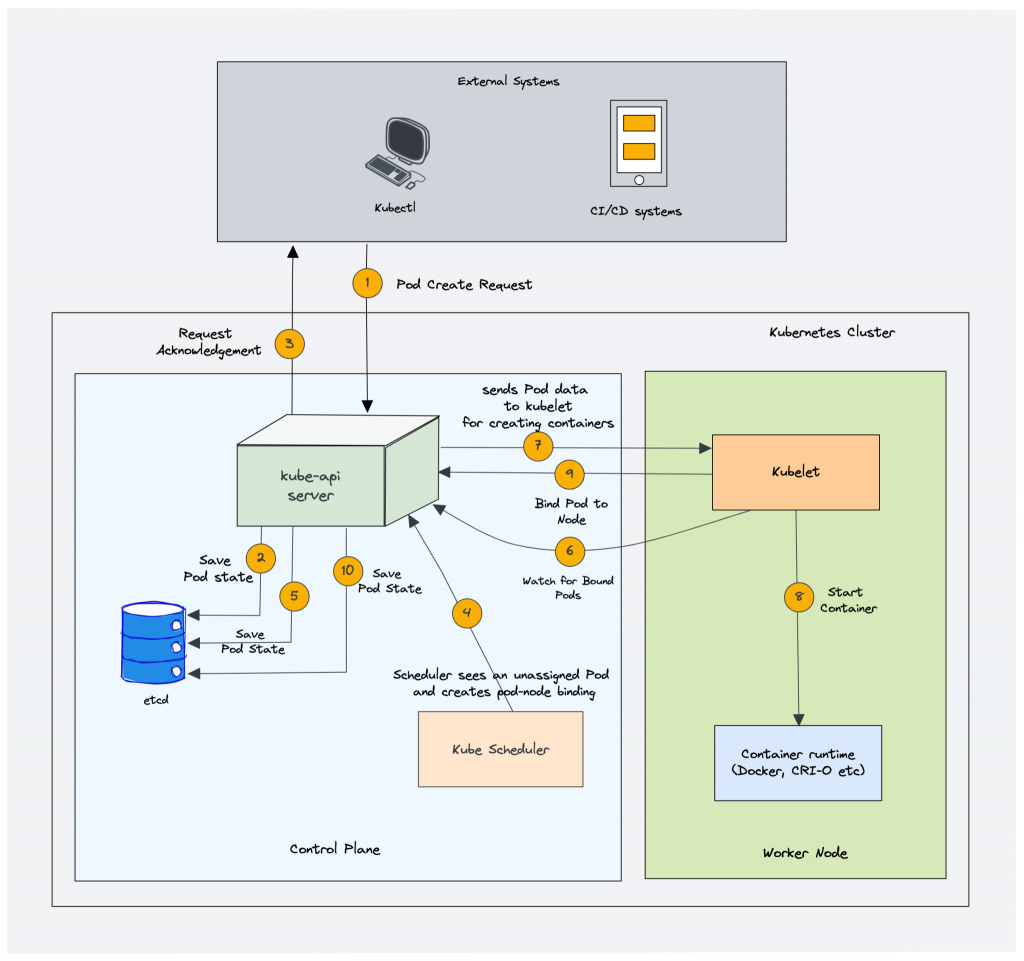
The kube-scheduler is responsible for scheduling Kubernetes pods on worker nodes.
When you deploy a pod, you specify the pod requirements such as CPU, memory, affinity, taints or tolerations, priority, persistent volumes (PV), etc. The scheduler’s primary task is to identify the create request and choose the best node for a pod that satisfies the requirements.
The following image shows a high-level overview of how the scheduler works.
In a Kubernetes cluster, there will be more than one worker node. So how does the scheduler select the node out of all worker nodes?
Here is how the scheduler works.
To choose the best node, the Kube-scheduler uses filtering and scoring operations.
In filtering, the scheduler finds the best-suited nodes where the pod can be scheduled. For example, if there are five worker nodes with resource availability to run the pod, it selects all five nodes. If there are no nodes, then the pod is unschedulable and moved to the scheduling queue. If It is a large cluster, let’s say 100 worker nodes, and the scheduler doesn’t iterate over all the nodes. There is a scheduler configuration parameter called percentageOfNodesToScore. The default value is typically 50%. So it tries to iterate over 50% of nodes in a round-robin fashion. If the worker nodes are spread across multiple zones, then the scheduler iterates over nodes in different zones. For very large clusters the default percentageOfNodesToScore is 5%.
In the scoring phase, the scheduler ranks the nodes by assigning a score to the filtered worker nodes. The scheduler makes the scoring by calling multiple scheduling plugins. Finally, the worker node with the highest rank will be selected for scheduling the pod. If all the nodes have the same rank, a node will be selected at random.
Once the node is selected, the scheduler creates a binding event in the API server. Meaning an event to bind a pod and node.
Here is shat you need to know about a scheduler.
It is a controller that listens to pod creation events in the API server.
The scheduler has two phases. Scheduling cycle and the Binding cycle. Together it is called the scheduling context.Thescheduling cycle selects a worker node and the binding cycle applies that change to the cluster.
The scheduler always places the high-priority pods ahead of the low-priority pods for scheduling. Also, in some cases, after the pod starts running in the selected node, the pod might get evicted or moved to other nodes. If you want to understand more, read the Kubernetes pod priority guide
You can create custom schedulers and run multiple schedulers in a cluster along with the native scheduler. When you deploy a pod you can specify the custom scheduler in the pod manifest. So the scheduling decisions will be taken based on the custom scheduler logic.
The scheduler has a pluggable scheduling framework. Meaning, that you can add your custom plugin to the scheduling workflow.
4. Kube Controller Manager
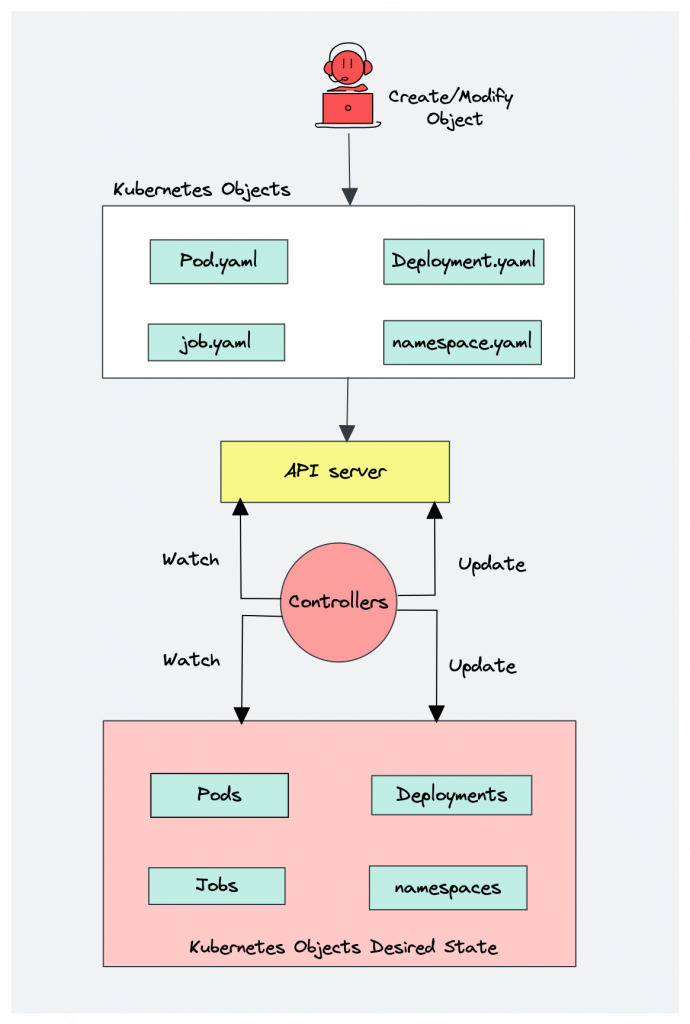
What is a controller? Controllers are programs that run infinite control loops. Meaning it runs continuously and watches the actual and desired state of objects. If there is a difference in the actual and desired state, it ensures that the kubernetes resource/object is in the desired state.
As per the official documentation,
In Kubernetes, controllers are control loops that watch the state of your cluster, then make or request changes where needed. Each controller tries to move the current cluster state closer to the desired state.
Let’s say you want to create a deployment, you specify the desired state in the manifest YAML file (declarative approach). For example, 2 replicas, one volume mount, configmap, etc. The in-built deployment controller ensures that the deployment is in the desired state all the time. If a user updates the deployment with 5 replicas, the deployment controller recognizes it and ensures the desired state is 5 replicas.
Kube controller manager is a component that manages all the Kubernetes controllers. Kubernetes resources/objects like pods, namespaces, jobs, replicaset are managed by respective controllers. Also, the Kube scheduler is also a controller managed by the Kube controller manager.
Following is the list of important built-in Kubernetes controllers.
Here is what you should know about the Kube controller manager.
It manages all the controllers and the controllers try to keep the cluster in the desired state.
You can extend kubernetes with custom controllers associated with a custom resource definition.
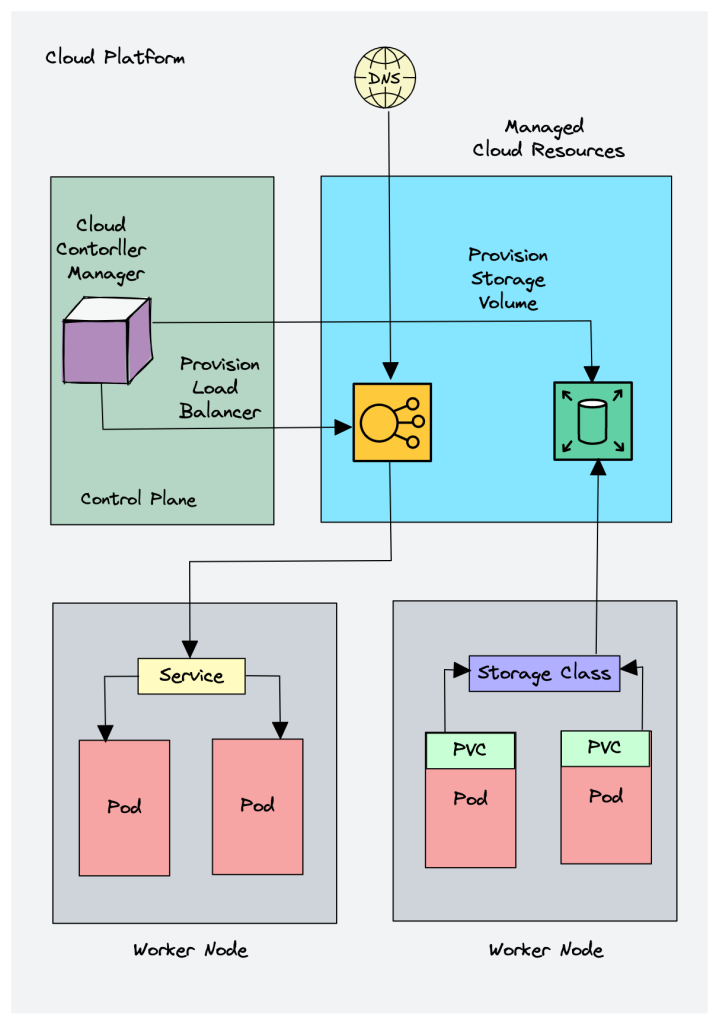
5. Cloud Controller Manager (CCM)
When kubernetes is deployed in cloud environments, the cloud controller manager acts as a bridge between Cloud Platform APIs and the Kubernetes cluster.
This way the core kubernetes core components can work independently and allow the cloud providers to integrate with kubernetes using plugins. (For example, an interface between kubernetes cluster and AWS cloud API)
Cloud controller integration allows Kubernetes cluster to provision cloud resources like instances (for nodes), Load Balancers (for services), and Storage Volumes (for persistent volumes).
Cloud Controller Manager contains a set of cloud platform-specific controllers that ensure the desired state of cloud-specific components (nodes, Loadbalancers, storage, etc). Following are the three main controllers that are part of the cloud controller manager.
Node controller: This controller updates node-related information by talking to the cloud provider API. For example, node labeling & annotation, getting hostname, CPU & memory availability, nodes health, etc.
Route controller: It is responsible for configuring networking routes on a cloud platform. So that pods in different nodes can talk to each other.
Service controller: It takes care of deploying load balancers for kubernetes services, assigning IP addresses, etc.
Following are some of the classic examples of cloud controller manager.
Deploying Kubernetes Service of type Load balancer. Here Kubernetes provisions a Cloud-specific Loadbalancer and integrates with Kubernetes Service.
Provisioning storage volumes (PV) for pods backed by cloud storage solutions.
Overall Cloud Controller Manager manages the lifecycle of cloud-specific resources used by kubernetes.
Kubernetes Worker Node Components
Now let’s look at each of the worker node components.
1. Kubelet
Kubelet is an agent component that runs on every node in the cluster. t does not run as a container instead runs as a daemon, managed by systemd.
It is responsible for registering worker nodes with the API server and working with the podSpec (Pod specification – YAML or JSON) primarily from the API server. podSpec defines the containers that should run inside the pod, their resources (e.g. CPU and memory limits), and other settings such as environment variables, volumes, and labels.
It then brings the podSpec to the desired state by creating containers.
To put it simply, kubelet is responsible for the following.
Creating, modifying, and deleting containers for the pod.
Responsible for handling liveliness, readiness, and startup probes.
Responsible for Mounting volumes by reading pod configuration and creating respective directories on the host for the volume mount.
Collecting and reporting Node and pod status via calls to the API server with implementations like cAdvisor and CRI.
Kubelet is also a controller that watches for pod changes and utilizes the node’s container runtime to pull images, run containers, etc.
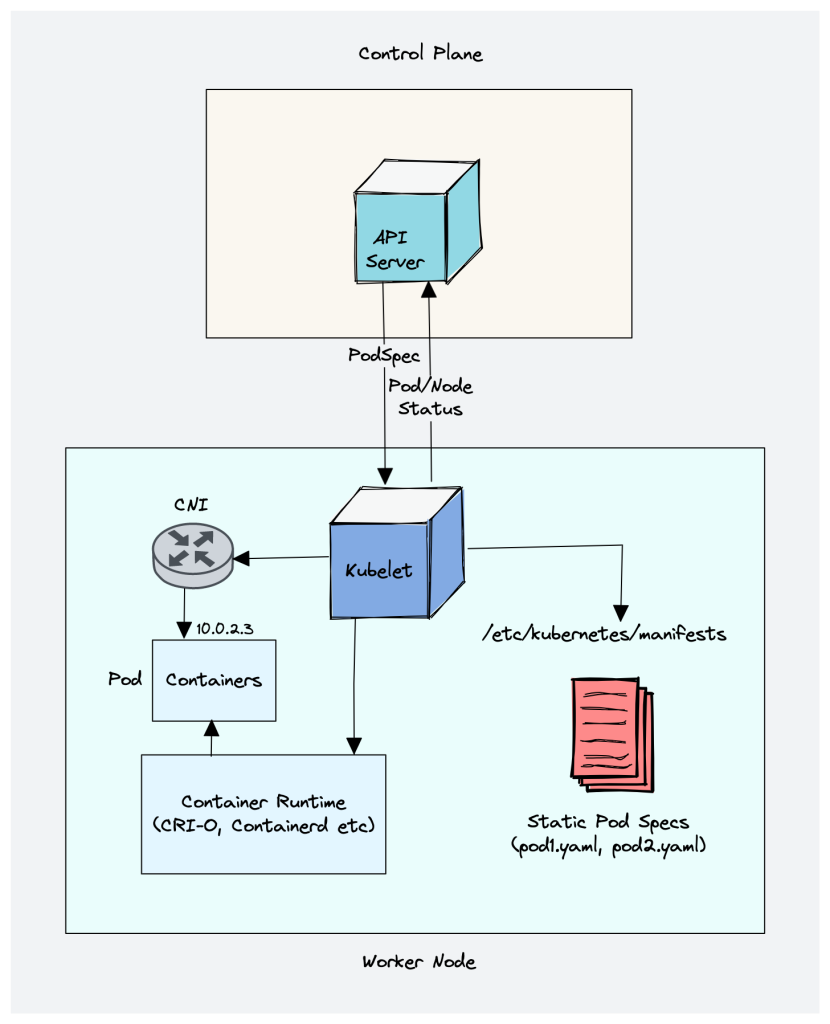
Other than PodSpecs from the API server, kubelet can accept podSpec from a file, HTTP endpoint, and HTTP server. A good example of “podSpec from a file” is Kubernetes static pods.
Static pods are controlled by kubelet, not the API servers.
This means you can create pods by providing a pod YAML location to the Kubelet component. However, static pods created by Kubelet are not managed by the API server.
Here is a real-world example use case of the static pod.
While bootstrapping the control plane, kubelet starts the api-server, scheduler, and controller manager as static pods from podSpecs located at /etc/kubernetes/manifests
Following are some of the key things about kubelet.
Kubelet uses the CRI (container runtime interface) gRPC interface to talk to the container runtime.
It also exposes an HTTP endpoint to stream logs and provides exec sessions for clients.
Uses the CSI (container storage interface) gRPC to configure block volumes.
It uses the CNI plugin configured in the cluster to allocate the pod IP address and set up any necessary network routes and firewall rules for the pod.
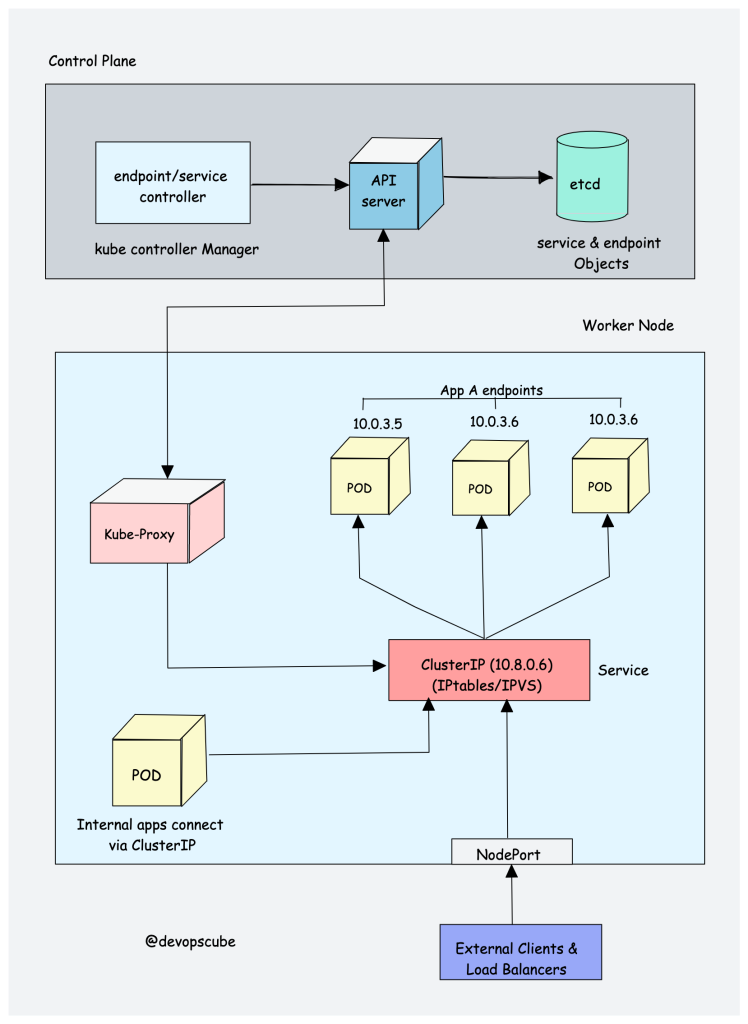
2. Kube proxy
To understand Kube proxy, you need to have a basic knowledge of Kubernetes Service & endpoint objects.
Service in Kubernetes is a way to expose a set of pods internally or to external traffic. When you create the service object, it gets a virtual IP assigned to it. It is called clusterIP. It is only accessible within the Kubernetes cluster.
The Endpoint object contains all the IP addresses and ports of pod groups under a Service object. The endpoints controller is responsible for maintaining a list of pod IP addresses (endpoints). The service controller is responsible for configuring endpoints to a service.
You cannot ping the ClusterIP because it is only used for service discovery, unlike pod IPs which are pingable.
Now let’s understand Kube Proxy.
Kube-proxy is a daemon that runs on every node as a daemonset. It is a proxy component that implements the Kubernetes Services concept for pods. (single DNS for a set of pods with load balancing). It primarily proxies UDP, TCP, and SCTP and does not understand HTTP.
When you expose pods using a Service (ClusterIP), Kube-proxy creates network rules to send traffic to the backend pods (endpoints) grouped under the Service object. Meaning, all the load balancing, and service discovery are handled by the Kube proxy.
So how does Kube-proxy work?
Kube proxy talks to the API server to get the details about the Service (ClusterIP) and respective pod IPs & ports (endpoints). It also monitors for changes in service and endpoints.
Kube-proxy then uses any one of the following modes to create/update rules for routing traffic to pods behind a Service
IPTables: It is the default mode. In IPTables mode, the traffic is handled by IPtable rules. This means that for each service, IPtable rules are created. These rules capture the traffic coming to the ClusterIP and then forward it to the backend pods. Also, In this mode, kube-proxy chooses the backend pod random for load balancing. Once the connection is established, the requests go to the same pod until the connection is terminated.
IPVS: For clusters with services exceeding 1000, IPVS offers performance improvement. It supports the following load-balancing algorithms for the backend.
rr: round-robin : It is the default mode.
lc: least connection (smallest number of open connections)
dh: destination hashing
sh: source hashing
sed: shortest expected delay
nq: never queue
Userspace (legacy & not recommended)
Kernelspace: This mode is only for Windows systems.
If you would like to understand the performance difference between kube-proxy IPtables and IPVS mode, read this article.
Also, you can run a Kubernetes cluster without kube-proxy by replacing it with Cilium.
3. Container Runtime
You probably know about Java Runtime (JRE). It is the software required to run Java programs on a host. In the same way, container runtime is a software component that is required to run containers.
Container runtime runs on all the nodes in the Kubernetes cluster. It is responsible for pulling images from container registries, running containers, allocating and isolating resources for containers, and managing the entire lifecycle of a container on a host.
To understand this better, let’s take a look at two key concepts:
Container Runtime Interface (CRI): It is a set of APIs that allows Kubernetes to interact with different container runtimes. It allows different container runtimes to be used interchangeably with Kubernetes. The CRI defines the API for creating, starting, stopping, and deleting containers, as well as for managing images and container networks.
Open Container Initiative (OCI): It is a set of standards for container formats and runtimes
Kubernetes supports multiple container runtimes (CRI-O, Docker Engine, containerd, etc) that are compliant with Container Runtime Interface (CRI). This means, all these container runtimes implement the CRI interface and expose gRPC CRI APIs (runtime and image service endpoints).
So how does Kubernetes make use of the container runtime?
As we learned in the Kubelet section, the kubelet agent is responsible for interacting with the container runtime using CRI APIs to manage the lifecycle of a container. It also gets all the container information from the container runtime and provides it to the control plane.
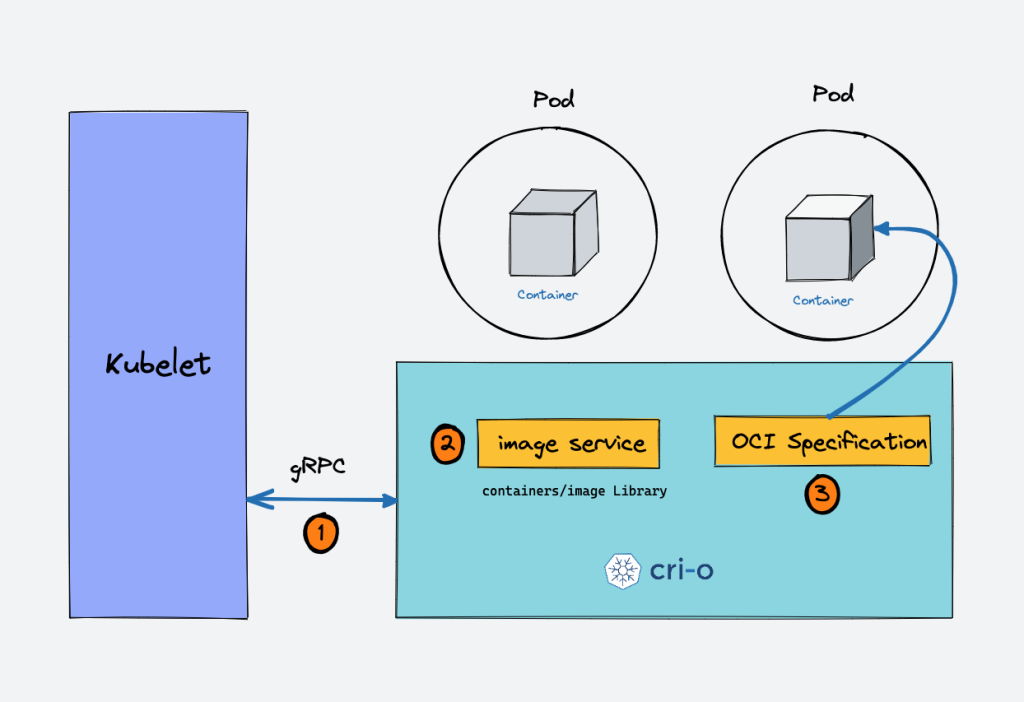
Let’s take an example of CRI-O container runtime interface. Here is a high-level overview of how container runtime works with kubernetes.
When there is a new request for a pod from the API server, the kubelet talks to CRI-O daemon to launch the required containers via Kubernetes Container Runtime Interface.
CRI-O checks and pulls the required container image from the configured container registry using containers/image library.
CRI-O then generates OCI runtime specification (JSON) for a container.
CRI-O then launches an OCI-compatible runtime (runc) to start the container process as per the runtime specification.
Kubernetes Cluster Addon Components
Apart from the core components, the kubernetes cluster needs addon components to be fully operational. Choosing an addon depends on the project requirements and use cases.
Following are some of the popular addon components that you might need on a cluster.
CNI Plugin (Container Network Interface)
CoreDNS (For DNS server): CoreDNS acts as a DNS server within the Kubernetes cluster. By enabling this addon, you can enable DNS-based service discovery.
Metrics Server (For Resource Metrics): This addon helps you collect performance data and resource usage of Nodes and pods in the cluster.
Web UI (Kubernetes Dashboard): This addon enables the Kubernetes dashboard to manage the object via web UI.
It is a plugin-based architecture with vendor-neutral specifications and libraries for creating network interfaces for Containers.
It is not specific to Kubernetes. With CNI container networking can be standardized across container orchestration tools like Kubernetes, Mesos, CloudFoundry, Podman, Docker, etc.
When it comes to container networking, companies might have different requirements such as network isolation, security, encryption, etc. As container technology advanced, many network providers created CNI-based solutions for containers with a wide range of networking capabilities. You can call it CNI-Plugins
This allows users to choose a networking solution that best fits their needs from different providers.
How does the CNI Plugin work with Kubernetes?
The Kube-controller-manager is responsible for assigning pod CIDR to each node. Each pod gets a unique IP address from the pod CIDR.
Kubelet interacts with container runtime to launch the scheduled pod. The CRI plugin which is part of the Container runtime interacts with the CNI plugin to configure the pod network.
CNI Plugin enables networking between pods spread across the same or different nodes using an overlay network.
Following are high-level functionalities provided by CNI plugins.
Pod Networking
Pod network security & isolation using Network Policies to control the traffic flow between pods and between namespaces.
Some popular CNI plugins include:
Calico
Flannel
Weave Net
Cilium (Uses eBPF)
Amazon VPC CNI (For AWS VPC)
Azure CNI (For Azure Virtual network)Kubernetes networking is a big topic and it differs based on the hosting platforms.
Kubernetes Native Objects
Till now we have learned about the core kubernetes components and how each component works.
All these components work towards managing the following key Kubernetes objects.
Pod
Namespaces
Replicaset
Deployment
Daemonset
Statefulset
Jobs & Cronjobs
Also, Kubernetes is extendable using CRDs, and Custom Controllers. So the cluster components also manage the objects created using custom controllers and custom resource definitions.
Kubernetes Architecture FAQs
What is the main purpose of the Kubernetes control plane?
The control plane is responsible for maintaining the desired state of the cluster and the applications running on it. It consists of components such as the API server, etcd, Scheduler, and controller manager.
What is the purpose of the worker nodes in a Kubernetes cluster?
Worker nodes are the servers (either bare-metal or virtual) that run the container in the cluster. They are managed by the control plane and receive instructions from it on how to run the containers that are part of pods.
How is communication between the control plane and worker nodes secured in Kubernetes?
Communication between the control plane and worker nodes is secured using PKI certificates and communication between different components happens over TLS. This way, only trusted components can communicate with each other.
What is the purpose of the etcd key-value store in Kubernetes?
Etcd primarily stores the kubernetes objects, cluster information, node information, and configuration data of the cluster, such as the desired state of the applications running on the cluster.
What happens to Kubernetes applications if the etcd goes down?
While the running applications will not be affected if etcd experiences an outage, it will not be possible to create or update any objects without a functioning etcd
Conclusion
Understanding Kubernetes architecture helps you with day-to-day Kubernetes implementation and operations.
When implementing a production-level cluster setup, having the right knowledge of Kubernetes components will help you run and troubleshoot applications.
Next, you can start with step-by-step kubernetes tutorials to get hands-on experience with Kubernetes objects and resources.
If you’re having trouble reading the directories in the $PATH variable, you can make use of the tr command to replace the colons with the newline characters so each directory is displayed on a single line.
Hello Debian users, are you looking to install the widely used LAMP Stack on your system? This will empower you to develop and deploy incredible websites.
If you’re interested, follow along with this comprehensive guide that outlines the installation process for LAMP on your Debian 12 system.
Contents :
What is LAMP?
Install Apache in Debian 12
Install MariaDB in Debian 12
Install PHP, Perl, and Python in Debian 12
Install PHP in Debian
Install Python in Debian
Install Python in Debian
Check PHP Info on Debian
Create a Virtual Hosting for a Website Using LAMP
Host a Website on LAMP Stack
Conclusion
What is LAMP?
LAMP is a combination of four powerful open-source tools (Linux, Apache, MariaDB, PHP) which aid in building and hosting websites and applications.
Linux (Debian 12) is a free, open-source operating system, Apache serves as the web server, MariaDB is a powerful database server and PHP is the programming language.
Before MariaDB, MySQL was used in the LAMP stack. However, some people argue about using Python or Perl in place of PHP now.
Let’s initiate the process of LAMP Stack installation on a fresh Debian 12 installation.
Install Apache in Debian 12
Begin by executing the provided apt command to refresh the local package repository cache, which will update the package lists and upgrade any installed packages:
$ sudo apt update && sudo apt upgrade -y
With your repositories and packages now up-to-date, proceed to install the Apache web server from the official repository:
$ sudo apt install apache2* -y
Install Apache in Debian
Now that Apache2 is installed on your system, verify its version by running the following command:
$ sudo apache2 -v
Server version: Apache/2.4.57 (Debian)
Server built: 2023-04-13T03:26:51
To initiate the service of your Apache2 web server, execute the ‘systemctl start‘ command provided below.
$ sudo systemctl start apache2
After initiating your web server service, you can also run the command to enable the Apache2 service to start automatically after a reboot:
$ sudo systemctl enable apache2
Moving forward, we can examine the status of the Apache2 service using the command below.
$ sudo systemctl status apache2
Check Apache Status
Next, you should configure your firewall to allow access to the Apache web server from any web browser:
$ sudo ufw allow 80
$ sudo ufw reload
Next, let’s check if our Apache2 server is running successfully. To do this, open any web browser and enter “http://localhost” in the address bar.
Check Apache Web Page
However, you can also access the Apache page by entering your server’s IP address or domain name:
http://your_server_ip/
OR
http://your_domain.com/
If you are unsure about your server’s IP address, run the ‘ip addr‘ command to locate it:
$ ip addr
Find Linux Server IP Address
Install MariaDB in Debian 12
MariaDB is a widely used, high-speed, open-source relational database system that assists users in storing and organizing their data.
To utilize the MariaDB database server, execute the provided command to install it:
$ sudo apt install mariadb-* -y
Install MariaDB in Debian
To view the version of the installed MariaDB server, type the following:
$ mariadb -V
mariadb Ver 15.1 Distrib 10.11.3-MariaDB, for debian-linux-gnu (x86_64) using EditLine wrapper
Next, initiate, enable, and verify the status of your MariaDB database server service:
$ sudo systemctl start mariadb
$ sudo systemctl enable mariadb
$ sudo systemctl status mariadb
Check MariaDB in Debian
Lastly, we will run the following command to ensure the security of our database server:
$ sudo mariadb-secure-installation
Note: The primary aim of this command is to generate robust passwords, eliminate anonymous users and unnecessary databases, and disable remote logins. However, you can customize the security settings of your database according to your preferences.
The terminal will present various questions. Read and respond to them correctly.
Secure MariaDB in Debian
After securing your database, log in to it by executing the provided command. The terminal will request your password. Enter the password you previously set for your database to successfully access your database server:
$ sudo mariadb -u root -p
Connect MySQL to Debian
After successfully logging into your database server, you can create and manage your databases. Since we have already set up Linux and installed Apache and MariaDB, we can finalize our LAMP stack installation by adding PHP.
Install PHP, Perl, and Python in Debian 12
Although the ‘P‘ in the LAMP stack traditionally stands for the PHP programming language, there is an ongoing discussion about potentially replacing it with Perl or Python.
In this context, we will install PHP, Python, and Perl.
Install PHP in Debian
To install PHP, execute the command provided below:
To verify the installed version of Python3, enter the following command:
$ python3 –version
Python 3.11.2
With our LAMP stack now fully configured and operational, let’s assess its functionality by hosting a PHP website on it.
Check PHP Info on Debian
Begin by creating a PHP file named “ubuntumint_test.php” within the Apache2 directory using the nano editor:
$ sudo nano /var/www/html/ubuntumint_test.php
Next, add the following line to the file, which will display comprehensive information about the PHP installation and configuration:
<?php phpinfo(); ?>
Now, open a web browser and enter the following URL to view your successfully deployed webpage using the LAMP stack:
http://localhost/ubuntumint_test.php
OR
http://your_server_ip/ubuntumint_test.php
OR
http://your_domain.com/ubuntumint_test.php
Check PHP Info in Debian
Here, we can observe that our sample website is hosted on an Apache web server. Continuing, we will thoroughly test the functionality of our LAMP Stack by creating a virtual host and deploying a PHP website on it, along with connecting to a MariaDB database.
Create a Virtual Hosting for a Website Using LAMP
Apache provides the capability to create virtual hosts, a feature that enables hosting multiple domains on a single server.
In Debian 12, the default configuration of Apache includes a server block designed to serve a single website, with its documents located in the “/var/www/html” directory.
However, if your intention is to host multiple websites on Apache, you can accomplish this by creating a new directory within the “/var/www/” directory using the “mkdir” command. This new directory should be named after your domain:
$ sudo mkdir /var/www/ubuntumint
Now that we’ve successfully created a directory named “ubuntumint”, let’s assign ownership of this directory to the “$USER” environment variable, as illustrated below:
$ sudo chown -R $USER:$USER /var/www/ubuntumint
Next, generate a new configuration file named “ubuntumint.conf” within the “sites-available” directory, which will guide Apache on how to handle the specified domain name:
In this new file, copy and paste the code provided below. Remember to modify the values of “ServerName”, “ServerAlias”, “DocumentRoot”, and “Directory” to match your domain settings:
Now that you’ve established a domain for your website, you can access your website by entering the following URL into your web browser.
http://your_domain.com/ubuntumint_test.php
Verify Virtual Hosting Domain
Observe that your website is successfully hosted on the custom domain instead of localhost. This demonstrates how to configure your Apache web server for hosting any website.
Host a Website on LAMP Stack
In this step, we will cover the configuration and testing of the MariaDB database server and PHP for website creation. Subsequently, we will proceed to host this website using the custom domain on the Apache web server.
Now connect to the MariaDB database server and create a new database named “umdatabase”:
$ sudo mariadb -u root -p
$ CREATE DATABASE umdatabase;
Create MySQL Database
After successfully creating a new database, proceed to create a new user named “neem” for all databases and set its password as “Pass123?”. If you encounter any errors, consult MariaDB’s password policy for guidance:
CREATE USER ‘neem’@’%’ IDENTIFIED BY ‘Pass123?’;
Next, provide the necessary or all privileges to this user by executing the “GRANT” command:
GRANT ALL PRIVILEGES ON umdatabase.* TO ‘neem’@’%’;
After granting permissions, it’s necessary to reload the privileges by executing the following command:
FLUSH PRIVILEGES;
Create Database User
Continuing, let’s generate a new PHP file named “lampUser.php” in the domain’s directory using the nano editor:
$ sudo nano /var/www/ubuntumint/lampUser.php
In this file, copy and paste the code provided below to create a website capable of storing data in the MariaDB database. This code will establish a connection to the database and display an error message if any issues arise during the connection:
<?php // Database connection parameters
$dbHost = “localhost”; // Replace with your database host
$dbUsername = “neem”; // Replace with your database username $dbPassword = “Pass123?”; // Replace with your database password $dbName = “umdatabase”; // Replace with your database name
// change your database connection parameters according to your system
// Create a database connection
$conn = new mysqli($dbHost, $dbUsername, $dbPassword, $dbName);
Save this file and open your web browser to test this PHP website, which can store data in the database table named “UMusers”:
http://your_domain/lampUser.php
Check the Website on the LAMP Stack
Let’s save some data using this website to verify if it will be stored in your MariaDB server or not:
$ sudo mariadb -u neem -p USE umdatabase;
SELECT * FROM UMusers;
Check Data on the Database
Conclusion
LAMP is a robust combination of four open-source tools that are essential for creating and hosting websites and applications. This article has presented a comprehensive guide for installing LAMP on Debian 12.