DNF aka Dandified YUM is a next generation Package Manager for RPM based Distribution. It was first introduced in Fedora 18 and it has replaced YUM utility in recent release of Fedora 22.
DNF aims at improving the bottlenecks of YUM viz., Performance, Memory Usages, Dependency Resolution, Speed and lots of other factors. DNF does Package Management using RPM, libsolv and hawkey library. Though it does not come per-installed in CentOS and RHEL 7 you can yum, dnf and use it alongside the yum.
You may like to read more about DNF here:
The latest stable release of DNF is 1.0 (at the time of writing of post) which was released on May 11, 2015. It (and all previous version of DNF) is mostly written in Python and is released under GPL v2 License.
Installation of DNF
DNF in not available in the default repository of RHEL/CentOS 7. However Fedora 22 ships with DNF implemented officially.
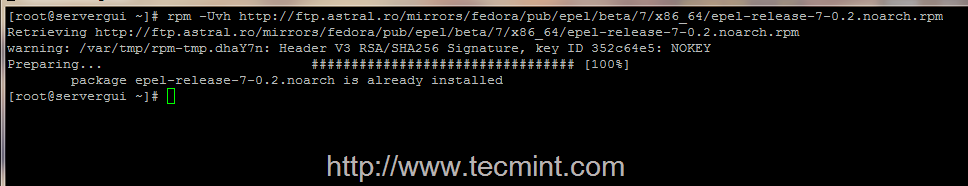
To install DNF on RHEL/CentOS systems, you need to first install and enable epel-release repository.
# yum install epel-release
OR
# yum install epel-release -y
Though it is not ethical to use ‘-y‘ with yum as it is recommended to see what is being installed in your system. However if this does not matter you much you may use ‘-y’ with yum to install everything automatically without user’s intervention.
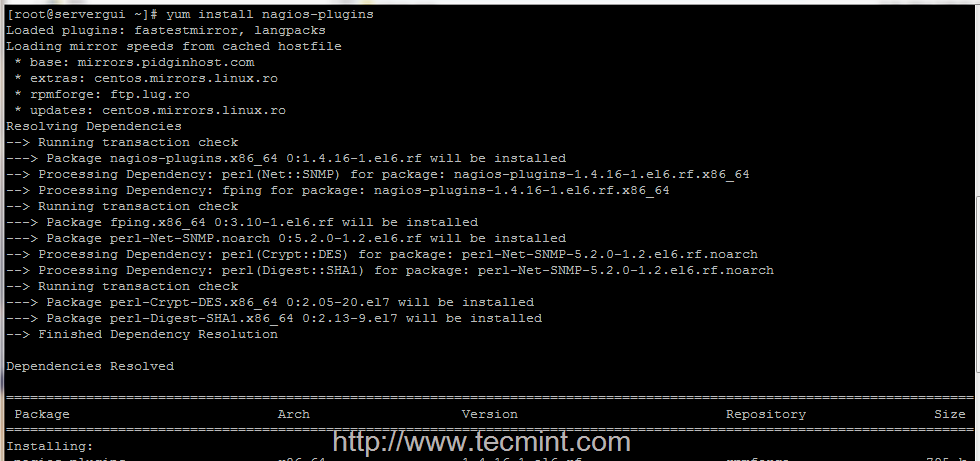
Next, install DNF package using yum command from epel-release repository.
# yum install dnf
After dnf installed successfully, it’s time to show you 27 practical usage of dnf commands with examples that will help you to manage packages in RPM based distribution easily and effectively.
1. Check DNF Version
Check the version of DNF installed on your System.
# dnf --version
2. List Enabled DNF Repositories
The option ‘repolist‘ with dnf command, will display all enabled repositories under your system.
# dnf repolist

3. List all Enabled and Disabled DNF Repositories
The option ‘repolist all‘ will print all the enabled/disabled repositories under your system.
# dnf repolist all
4. List all Available and Installed Packages using DNF
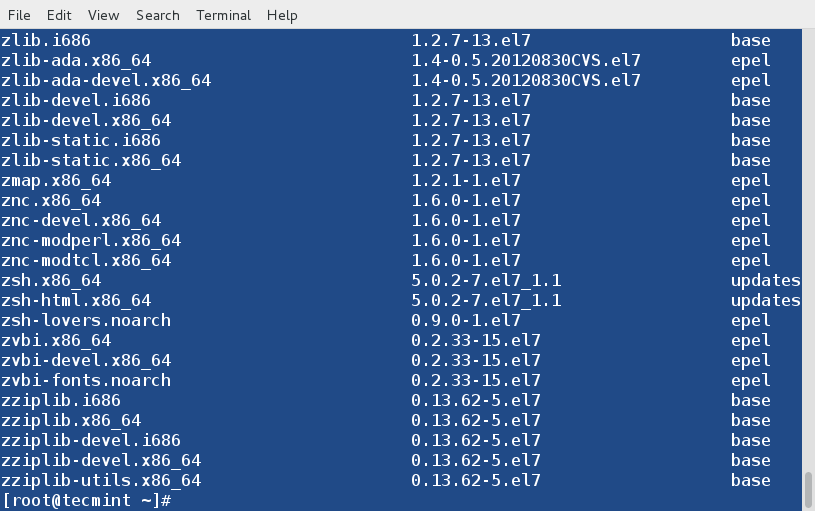
The command “dnf list” will list all the available packages from all the repositories and installed packages on your Linux system.
# dnf list

5. List all Installed Packages using DNF
While the “dnf list” command shows all the available/installed packages from all the repositories. However, you have the option to list only the installed packages using option “list installed” as shown below.
# dnf list installed

6. List all Available Packages using DNF
Similarly, the “list available” option, will list all the packages available to be installed from all the enabled repositories.
# dnf list available
7. Search for a Package using DNF
If incase, you’ve no idea about the package that you want install, in such situation you may use ‘search‘ option with dnf command to search for the package that matches the word or string (say nano).
# dnf search nano

8. See what Provides a file/sub-package?
The dnf option “provides” find the name of the package that provides specific file/sub-package. For example, if you would like to find what provides ‘/bin/bash‘ on your system?
# dnf provides /bin/bash

9. Get Details of a Package using DNF
Let’s assume you want to know the information of a package before installing it on the system, you may use “info” switch to get a detailed information about a package (say nano) as below.
# dnf info nano

10. Install a Package with DNF
To install a package called nano, just run the below command it will automatically resolve and install all required dependencies for package nano.
# dnf install nano

11. Updating a Package using DNF
You may update only a specific package (say systemd) and leave everything on the system untouched.
# dnf update systemd

12. Check for System Updates using DNF
Check updates for all the system packages installed into the system simply as.
# dnf check-update
13. Update All System Packages using DNF
You may update the whole system including all the installed packages with following commands.
# dnf update
OR
# dnf upgrade

14. Remove/Erase a Package using DNF
To remove or erase any unwanted package (say nano), you may use “remove” or “erase” switch with dnf command to remove it.
# dnf remove nano
OR
# dnf erase nano

15. Remove Orphan Packages using DNF
Those packages that were installed to satisfy dependency may be useless if not being used by other applications. To remove those orphan packages execute the below command.
# dnf autoremove

16. Remove Cached Packages using DNF
A lot of time we encounter out-of-date headers and unfinished transactions which results into error while executing dnf. We may clean all the cached packages and headers containing remote package information simply by executing.
# dnf clean all
17. Get Help on Specific DNF Command
You may get help of any specific dnf command (say clean) just by executing the below command.
# dnf help clean
18. List all DNF Commands and Options
To list help on all available dnf commands and option simply type.
# dnf help

19. View History of DNF
You may call dnf history to look at the list of already executed dnf commands. This way you can be aware of what was installed/removed with time stamp.
# dnf history
20. List all Group Packages
The command “dnf grouplist” will print all available or installed packages, if nothing is mentioned, it will list all known groups.
# dnf grouplist

21. Install a Group Package using DNF
To install a Group of packages bundled together as group package (say Educational Software) simply as.
# dnf groupinstall 'Educational Software'

22. Update a Group Package
Let’s update a Group Package (say Educational Software) by executing the below command.
# dnf groupupdate 'Educational Software'

23. Remove a Group Package
We can remove the group Package (say Educational Software) as.
# dnf groupremove 'Educational Software'
24. Install a Package from Specific Repository
DNF makes it possible to install any specific package (say phpmyadmin) from a repo (epel) as simply as,
# dnf --enablerepo=epel install phpmyadmin

25. Synchronize Installed Packages to Stable Release
The command “dnf distro-sync” will provides necessary options to synchronize all installed packages to most recent stable version available from any enabled repository. If no package is selected, all installed packages are synchronized.
# dnf distro-sync

26. Reinstall a Package
The command “dnf reinstall nano” will reinstall an already installed package (say nano).
# dnf reinstall nano

27. Downgrade a Package
The option “downgrade” will downgrades the named package (say acpid) to lower version if possible.
# dnf downgrade acpid
Sample Output
Using metadata from Wed May 20 12:44:59 2015
No match for available package: acpid-2.0.19-5.el7.x86_64
Error: Nothing to do.
My observation: DNF does not downgraded the package as it is supposed to. It has also been reported as bug.
Conclusion
DNF is the upper state of the end of the art Package Manager YUM. It tends to do a lot of processing automatically which is not going to be praised by many experienced Linux System Administrator, as I believe. As a matter of example:
--skip-brokenis not recognized by DNF and there is no alternative.- There is nothing like ‘resolvedep‘ command however you may run dnf provides.
- There is no ‘deplist‘ command to find package dependency.
- You exclude a repo, means the exclusion apply on all operations, unlike yum which excludes those repos only at the time of install and updates, etc.
Several Linux users are not happy the way Linux Ecosystem is moving. First Systemd removed init system v and now DNF will be replacing YUM sooner in Fedora 22 and later in RHEL and CentOS.
What do you think? are distributions and the whole Linux ecosystem is not valuing it’s users and moving against their will. Also it is often said in IT industry – “Why fix, If not broken?”, and neither init System V is broken nor YUM.
That’s all for now. Please let me know your valuable thoughts in the comments below. Like and share us and help us get spread.