How to Configure ‘Zabbix Monitoring’ to Send Email Alerts to Gmail Account – Part 2

If you are using Zabbix to monitor your infrastructure you might want to receive email alerts from your local domain somewhere on public internet domain, even if you don’t own a valid registered internet domain name with a mail server which you can configure on your own.

Configure Zabbix Mail Alerts

Configure Zabbix Mail Alerts – Part 2

This tutorial will briefly discuss you on how to setup Zabbix server to send mail reports to a Gmail address by using SSMTP program, without the need to install and configure any local MTA daemon, such as PostfixEximetc.

Requirements

  1. Install Zabbix Monitoring Server

Step 1: Install and Configure SSMTP

1. SSMTP is a small software, which does not fulfill any of the functionality of a mail server, but only delivers emails from a local machine to an external email address on a mailhub.

To install SSMTP program alongside with mailutils package that you will use it to send mails, issue the following command on your RedHat and Debian like server:

# yum install ssmtp mailx                    [On RHEL/CentOS 7] 
$ sudo apt-get install ssmtp mailutils       [On Debian 8]

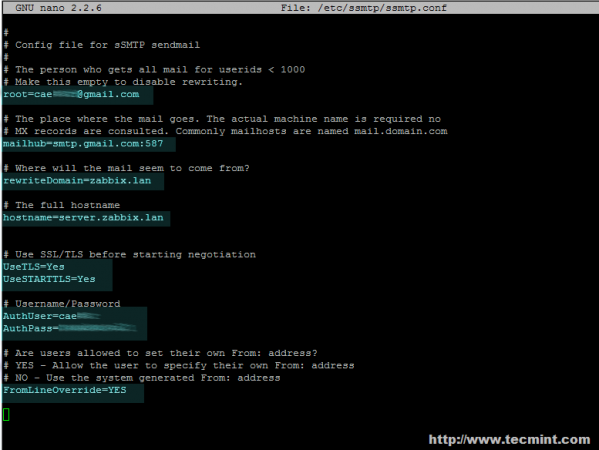
2. After the packages are installed on the system, configure SSMTP program to send local emails to your Gmailaccount by opening the main configuration file for editing with your favorite text editor and root privileges and use the following parameter settings:

# vi /etc/ssmtp/ssmtp.conf                   [On RHEL/CentOS 7]
$ sudo nano /etc/ssmtp/ssmtp.conf            [On Debian 8]

SSMTP settings for GMAIL account

root=gmail-username@gmail.com
mailhub=smtp.gmail.com:587
rewriteDomain=your_local_domain
hostname=your_local_FQDN
UseTLS=Yes
UseSTARTTLS=Yes
AuthUser=Gmail_username
AuthPass=Gmail_password
FromLineOverride=YES

Configure Zabbix Email Alerts

Configure Zabbix Email Alerts

Step 2: Gmail Tests for Zabbix Email Alerts

3. On the next step it’s time to send a local generated email to Gmail account by issuing the below command.

# echo "Body test email from 'hostname -f' "| mail -s "subject here" gmail_user@gmail.com

Gmail Tests

Gmail Tests

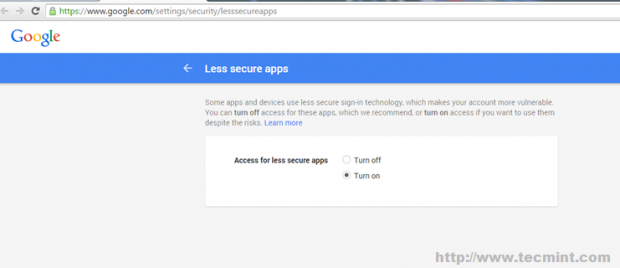
4. Normally, Gmail prevents different types of authentications to their servers from your account, so, in case you get the error “mail: cannot send message: Process exited with non-zero status”, then login to your Gmail account from browser and navigate to the following link https://www.google.com/settings/security/lesssecureapps in order to allow access for less secure apps as in the following screen.

Manage Secure Gmail Apps

Manage Secure Gmail Apps

5. After you have turned on Less Secure Apps feature on your Gmail account, run the above mail command again and verify your Inbox after a few seconds to check if the locally generated email has been successfully delivered – you should normally see the email has incoming from Gmail.

Mail Delivery Confirm

Mail Delivery Confirm

Step 3: Configure Zabbix Sendmail Script

6. Further, based on the $(which mail) command create the following Bash script to Zabbix alertscriptsdirectory with the following content and give it execute permissions:

# vi /usr/local/share/zabbix/alertscripts/zabbix-sendmail            [On RHEL/CentOS 7]
$ sudo nano /usr/local/share/zabbix/alertscripts/zabbix-sendmail     [On Debian 8]

Script content:

#!/bin/bash
echo "$3" | /usr/bin/mail -s "$2" $1

Configure Sendmail Zabbix

Configure Sendmail Zabbix

Next, set the execute permission on the script file.

# chmod +x /usr/local/share/zabbix/alertscripts/zabbix-sendmail

7. Next, as previously, test the script functionality by sending a local email to Gmail account. The way to run the script with positional parameters is explained above:

# /usr/local/share/zabbix/alertscripts/zabbix-sendmail gmail_username@gmail.com "Subject here" "Body of the message here"

Send Mail to Gmail Account from Linux

Send Mail to Gmail Account

Afterwards, verify Gmail Inbox and check if the new local message has arrived.

Verify Mail Delivery

Verify Mail Delivery

Step 4: Configure Zabbix to Send Alerts to Gmail

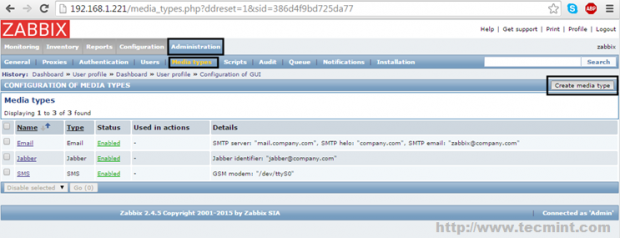
8. If the tests so far were successful, then you can move to next step and setup Zabbix to send generated email alerts to Gmail. First, login to Zabbix web interface and navigate to the following menu: Administration -> Media types -> Create media type.

Zabbix Administration

Zabbix Administration

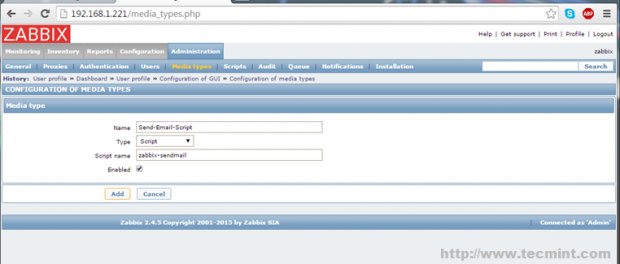
9. On the next screen enter an arbitrary Name to uniquely identify for the script in the Zabbix configurations (in this example Send-Email-Script is used), choose Script as Type from the list and enter the name of the Bash script created earlier (zabbix-sendmail used in this tutorial) to send email from command line (don’t use the path for the script, only the script name). When you’re done, hit the Add button below to reflect changes.

Create Zabbix Email Alerts

Create Zabbix Email Alerts

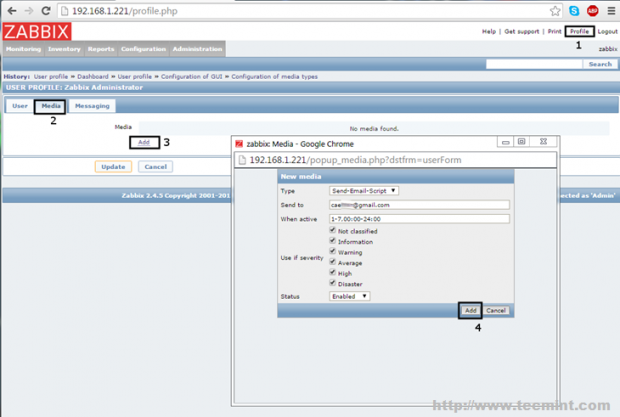
10. Further, let’s configure an email address to which you will send Zabbix alerts. Go to Profile -> Media -> Addand a new pop-up window should appear.

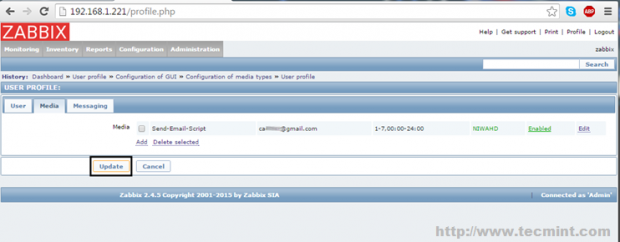
Here, select the name of the script that you have earlier named (in this example Send-Email-Script is used) for Type, enter the Gmail address to which you will send emails, choose the time period (week, hours) when email reports should be active for sending, choose the severity of the messages that you want to receive on your Gmail address, select Enabled as Status and hit the Add button to add the media. Finally hit the Update button to apply configuration.

Configure Zabbix Mail Address

Configure Zabbix Mail Address

Zabbix Update Configuration

Zabbix Update Configuration

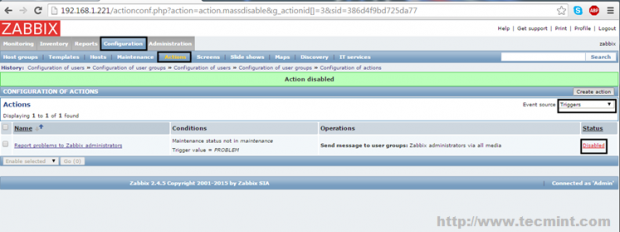
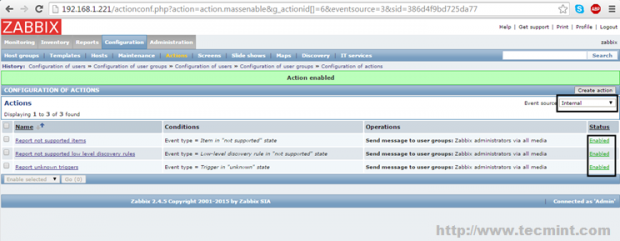
11. On the next step, enable the defult zabbix alerts by navigating to Configuration -> Actions, select as the Event Source – > Triggers from the right menu and hit on Disabled Status in order to enable it. Repeat the step for Event Source – > Internal or other custom created Actions and you’re done.

Enable Default Zabbix Mail Alert

Enable Default Zabbix Mail Alert

Zabbix Enabled Actions

Zabbix Enabled Actions

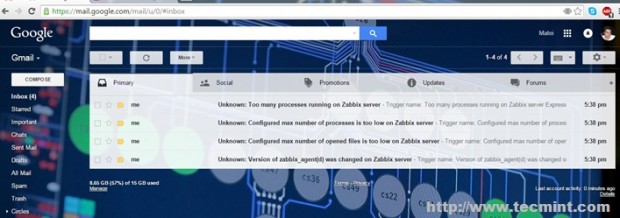
Wait for a while for Zabbix to start gather information and generate some reports, then verify your Gmail Inboxand you should see some Zabbix alerts submitted so far.

Zabbix Monitoring Mail Alerts

Zabbix Monitoring Mail Alerts

That’s all! Although this guide was mainly focused on sending Zabbix alerts to a Gmail account using Gmail SMTP server as a mailhub, using the same configuration you can, also, push zabbix email alerts further to other valid internet email accounts by relying on Gmail to route your emails through SMTP servers.

Source

How to Install Zabbix 3.4 on RHEL/CentOS and Debian/Ubuntu – Part 1.

Zabbix is an Open Source, high-level enterprise software designed to monitor and keep track of networks, servers and applications in real time. Build in a server-client model, Zabbix can collect different type of data than are used to create historical graphics and output performance or load trends of the monitored targets.

The server has the ability to check standard networking services (HTTPFTPSMTPIMAP etc) without the need to install extra software on the monitored hosts.

However, in order to gather data and create statistics about local services or other specific system resources that run on remote instances, such as CPU, disks, internal system process, RAM, etc, you need to install and configure a Zabbix agent.

Following are the 4-article series about Zabbix Monitoring application:

Part 1Installing and Configuring Zabbix 3.4 on Debian/Ubuntu and RHEL/CentOS 7

This tutorial will focus on how to install latest version of Zabbix 3.4 Server on Debian/Ubuntu and RHEL/CentOS 7 with MySQL/MariaDB backend database to store collected data, PHP and Apache Web Server as the mainly web interface.

Important: The given Zabbix instructions also works on all Debian derivatives and RedHat based systems like RHEL/CentOS and Fedora.

Step 1: Install Apache Web Server and PHP

1. First, install Apache Web Server alongside with PHP and its extensions in order to provide the web backed functionality for Zabbix Server by issuing the following command.

--------------- On Debian/Ubuntu --------------- 
$ sudo apt-get install apache2 php7.0 php7.0-mysql php7.0-ldap php7.0-bcmath php7.0-mbstring php7.0-gd php7.0-xml php7.0-mcrypt

--------------- On CentOS/RHEL ---------------
# yum -y install epel-release
# yum install httpd php php-mysql php-ldap php-bcmath- php-mbstring php-gd php-xml php-mcrypt		

2. Next, you need to tune PHP interpreter and adjust some values in order to run Zabbix Server. So, open Apache php.ini configuration file for editing by issuing the following command:

$ sudo nano /etc/php/7.0/apache2/php.ini 	[On Debian/Ubuntu] 
# vi /etc/php.ini				[On RHEL/CentOS 7]

Now, search with CTRL+C and replace the following PHP values as it follows:

max_execution_time 300
memory_limit 128M
always_populate_raw_post_data -1
session.auto_start = 0
mbstring.func_overload = 0
date.timezone = Europe/Bucharest

Replace the date.timezone variable according to your server geographical location. A list of PHP supported Timezones can be found here http://php.net/manual/en/timezones.php.

3. After updating PHP configuration file, restart Apache daemon to reflect changes by issuing the following command.

$ sudo systemctl restart apache2.service	 [On Debian/Ubuntu] 
# systemctl restart httpd.service		 [On RHEL/CentOS 7]

Step 2: Install MariaDB Database and Library

4. On the next step install MariaDB database and MySQL development library from binary packages. As MariaDB installs on your system you will be asked to set a password for the database root user during installation (Only on Debian 8/9). Choose a strong password, repeat it and wait for the installation to finish.

$ sudo apt-get install mariadb-server mariadb-client libmysqld-dev	 [On Debian/Ubuntu] 
# yum install mariadb-server mariadb-client mariadb-devel	         [On RHEL/CentOS 7]

Set MySQL root Password

Set MySQL root Password

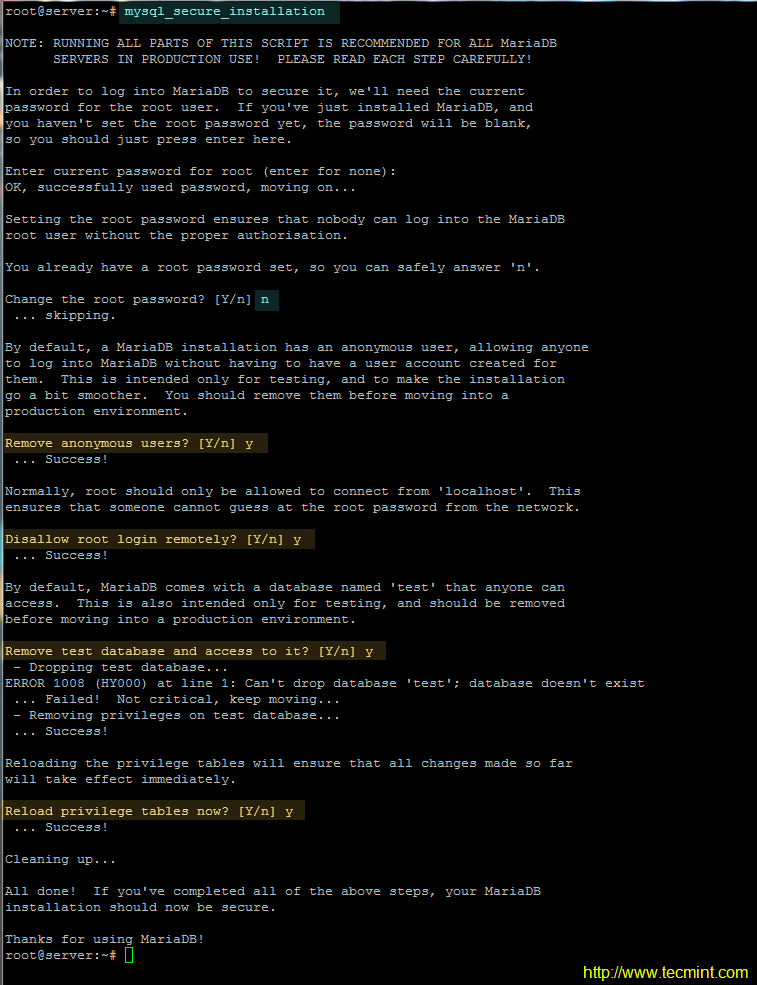
5. When the installation of Mariadb finishes, secure the database by issuing mysql_secure_installationcommand with system root privileges ( answer with yes for removing anonymous users, disable root login remotely, remove test database and access to it and apply all changes).

# mysql_secure_installation

Use the below screenshot as a guide.

Secure MySQL Installation

6. The next requirement for Zabbix is setting-up a RDBMS database. Log in to your LAMP stack database component (MySQL or MariaDB) and create a Zabbix database and the credentials required to manage the database, by issuing the following commands.

Make sure you replace database name, user and password to match your own settings.

# mysql -u root -p
MariaDB [(none)]> create database zabbixdb character set utf8 collate utf8_bin;
MariaDB [(none)]> grant all privileges on zabbixdb.* to 'zabbixuser'@'localhost' identified by 'password1';
MariaDB [(none)]> flush privileges;
MariaDB [(none)]> exit

Step 3: Install Zabbix Server

7. Now, start to install Zabbix server and Zabbix PHP frontend application by adding the official Zabbix repositories to your system package manager by issuing the following commands with root privileges.

Install Zabbix on Debian

# wget http://repo.zabbix.com/zabbix/3.4/debian/pool/main/z/zabbix-release/zabbix-release_3.4-1+stretch_all.deb 
# dpkg -i zabbix-release_3.4-1+stretch_all.deb
# apt update
# apt install zabbix-server-mysql zabbix-frontend-php 

Install Zabbix on Ubuntu

# wget http://repo.zabbix.com/zabbix/3.4/ubuntu/pool/main/z/zabbix-release/zabbix-release_3.4-1+xenial_all.deb 
# dpkg -i zabbix-release_3.4-1+xenial_all.deb
# apt-get update
# apt install zabbix-server-mysql zabbix-frontend-php 

Install Zabbix on CentOS

# rpm -ivh http://repo.zabbix.com/zabbix/3.4/rhel/7/x86_64/zabbix-release-3.4-2.el7.noarch.rpm
# yum install zabbix-server-mysql zabbix-web-mysql

If you want to download and compile an older version, please visit Zabbix official Sourceforge repositories.

8. Next, issue the below command with root privileges in order to install Zabbix agent in your system. Zabbix client will be used to actively monitor server’s local system resources.

# apt install zabbix-agent    [On Debian/Ubuntu] 
# yum install zabbix-agent    [On RHEL/CentOS 7] 

9. On the next step, restart Apache HTTP server in order to apply Zabbix configuration file installed for Apache.

# systemctl restart apache2   [On Debian/Ubuntu] 
# systemctl restart httpd     [On RHEL/CentOS 7] 
# setenforce 0                [Disable SELinux on RHEL/CentOS 7] 

Step 4: Configure Zabbix Server and Agent

10. Before configuring the server, first, import Zabbix initial database schema to MySQL database. Import the schema against the database created for Zabbix application, by issuing the below command.

# zcat /usr/share/doc/zabbix-server-mysql/create.sql.gz | mysql -u zabbixuser zabbixdb -p

11. On the next step, setup Zabbix server by opening the main configuration file for editing with the following command.

# nano /etc/zabbix/zabbix_server.conf

In zabbix_server.conf file search and modify the following lines as presented in the below excerpt. Update the variables to reflect your own database settings.

DBHost=localhost
DBName=zabbixdb
DBUser=zabbixuser
DBPassword=password1

12. Finally, save and close Zabbix server configuration file by pressing Ctrl+o and Ctrl+x file and restart Zabbix daemon to apply changes by issuing the below command.

# systemctl restart zabbix-server.service

13. Next, configure Zabbix Agent configuration file by updating the following lines. First, open the file for editing.

# nano /etc/zabbix/zabbix_agentd.conf 

Zabbix agent configuration file excerpt:

Server=127.0.0.1
ListenPort=10050

14. Save and close Zabbix agent configuration file and restart Zabbix Agent to reflect changes by issuing the following command.

# systemctl restart zabbix-agent.service 

Step 5: Install and Configure Zabbix Frontend Interface

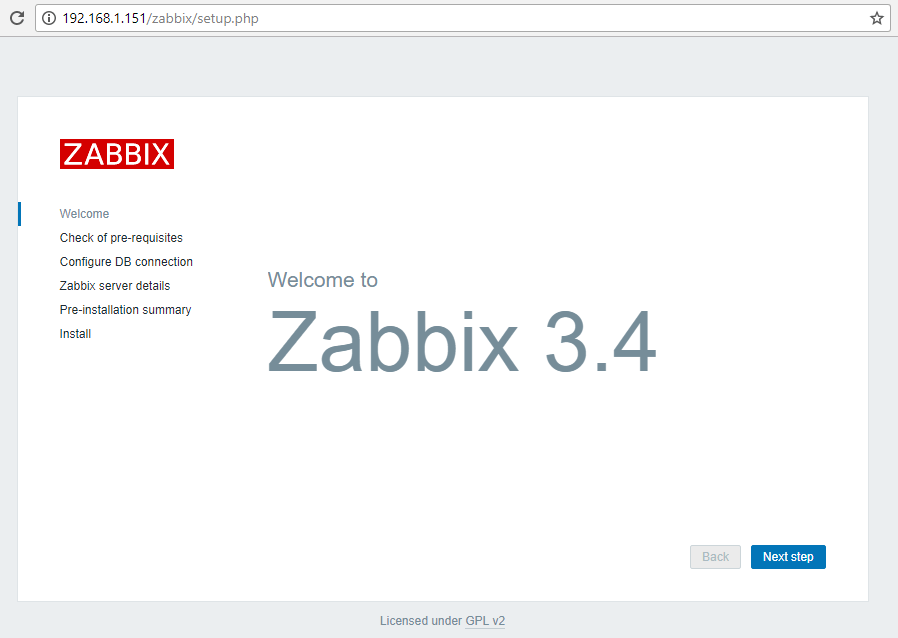
15. Now it’s time to install Zabbix Server Frontend web interface. In order to accomplish this step open a browser and navigate to your server IP Address using HTTP or HTTPS protocol and the welcome screen should appear. Hit the Next button to move forward.

http://192.168.1.151/zabbix/setup.php
OR
https://192.168.1.151/zabbix/setup.php

On the first welcome screen, just hit the Next step button to move to the new step of the installation process.

Zabbix Welcome Screen

Zabbix Welcome Screen

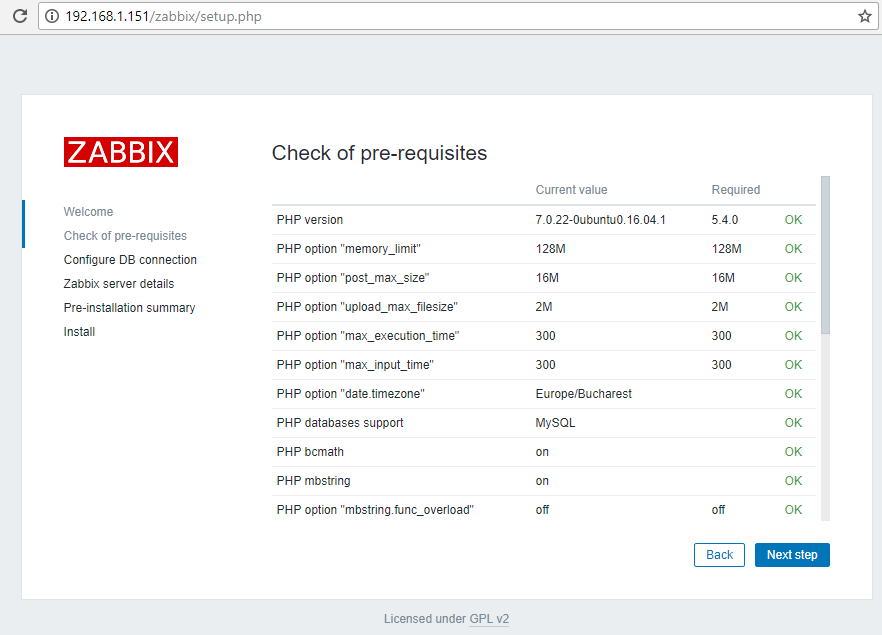
16. After a series of checks, if all pre-requires values are satisfied, hit the Next button to proceed further.

Check Zabbix Pre-Requisites

Check Zabbix Pre-Requisites

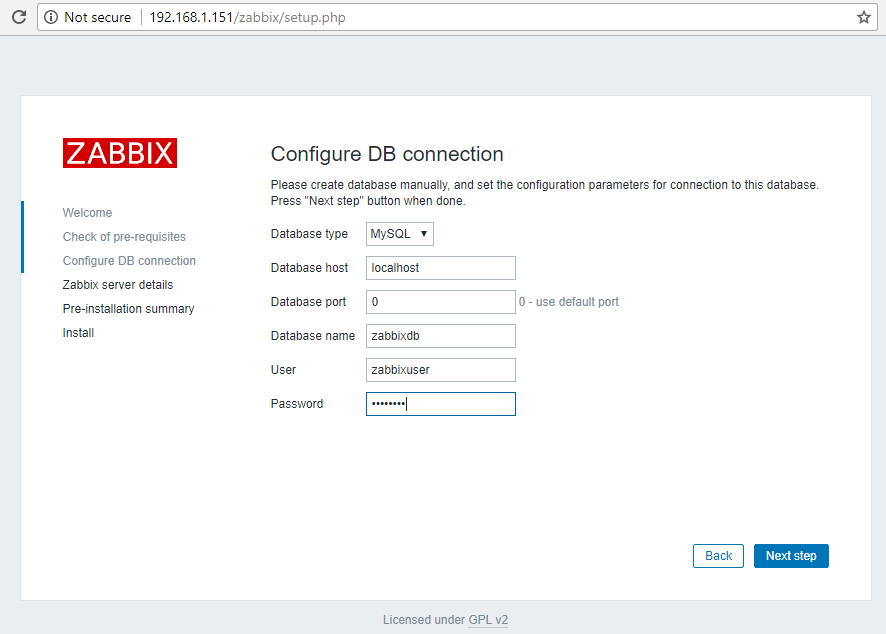
17. On the next step provide the settings for MySQL database, hit the Test connection button to test MySQL connectivity and move to the step by pressing the Next button.

Zabbix DB Configuration

Zabbix DB Configuration

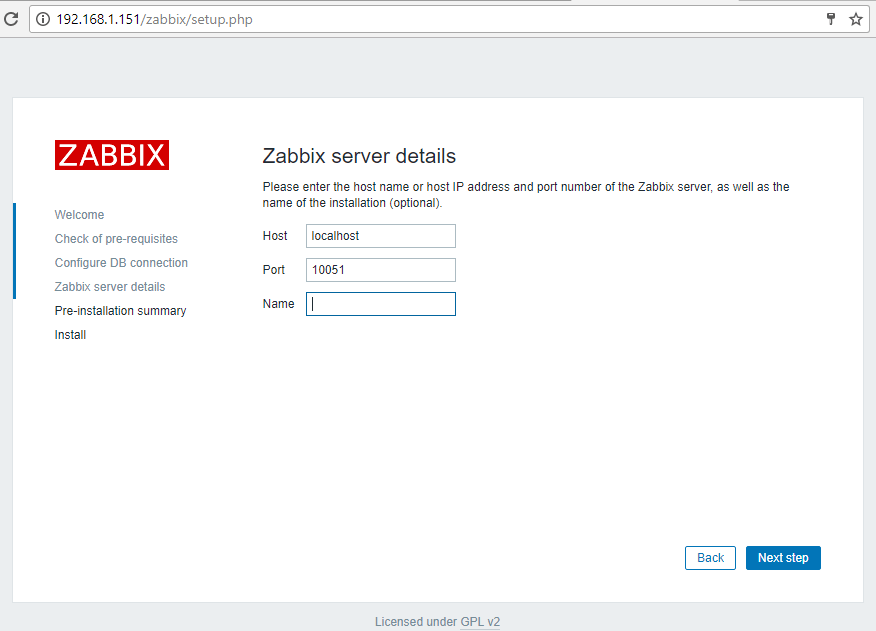
18. Next, supply the Host (or IP Address) and the Port of the Zabbix server (use the host localhost and the port 10051 because zabbix server is configured to run on the same host as the zabbix frontend web interface in this tutorial) and a Name for Zabbix frontend installation. When you’re done hit Next to continue.

Zabbix Server Details

Zabbix Server Details

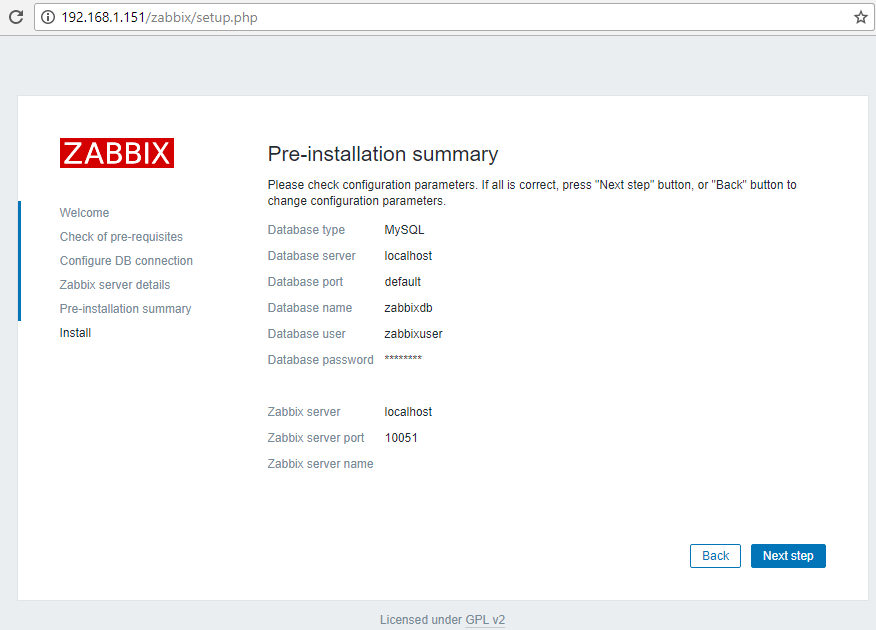
19. Next, check all the configurations parameters, enter command line and issue the following command to grant zabbix permissions to write the apache web configuration file in conf directory.

Then switch back to web interface and hit Next button to write zabbix configuration file.

# chown -R www-data /var/www/html/conf/		[on Debian 8]
# chown -R apache /var/www/html/conf/		[on RHEL/CentOS 7]

Zabbix Pre-Installation Summary

Zabbix Pre-Installation Summary

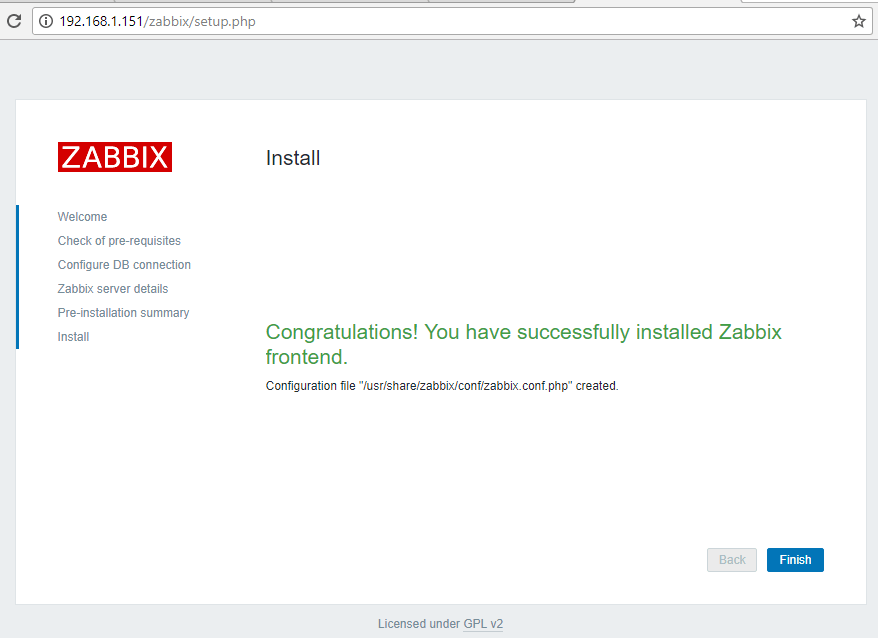
20. After the installation process completes, a congratulations message will appear in your browser. Hit on Finish button to exit Zabbix frontend installer.

Zabbix Installation Completed

Zabbix Installation Completed

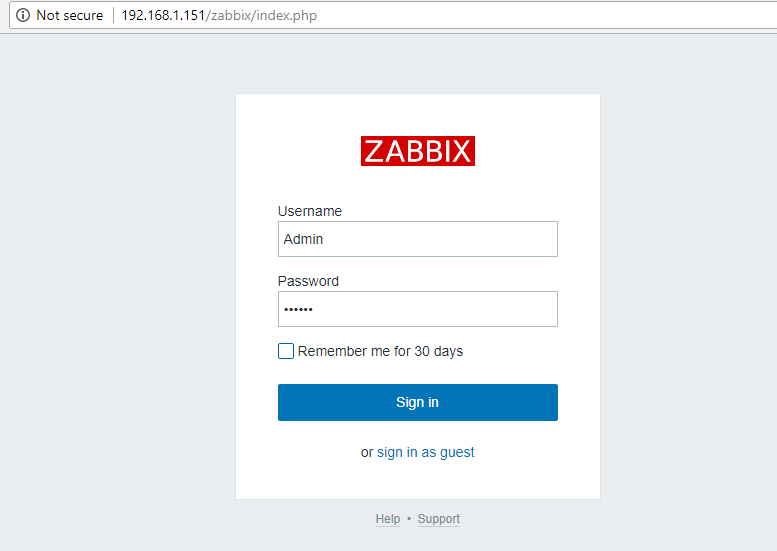
21. Finally, navigate to your server IP address or domain name by appending /zabbix URL address and log in to Zabbix web admin panel with the default credentials presented below.

https://your_domain.tld/zabbix/ 
Username: Admin
Password: zabbix

Zabbix Admin Login

Zabbix Admin Login

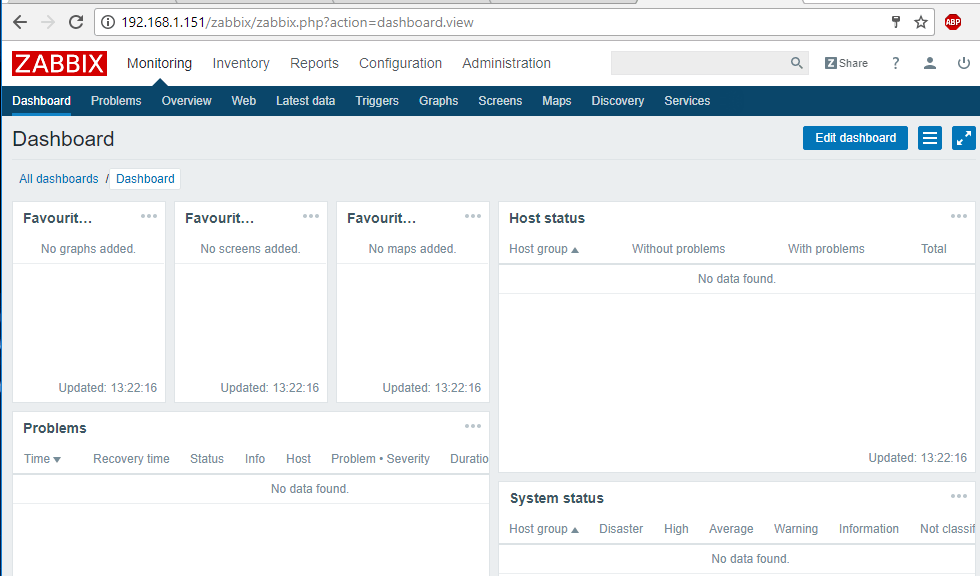
22. After you’ve logged in to Zabbix admin panel, you can start to configure Zabbix and add new network resources to be monitored by Zabbix server.

Zabbix Dashboard

Zabbix Dashboard

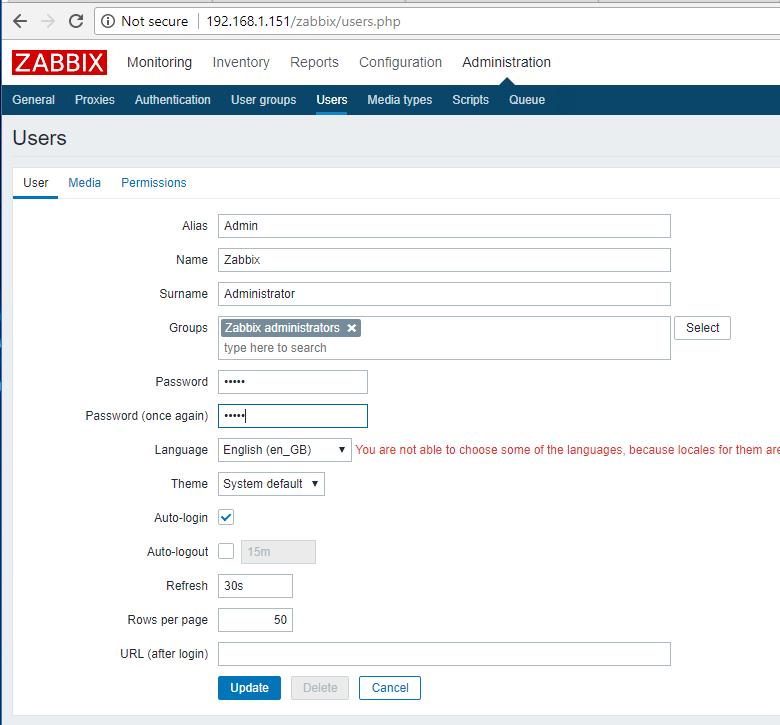
23. To change Zabbix frontend admin account password, navigate to Administration -> Users –> User and hit on Change password button and add your new password, as illustrated in the below screenshot. Finally, hit on the bottom Update button in order to save admin account new password.

Change Zabbix Admin Password

Change Zabbix Admin Password

That’all! On the next series concerning Zabbix monitoring system will discuss how to setup the server further using the web interface and how to install and configure Zabbix agents on different Linux distributions or even Windows systems.

Source

Cockpit – A Powerful Tool to Monitor and Administer Multiple Linux Servers Using a Web Browser

Cockpit is an easy-to-use, lightweight and simple yet powerful remote manager for GNU/Linux servers, it’s an interactive server administration user interface that offers a live Linux session via a web browser.

It can run on several Linux distributions including DebianUbuntuFedoraCentOSRHELArch Linux among others.

Cockpit makes Linux discoverable thereby enabling system administrators to easily and reliably carry out tasks such as starting containers, managing storage, network configurations, log inspections coupled with several others.

Suggested Read: 20 Command Line Tools to Monitor Linux Performance

While using it, users can easily switch between the Linux terminal and web browser without any hustles. Importantly, when a user starts a service via Cockpit, it can be stopped via the terminal, and just in case of an error that occurs in the terminal, it is shown in the Cockpit journal interface.

Features of Cockpit:

  1. Enables managing of multiple servers in one Cockpit session.
  2. Offers a web-based shell in a terminal window.
  3. Containers can be managed via Docker.
  4. Supports efficient management of system user accounts.
  5. Collects system performance information using Performance Co-Pilot framework and displays it in a graph.
  6. Supports gathering of system configuration and diagnostic information using sos-report.
  7. Also supports Kubernetes cluster or an Openshift v3 cluster.
  8. Allows modification of network settings and many more.

How to Install Cockpit in Linux Systems

You can install Cockpit in all Linux distributions from their default official repositories as shown:

Install Cockpit on Fedora and CentOS

To install and enable Cockpit on Fedora distributions, use the following commands.

# yum install cockpit
# systemctl enable --now cockpit.socket
# firewall-cmd --add-service=cockpit
# firewall-cmd --add-service=cockpit --permanent

Install Cockpit on RHEL

Cockpit is added to the Red Hat Enterprise Linux Extras repository from versions 7.1 and later:

# subscription-manager repos --enable rhel-7-server-extras-rpms
# systemctl enable --now cockpit.socket
# firewall-cmd --add-service=cockpit
# firewall-cmd --add-service=cockpit --permanent

Install Cockpit on Debian

Cockpit is not included in Debian official repositories, but you install it using following repository that contains weekly builds specially for Debian unstable:

First add the following repository to /etc/apt/sources.list file.

deb https://fedorapeople.org/groups/cockpit/debian unstable main

Next, import Cockpit’s signing key and then run the following series of commands to install it.

$ sudo apt-key adv --keyserver sks-keyservers.net --recv-keys F1BAA57C
$ sudo apt-get update
$ sudo apt-get install cockpit
$ sudo systemctl enable --now cockpit.socket

Install Cockpit on Ubuntu and Linux Mint

In Ubuntu and Linux Mint distributions, Cockpit is not included, but you can install it from official Cockpit PPA by executing the following commands:

$ sudo add-apt-repository ppa:cockpit-project/cockpit
$ sudo apt-get update
$ sudo apt-get install cockpit
$ sudo systemctl enable --now cockpit.socket

Install Cockpit on Arch Linux

Arch Linux users can install Cockpit from the Arch User Repository using following command.

# yaourt cockpit
# systemctl start cockpit
# systemctl enable cockpit.socket

How to Use Cockpit in Linux

After Cockpit installed successfully, you can access it using a web browser at the following locations.

https://ip-address:9090
OR
https://server.domain.com:9090

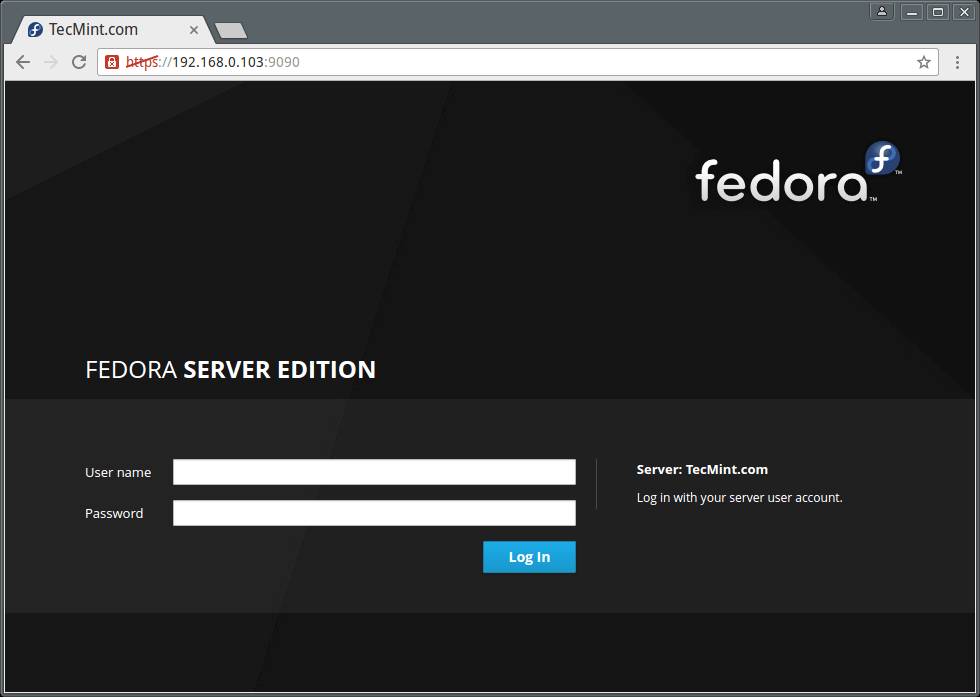
Enter system username and password to login in the interface below:

Cockpit Web Interface

Cockpit Web Interface

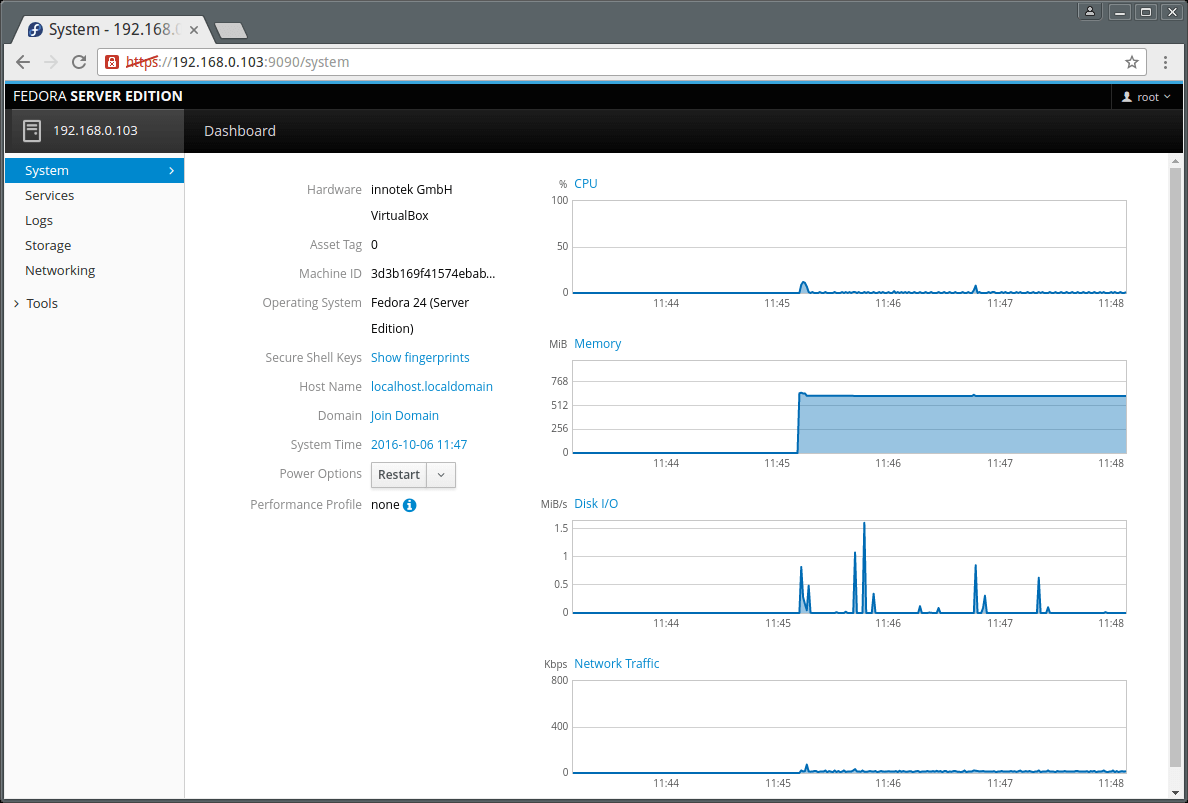
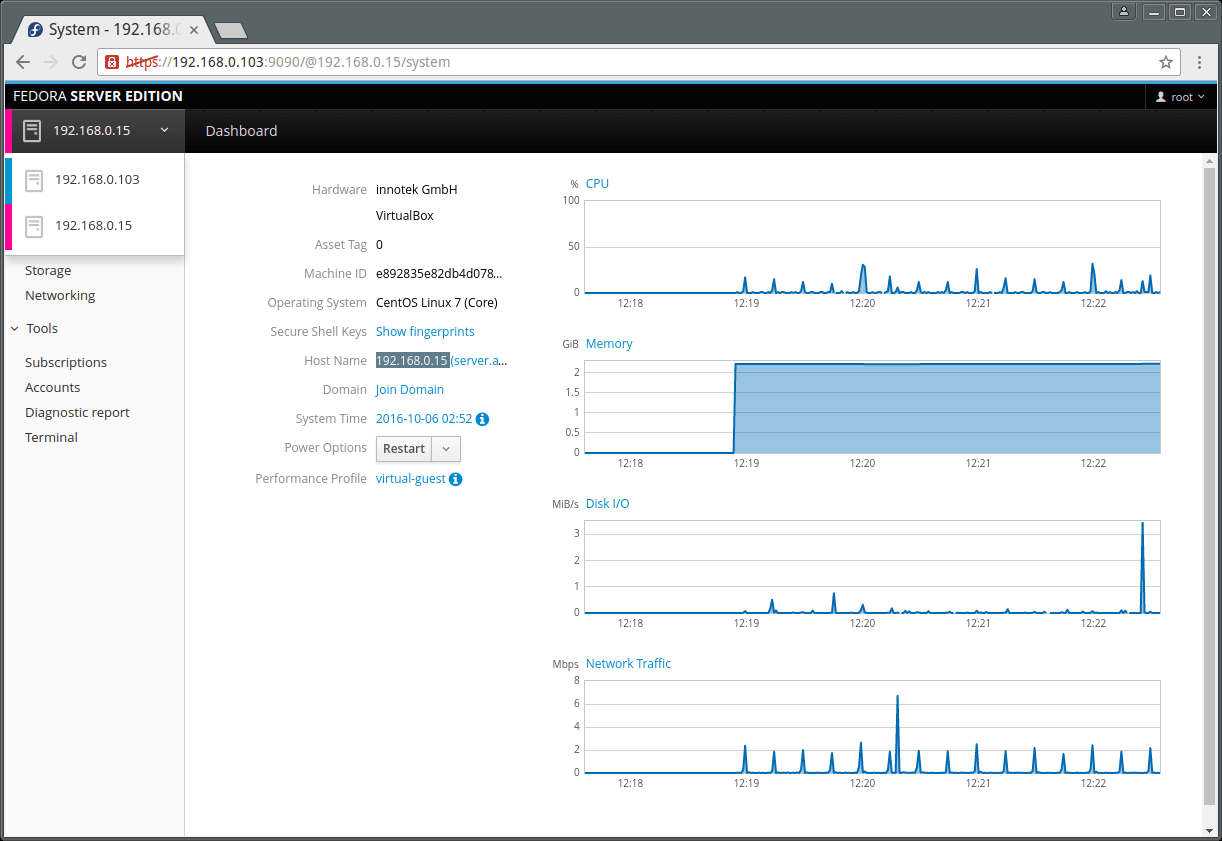
After logging in, you will be presented with a summary of your system information and performance graphs for CPUMemoryDisk I/O, and Network traffic as seen in the next image:

Linux System Performance Summary

Linux System Performance Summary

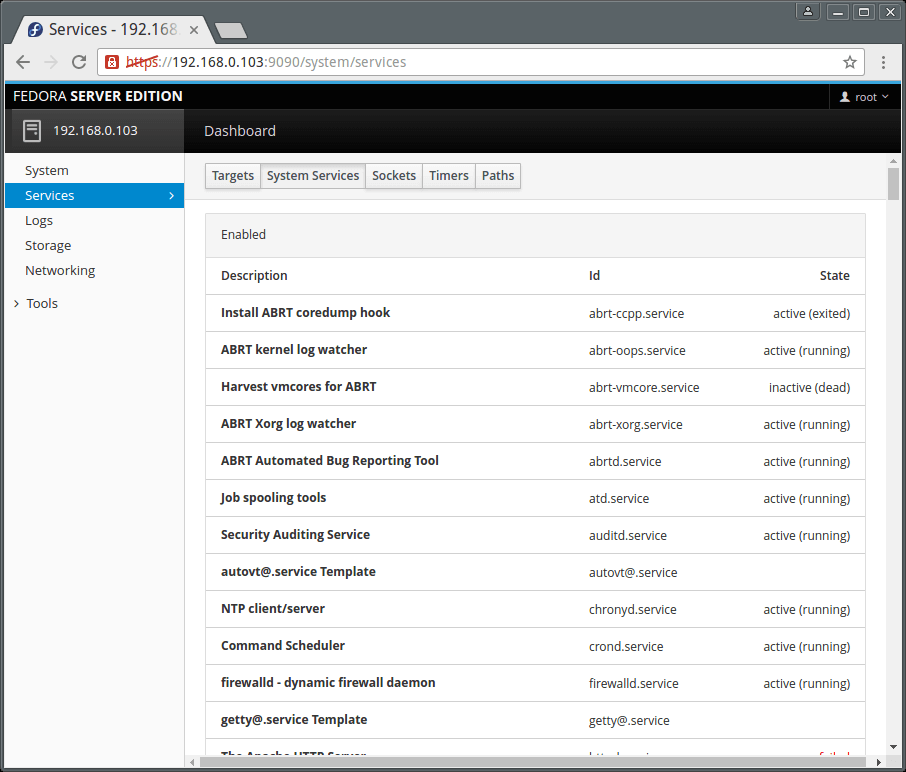
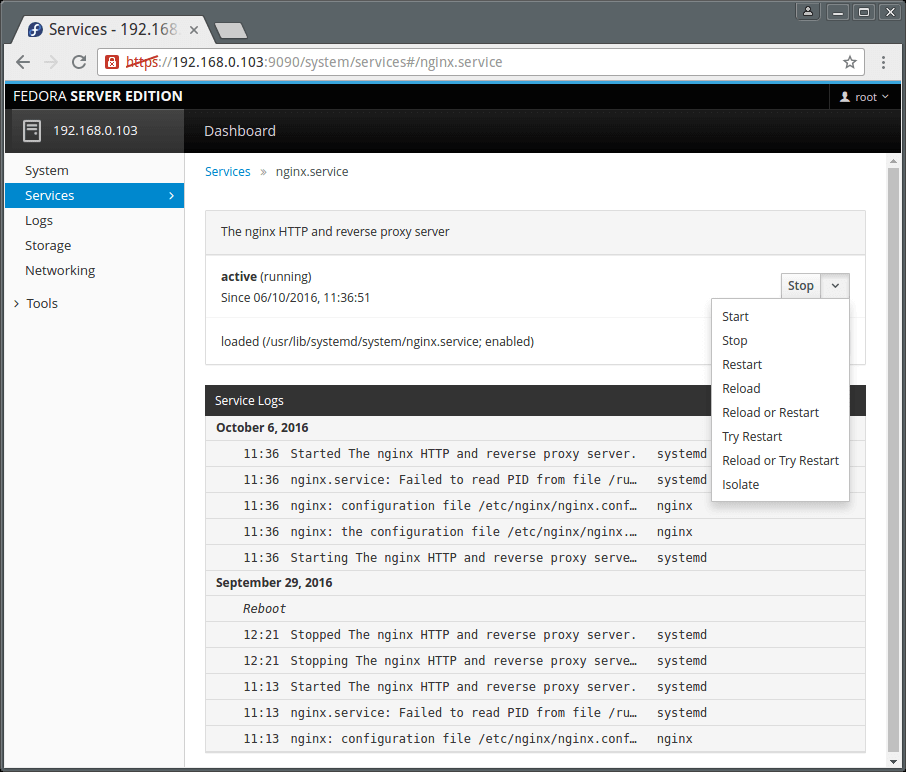
Next on the dashboard menu, is Services. Here you can view TargetsSystem ServicesSocketsTimers and Paths pages.

The interface below shows running services on your system.

Showing Current Running Services on Linux

Showing Current Running Services on Linux

You can click on a single service to manage it. Simply click on the drop down menus to get the functionality you want.

View Linux Service Summary

View Linux Service Summary

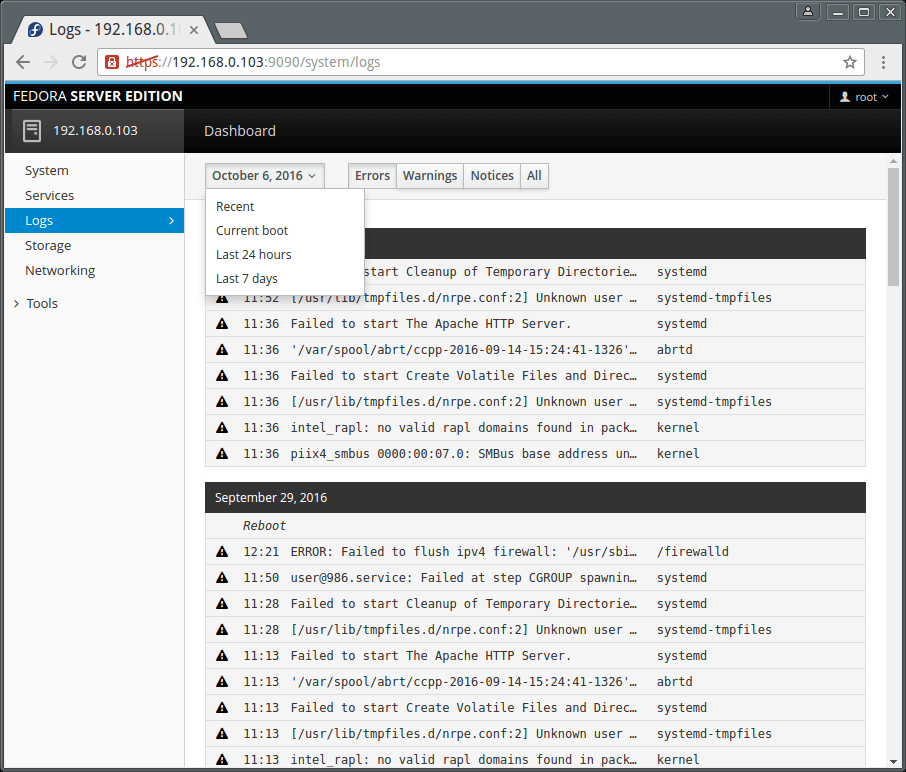
The Logs menu item displays the logs page which allows for logs inspection. The logs are categorized into ErrorsWarningsNotices and All as in the image below.

Additionally you can as well view logs based on time such as logs for the last 24HRs or 7 days.

Suggested Read: 4 Best Log Monitoring and Management Tools for Linux

To inspect a single log entry, simply click on it.

Linux Logs Monitoring

Linux Logs Monitoring

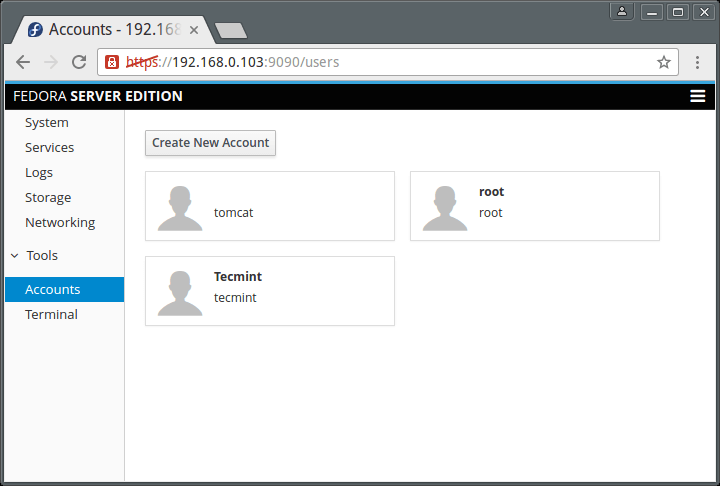
Cockpit also enables you to manage user accounts on the system, go to Tools and click on Accounts. Clicking on a user account allows you to view the users account details.

Manage Linux User Accounts

Manage Linux User Accounts

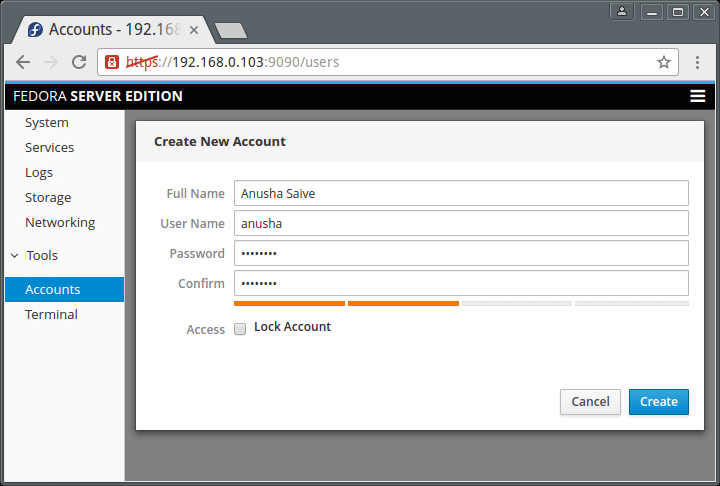
To add a system user, click on “Create New Account” button and enter the necessary user information in the interface below.

Create User Account in Linux

Create User Account in Linux

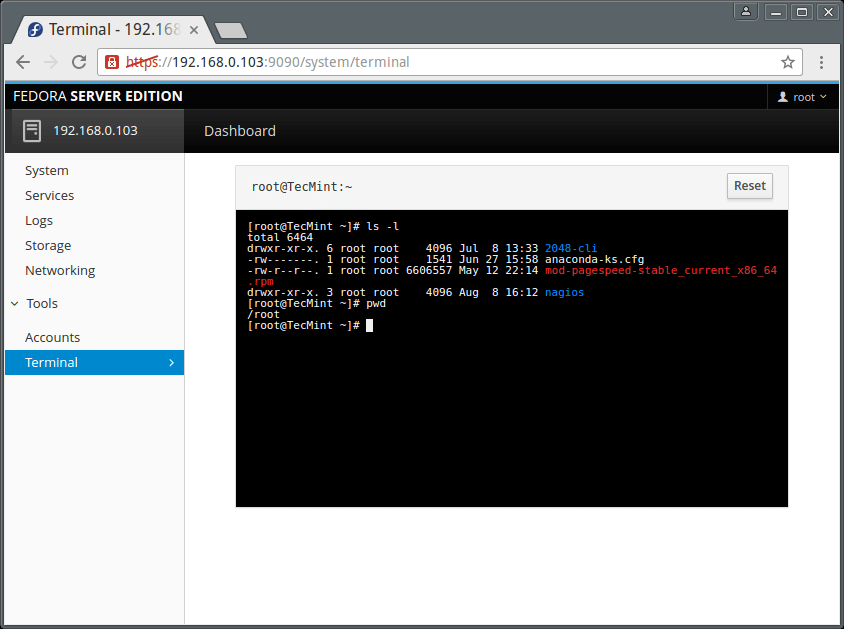
To get a terminal window, go to Tools  Terminal.

Cockpit - Linux Web Terminal

Cockpit – Linux Web Terminal

How to Add Linux Server to Cockpit

Important: Be aware that you must install Cockpit on all remote Linux servers in order to monitor them on Cockpit dashboard. So, please install it before adding any new server to Cockpit..

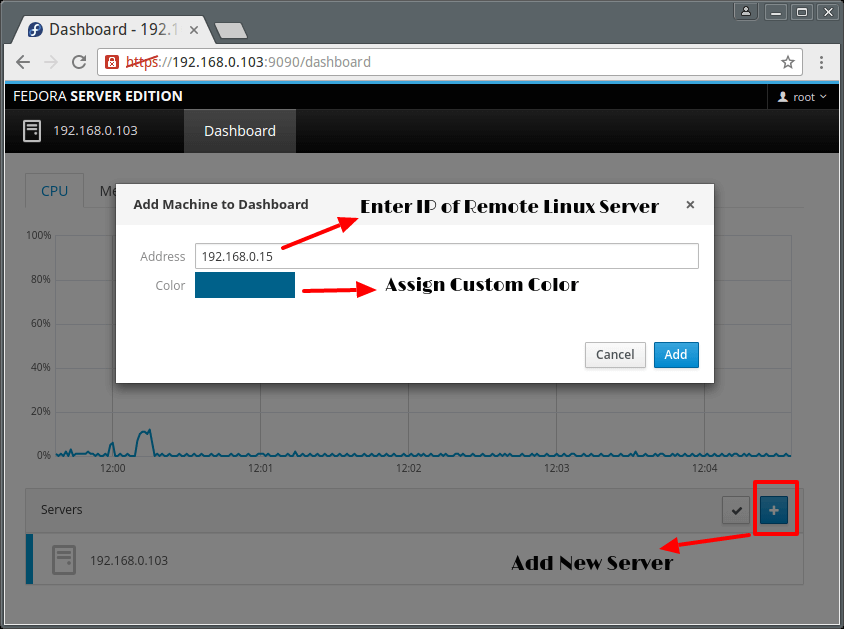
To add another server, click on dashboard, you will see the screen below. Click on the (+) sign and enter the server IP address. Remember that information for each server you add is displayed in Cockpit using a distinct color.

Add Linux Server to Cockpit

Add Linux Server to Cockpit

Cockpit - Remote Linux Server Monitoring

Cockpit – Remote Linux Server Monitoring

Same way, you can add many Linux servers under Cockpit and manage it efficiently without any trouble..

That is it for now, however, you can explore more in case you have installed this simple and wonderful server remote manager.

Cockpit Official Documentationhttp://cockpit-project.org/guide/latest/

For any questions or suggestions as well as feedback on the topic, do not hesitate to use the comment section below to get back to us.

Source

Web VMStat: A Real Time System Statistics (Memory, CPU, Processess, etc) Monitoring Tool for Linux

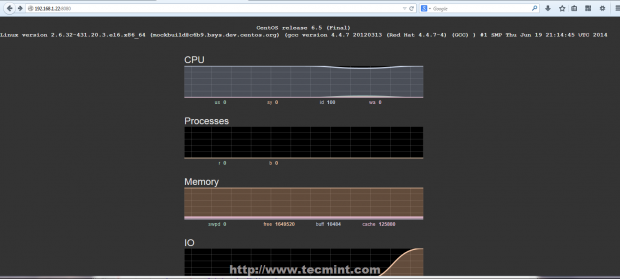
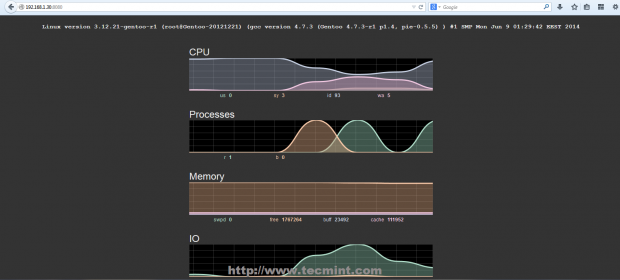
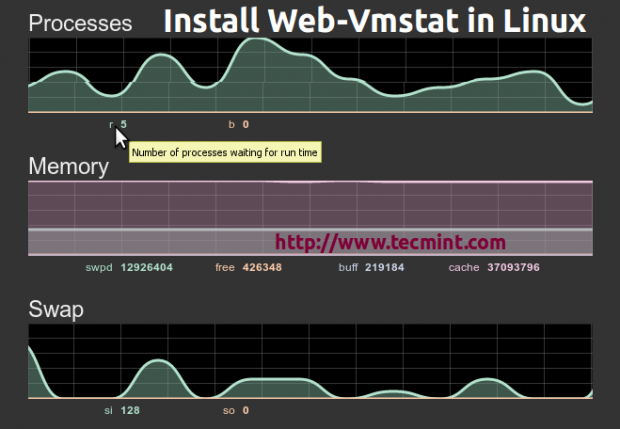
Web-Vmstat it’s a small application written in Java and HTML which displays live Linux system statistics, such as MemoryCPUI/OProcesses, etc. taken over vmstat monitoring command line in a pretty Web page with charts (SmoothieCharts) and diagrams through WebSocket streams using websocketd program.

Install Web-Vmstat in Linux

Install Web-Vmstat in Linux

I’ve recorded a quick video review of what the application can do on a Gentoo system.

Requirements

On a Linux system the following utilities must be installed.

  1. A wget for retrieving files using HTTP, HTTPS and FTP protocols.
  2. Nano or VI CLI Text Editor.
  3. Unzip Archive Extractor.

This tutorial will guide you through installing Web-Vmstat application on CentOS 6.5, but the procedure is valid for all Linux distributions, the only things that differ are just the init scripts (optional), which helps you manage more easy the entire process.

Read AlsoMonitor Linux Performance using Vmstat Commands

Step 1: Install Web-Vmstat

1. Before proceeding with installing Web-Vmstat, make sure you have all the above required commands installed on your system. You can use package manager such as yumapt-get, etc command to install it. For example, under CentOS systems, we use yum command to install it.

# yum install wget nano unzip

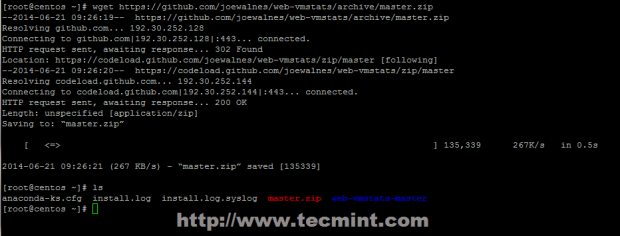
2. Now go to Veb-Vmstat official web page at and download the latest version using Download ZIP button or use wget to download from command line.

# wget https://github.com/joewalnes/web-vmstats/archive/master.zip

Download Web-Vmstat Package

Download Web-Vmstat Package

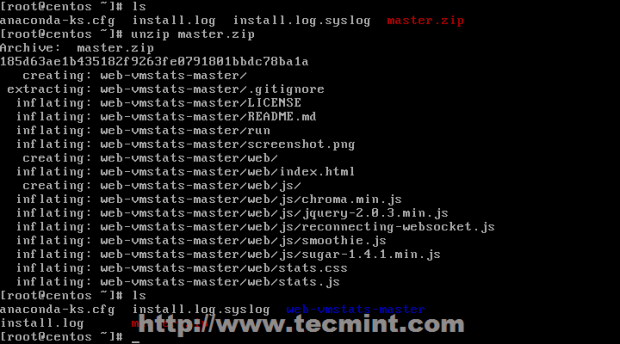
3. Extract the downloaded master.zip archive using unzip utility and enter to extracted folder.

# unzip master.zip
# cd web-vmstats-master

Extract Web-Vmstat Package

Extract Web-Vmstat Package

Switch to Web-Vmstat Folder

Switch to Web-Vmstat Folder

4. Web directory holds the HTML and Java files needed for the application to run in a Web environment. Create a directory under your system where you want to host the Web files and move all web content to that directory.

This tutorial uses /opt/web_vmstats/ to host all application web files, but you can create any arbitrary path on your system you like it, just assure you retain the absolute web path.

# mkdir /opt/web_vmstats
# cp -r web/* /opt/web_vmstats/

Create Web-Vmstat Folder

Create Web-Vmstat Folder

5. Next step is to download and install websocketd streaming program. Go to the official WebSocket page and download the package to match your system architecture (Linux 64-bit, 32-bit or ARM).

On 32-bit System
# wget https://github.com/joewalnes/websocketd/releases/download/v0.2.9/websocketd-0.2.9-linux_386.zip
On 64-bit System
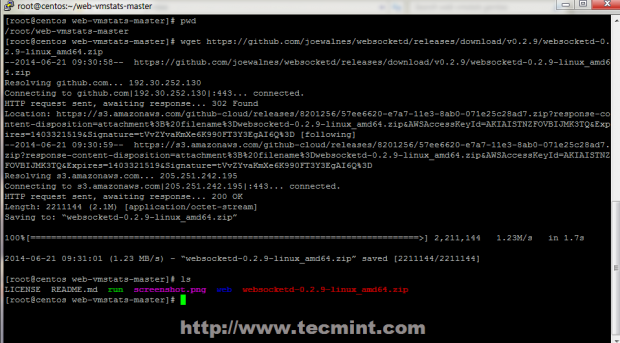
# wget https://github.com/joewalnes/websocketd/releases/download/v0.2.9/websocketd-0.2.9-linux_amd64.zip

Download WebSocket Package

Download WebSocket Package

6. Extract the WebSocket archive with unzip command and copy websocketd binary to a system executable path to make it available system-wide.

# unzip websocketd-0.2.9-linux_amd64.zip
# cp websocketd /usr/local/bin/

7. Now you can test it by running websocketd command using the following command syntax.

# websocketd --port=8080 --staticdir=/opt/web_vmstats/ /usr/bin/vmstat -n 1

Description of the each parameter explained below.

  1. –port=8080: A port used to connect on HTTP protocol – you can use any port number you want.
  2. –staticdir=/opt/web_vmstats/: The path where all Web-Vmstat web files are hosted.
  3. /usr/bin/vmstat -n 1: A Linux Vmstat command which updates its status every second.

Step 2: Create Init File

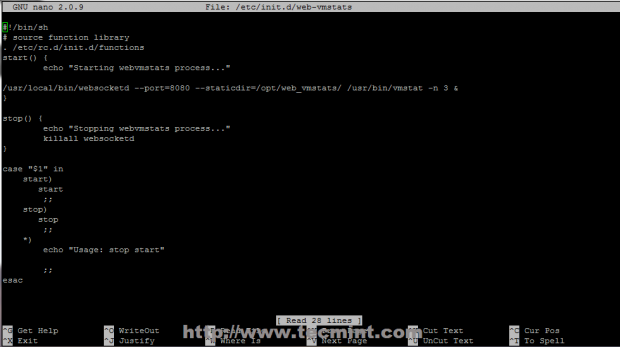
8. This step is optional and only works with init script supported systems. To manage WebSocket process as a system daemon create a init service file on /etc/init.d/ path with the following content.

# nano /etc/init.d/web-vmstats

Add the following content.

#!/bin/sh
# source function library
. /etc/rc.d/init.d/functions
start() {
                echo "Starting webvmstats process..."

/usr/local/bin/websocketd --port=8080 --staticdir=/opt/web_vmstats/ /usr/bin/vmstat -n 1 &
}

stop() {
                echo "Stopping webvmstats process..."
                killall websocketd
}

case "$1" in
    start)
       start
        ;;
    stop)
       stop
        ;;
    *)
        echo "Usage: stop start"
        ;;
esac

Create Web-Vmstat Init Script

Create Web-Vmstat Init Script

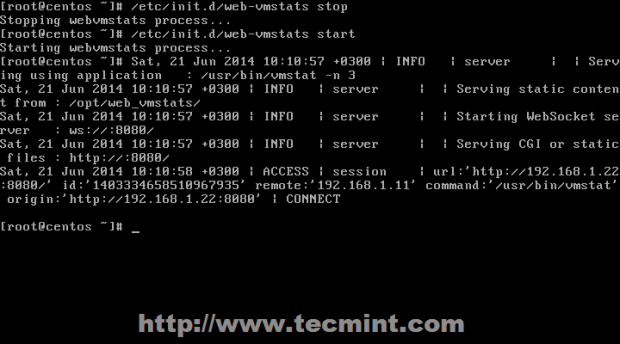
9. After the file has been created, append execution permissions and manage the process using start or stopswitches.

# chmod +x /etc/init.d/web-vmstats
# /etc/init.d/web-vmstats start

Start Web-Vmstat

Start Web-Vmstat

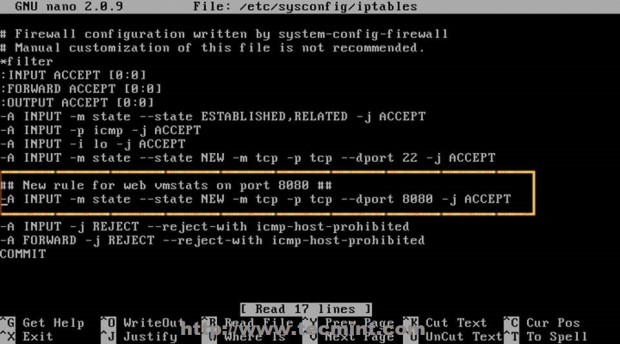
10. If your Firewall is active edit /etc/sysconfig/iptables firewall file and open the port used by websocketd process to make it available for outside connections.

# nano /etc/sysconfig/iptables

If you use port 8080 as in this tutorial add the following line to iptables file after the rule that opens port 22.

-A INPUT -m state --state NEW -m tcp -p tcp --dport 8080 -j ACCEPT

Open Port 8080 in Iptables

Open Port 8080 in Iptables

11. To finalize the whole process restart iptables service to apply the new rule.

# service iptables restart
# service web-vmstats start

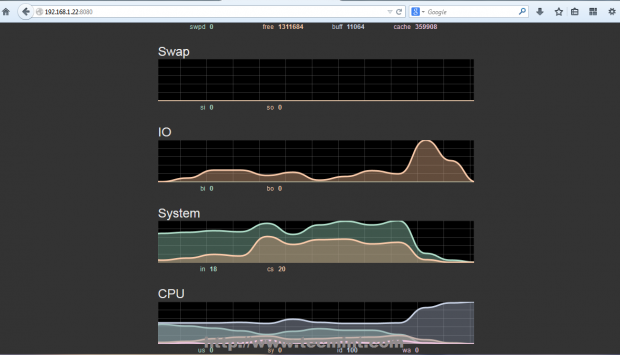
Open a browser and use the following URL to display Vmstats system statistics.

http://system_IP:8080

Watch Vmstats System Statistics

Watch Vmstats System Statistics

12. To display name, version and other details about your current machine and the operating system running on it. Go to Web-Vmstat files path and run the following commands.

# cd /opt/web_vmstats
# cat /etc/issue.net | head -1 > version.txt
# cat /proc/version >> version.txt

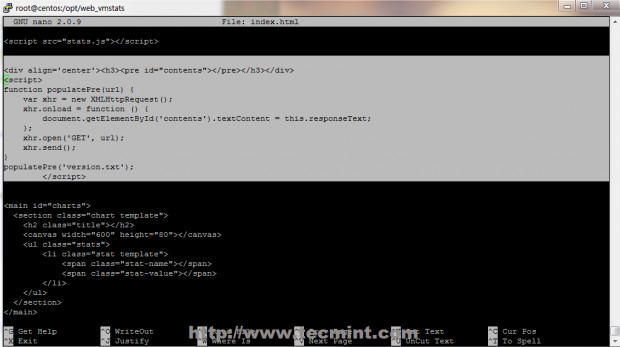
13. Then open index.html file and add the following javascript code before <main id=”charts”> line.

# nano index.html

Use the following JavaScript code.

<div align='center'><h3><pre id="contents"></pre></h3></div>
<script>
function populatePre(url) {
    var xhr = new XMLHttpRequest();
    xhr.onload = function () {
        document.getElementById('contents').textContent = this.responseText;
    };
    xhr.open('GET', url);
    xhr.send();
}
populatePre('version.txt');
                </script>

Add Javascript Code

Add Javascript Code

14. To view the final result refresh http://system_IP:8080 web page and you should see information and live statistics about your current machine as in the screenshots below.

Watch Live System Statistics

Watch Live System Statistics

System Live Statistics Graphs

System Live Statistics Graphs

Source

TCPflow – Analyze and Debug Network Traffic in Linux

TCPflow is a free, open source, powerful command line based tool for analyzing network traffic on Unix-like systems such as Linux. It captures data received or transferred over TCP connections, and stores it in a file for later analysis, in a useful format that allows for protocol analysis and debugging.

Read Also16 Best Bandwidth Monitoring Tools to Analyze Network Usage in Linux

It is actually a tcpdump-like tools as it processes packets from the wire or from a stored file. It supports the same powerful filtering expressions supported by its counterpart. The only difference is that tcpflow puts all the TCP packets into order and assembles each flow in a separate file (a file for each direction of flow) for later analysis.

Its feature set includes an advanced plug-in system for decompressing compressed HTTP connections, undoing MIME encoding, or invoking third-party programs for post-processing and much more.

There are many use cases for tcpflow which include to understand network packet flows and also supports for performing network forensics and divulge the contents of HTTP sessions.

How to Install TCPflow in Linux Systems

TCPflow is available in the official repositories of mainstream GNU/Linux distributions, you can install it using your package manager as shown.

$ sudo apt install tcpflow	#Debian/Ubuntu
$ sudo yum install tcpflow	#CentOS/RHEL
$ sudo dnf install tcpflow	#Fedora 22+

After installing tcpflow, you can run it with superuser privileges, otherwise use the sudo command. Note that it listens on the active network interface (for instance enp0s3).

$ sudo tcpflow

tcpflow: listening on enp0s3

By default tcpflow stores all captured data in files that have names in the form (this may be different if you use certain options such as timestamp).

sourceip.sourceport-destip.destport
192.168.043.031.52920-216.058.210.034.00443

Now let’s do a directory listing to see if tcp flow has been captured in any files.

$ ls -1

total 20
-rw-r--r--. 1 root    root     808 Sep 19 12:49 192.168.043.031.52920-216.058.210.034.00443
-rw-r--r--. 1 root    root      59 Sep 19 12:49 216.058.210.034.00443-192.168.043.031.52920

As we mentioned earlier on, each TCP flow is stored in its own file. From the output above, you can see that there are three transcript file, which indicate tcpflow in two opposite directions, where the source IP in the first file and the destination IP in the second file and vice versa.

The first file 192.168.043.031.52920-216.058.210.034.00443 contains data transfered from host 192.168.043.031 (the localhost on which tcpflow was run) via port 52920, to host 216.058.210.034 (the remote host) via port 443.

And the second file 216.058.210.034.00443-192.168.043.031.52920 contains data sent from host 216.058.210.034 (the remote host) via port 443 to host 192.168.043.031 (the localhost on which tcpflow was run) via port 52920.

There is also an XML report generated, which contains information about the program such as how it was compiled, and the computer it was run on and a record of every tcp connection.

As you may have noticed, tcpflow stores the transcript files in the current directory by default. The -o option can help you specify the output directory where the transcript files will be written.

$ sudo tcpflow -o tcpflow_files
$ sudo ls -l tcpflow_files

total 32
-rw-r--r--. 1 root root 1665 Sep 19 12:56 157.240.016.035.00443-192.168.000.103.45986
-rw-r--r--. 1 root root   45 Sep 19 12:56 169.044.082.101.00443-192.168.000.103.55496
-rw-r--r--. 1 root root 2738 Sep 19 12:56 172.217.166.046.00443-192.168.000.103.39954
-rw-r--r--. 1 root root   68 Sep 19 12:56 192.168.000.102.00022-192.168.000.103.42436
-rw-r--r--. 1 root root  573 Sep 19 12:56 192.168.000.103.39954-172.217.166.046.00443
-rw-r--r--. 1 root root 4067 Sep 19 12:56 192.168.000.103.45986-157.240.016.035.00443
-rw-r--r--. 1 root root   38 Sep 19 12:56 192.168.000.103.55496-169.044.082.101.00443
-rw-r--r--. 1 root root 3159 Sep 19 12:56 report.xml

You can also print the contents of packets to stdout as they are received, without storing any captured data to files, using the -c flag as follows.

To test this effectively, open a second terminal and run a ping, or browse the internet. You should be able to see the ping details or your browsing details being captured by tcpflow.

$ sudo tcpflow -c

It is possible to capture all traffic on a particular port, for example port 80 (HTTP). In the case of HTTP traffic, you will be able to see the HTTP Headers followed by the content all on the stdout or in one file if the -c switch is removed.

$ sudo tcpflow port 80

To capture packets from a specific network interface, use the -i flag to specify the interface name.

$ sudo tcpflow -i eth0 port 80

You can also specify a target host (accepted values are IP address, hostname or domains), as shown.

$ sudo tcpflow -c host 192.68.43.1
OR
$ sudo tcpflow -c host www.google.com 

You can enable all processing using all scanners with the -a flag, this is equivalent to the -e all switch.

$ sudo tcpflow -a  
OR
$ sudo tcpflow -e all

A specific scanner can also be activated; the available scanners include md5, http, netviz, tcpdemux and wifiviz (run tcpflow -H to view detailed information about each scanner).

$ sudo tcpflow -e http
OR
$ sudo tcpflow -e md5
OR
$ sudo tcpflow -e netviz
OR
$ sudo tcpflow -e tcpdemux
OR
$ sudo tcpflow -e wifiviz

The following example show how to enable all scanners except tcpdemux.

$ sudo tcpflow -a -x tcpdemux 

TCPflow usually tries to put the network interface into promiscuous mode before capturing packets. You can prevent this using the -p flag as shown.

$ sudo tcpflow -p -i eth0

To read packets from a tcpdump pcap file, use the -r flag.

$ sudo tcpflow -f file.pcap

You can enable verbose mode using the -v or -d 10 options.

$ sudo tcpflow -v
OR
$ sudo tcpflow -d 10

Important: One limitation of tcpflow is that, at the present time it does not understand IP fragments, thus data transmitted as part of TCP connections containing IP fragments will not be properly captured.

For more information and usage options, see the tcpflow man page.

$ man tcpflow 

TCPflow Github repositoryhttps://github.com/simsong/tcpflow

That’s all for now! TCPflow is a powerful TCP flow recorder which is useful for understanding network packet flows and performing network forensics, and so much more. Try it out and share your thoughts about it with us in the comments.

Source

Block SSH Server Attacks (Brute Force Attacks) Using DenyHosts

DenyHosts is an open source and free log-based intrusion prevention security program for SSH servers developed in Python language by Phil Schwartz. It is intended to monitor and analyzes SSH server logs for invalid login attempts, dictionary based attacks and brute force attacks by blocking the originating IP addresses by adding an entry to /etc/hosts.deny file on the server and prevents the IP address from making any further such login attempts.

Block SSH attacks

Install DenyHosts to Block SSH Attacks

DenyHosts is much needed tool for all Linux based systems, specially when we are allowing password based ssh logins. In this article we are going to show you how to install and configure DenyHosts on RHEL 6.3/6.2/6.1/6/5.8CentOS 6.3/6.2/6.1/6/5.8 and Fedora 17,16,15,14,13,12 systems using epel repository.

See also :

  1. Fail2ban (Intrusion Prevention) System for SSH
  2. Disable or Enable SSH Root Login
  3. Linux Malware Detect (LMD)

Installing DenyHosts in RHEL, CentOS and Fedora

By default DenyHosts tool is not included in the Linux systems, we need to install it using third party EPEL repository. Once added repository, install the package using following YUM command.

# yum --enablerepo=epel install denyhosts
OR
# yum install denyhosts

Configuring DenyHosts for Whitelist IP Addresses

Once the Denyhosts installed, make sure to whitelist your own IP address, so you will never get locked out. To do this, open a file /etc/hosts.allow.

# vi /etc/hosts.allow

Below the description, add the each IP address one-by-one on a separate line, that you never want to block. The format should be as follows.

#
# hosts.allow   This file contains access rules which are used to
#               allow or deny connections to network services that
#               either use the tcp_wrappers library or that have been
#               started through a tcp_wrappers-enabled xinetd.
#
#               See 'man 5 hosts_options' and 'man 5 hosts_access'
#               for information on rule syntax.
#               See 'man tcpd' for information on tcp_wrappers
#
sshd: 172.16.25.125
sshd: 172.16.25.126
sshd: 172.16.25.127

Configuring DenyHosts for Email Alerts

The main configuration file is located under /etc/denyhosts.conf. This file is used to send email alerts about suspicious logins and restricted hosts. Open this file using VI editor.

# vi /etc/denyhosts.conf

Search for the ‘ADMIN_EMAIL‘ and add your email address here to receive email alerts about suspicious logins (for multiple email alerts use comma separated). Please have a look at the configuration file of my CentOS 6.3server. Each variable is well documented so configure it according to your liking.

############ DENYHOSTS REQUIRED SETTINGS ############
SECURE_LOG = /var/log/secure
HOSTS_DENY = /etc/hosts.deny
BLOCK_SERVICE  = sshd
DENY_THRESHOLD_INVALID = 5
DENY_THRESHOLD_VALID = 10
DENY_THRESHOLD_ROOT = 1
DENY_THRESHOLD_RESTRICTED = 1
WORK_DIR = /var/lib/denyhosts
SUSPICIOUS_LOGIN_REPORT_ALLOWED_HOSTS=YES
HOSTNAME_LOOKUP=YES
LOCK_FILE = /var/lock/subsys/denyhosts

############ DENYHOSTS OPTIONAL SETTINGS ############
ADMIN_EMAIL = ravisaive@tecmint.com
SMTP_HOST = localhost
SMTP_PORT = 25
SMTP_FROM = DenyHosts <tecmint@tecmint.com>
SMTP_SUBJECT = DenyHosts Daily Report

############ DENYHOSTS OPTIONAL SETTINGS ############
DAEMON_LOG = /var/log/denyhosts
DAEMON_SLEEP = 30s
DAEMON_PURGE = 1h

Restarting DenyHosts Service

Once you’ve done with your configuration, restart the denyhosts service for new changes. We also add the denyhosts service to system start-up.

# chkconfig denyhosts on
# service denyhosts start

Watch DenyHosts Logs

To watch denyhosts ssh logs for how many attackers and hackers are attempted to gain access to your server. Use the following command to view the real-time logs.

# tail -f /var/log/secure
Nov 28 15:01:43 tecmint sshd[25474]: Accepted password for root from 172.16.25.125 port 4339 ssh2
Nov 28 15:01:43 tecmint sshd[25474]: pam_unix(sshd:session): session opened for user root by (uid=0)
Nov 28 16:44:09 tecmint sshd[25474]: pam_unix(sshd:session): session closed for user root
Nov 29 11:08:56 tecmint sshd[31669]: Accepted password for root from 172.16.25.125 port 2957 ssh2
Nov 29 11:08:56 tecmint sshd[31669]: pam_unix(sshd:session): session opened for user root by (uid=0)
Nov 29 11:12:00 tecmint atd[3417]: pam_unix(atd:session): session opened for user root by (uid=0)
Nov 29 11:12:00 tecmint atd[3417]: pam_unix(atd:session): session closed for user root
Nov 29 11:26:42 tecmint sshd[31669]: pam_unix(sshd:session): session closed for user root
Nov 29 12:54:17 tecmint sshd[7480]: Accepted password for root from 172.16.25.125 port 1787 ssh2

Remove Banned IP Address from DenyHosts

If you’ve ever blocked accidentally and want to remove that banned IP address from the denyhosts. You need to stop the service.

# /etc/init.d/denyhosts stop

To remove or delete banned IP address completely. You need to edit the following files and remove the IP address.

# vi /etc/hosts.deny
# vi /var/lib/denyhosts/hosts
# vi /var/lib/denyhosts/hosts-restricted
# vi /var/lib/denyhosts/hosts-root
# vi /var/lib/denyhosts/hosts-valid
# vi /var/lib/denyhosts/users-hosts

After removing the banned IP Address, restart the service again.

# /etc/init.d/denyhosts start

The offending IP address added to all the files under /var/lib/denyhosts directory, so it’s makes very difficult to determine the which files contain the offending IP address. One of the best way to find out the IP address using grep command. For example to find out IP address 172.16.25.125, do.

cd /var/lib/denyhosts
grep 172.16.25.125 *

Whitelist IP Addresses Permanently in DenyHosts

If you’ve list of static IP address that you want to whitelist permanently. Open the file /var/lib/denyhosts/allowed-hosts file. Whatever IP address included in this file will not be banned by default (consider this as a whilelist).

# vi /var/lib/denyhosts/allowed-hosts

And add the each IP address on separate line. Save and close the file.

# We mustn't block localhost
127.0.0.1
172.16.25.125
172.16.25.126
172.16.25.127

Source

Hegemon – A Modular System Monitoring Tool for Linux

There are all kinds of Linux system monitoring tools such as tophtopatop and many more that provide different output of system data such as resource utilization, running processes, CPU temperature and others.

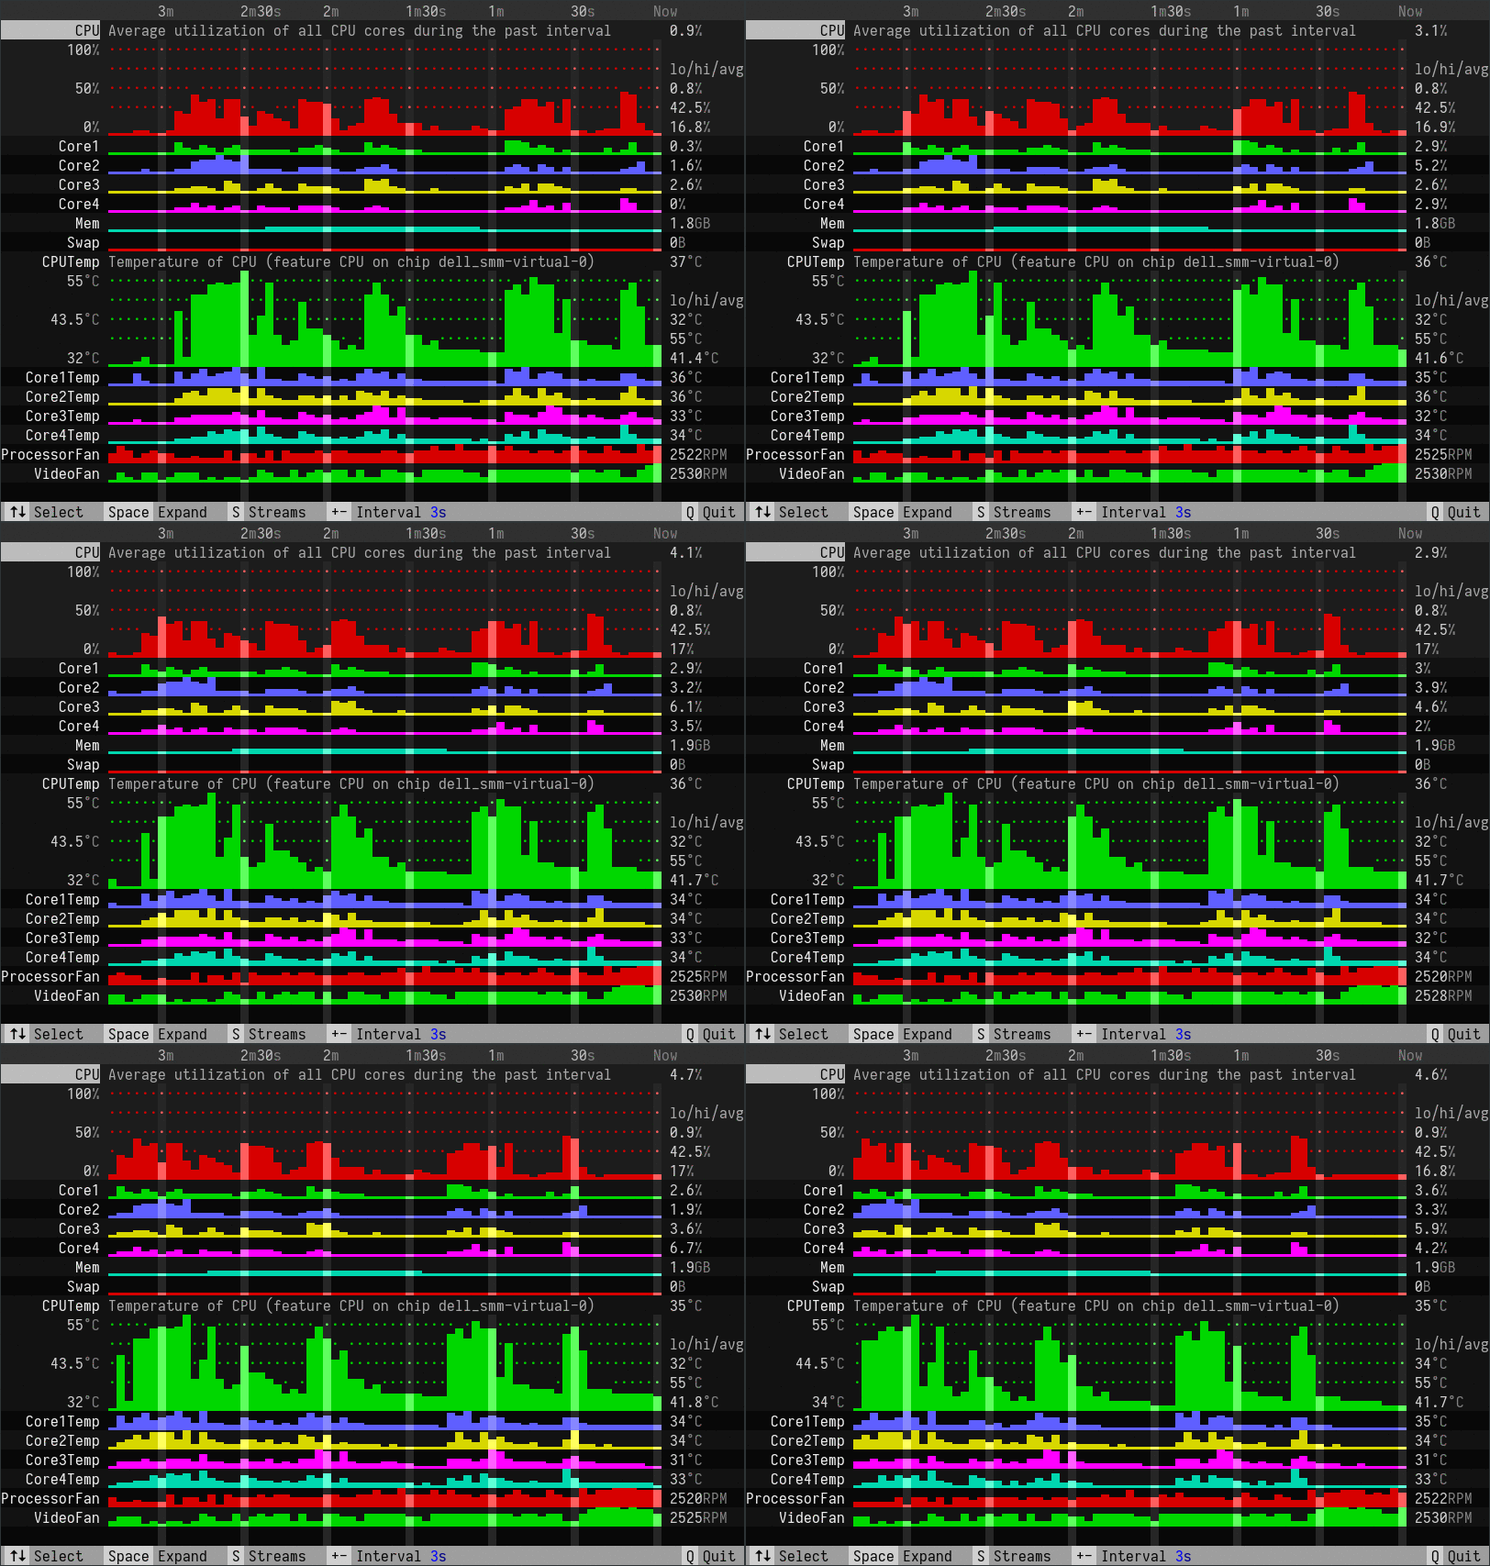
In this article, we are going to review a modular monitoring tool called Hegemon. It’s an open source project written in Rust, which works are still in progress.

Hegemon includes the following features:

  • Monitor CPU, memory and swap usage
  • Monitor system temperatures and fan speeds
  • Adjustable update interval
  • Unit tests
  • Expand data stream for more detailed graphic visualization

How to Install Hegemon in Linux

Hegemon is currently available for Linux only and requires Rust and the development files for libsensors. The latter can be found in the default package repository and can be installed using the following commands.

# yum install lm_sensors-devel   [On CentOS/RHEL] 
# dnf install lm_sensors-devel   [On Fedora 22+]
# apt install libsensors4-dev    [On Debian/Ubuntu]

Detailed instructions how to install Rust programming language on your system are provided in the following article.

  1. How to Install Rust Programming Language in Linux

Once you have install Rust, you can proceed with installing Hegemon by using Rust’s package manager called cargo.

# cargo install hegemon

When the installation is complete run hegemon, by simply issuing the following command.

# hegemon

The hegemon graph will appear. You will have to give it a few seconds to collect data and update its information.

Hegemon Monitoring Tool

Hegemon Monitoring Tool

You will see the following sections:

  • CPU – Shows the CPU utilization
  • Core Num – Utilization of the CPU core
  • Mem – memory utilization
  • Swap – swap memory usage

You can expand each section by pressing “Space” button on your keyboard. This will provide a little more detailed information about the utilization of the resource you have selected.

If you wish to increase or decrease the update interval, you can use the + and - buttons on your keyboard.

How to Add New Streams

Hegemon uses data streams to visualize its data. Their behavior is defined in the stream trait here. Streams only need to provide basic data such as name, description and a method for retrieving numeric data value.

Hegemon will manage the rest – updating the information, rendering layout and computation stats. To learn more how to create data streams and learn how to create your own, you would need to dive deeper into the Hegemon project on git. A good starting point would be the project readme file.

Conclusion

Hegemon is a simple, easy to use tool to help you collect quick stats about your system status. While it’s functionality is rather basic compared to other monitoring tools, it does its job very well and is a reliable source for collecting system information. Future releases are expected to have network monitoring support, which may come quite handy.

Source

Monitorix 3.10.1 Released – A Lightweight System and Network Monitoring Tool for Linux

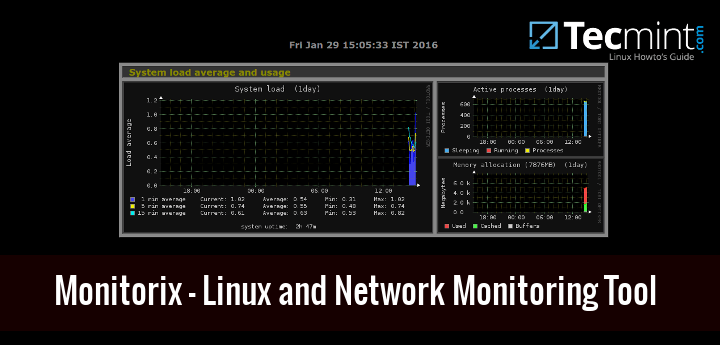
Monitorix is an open source, free and most powerful lightweight tool designed to monitor system and network resources in Linux. It regularly collects system and network data and display the information in graphs using its own web interface. Monitorix allows to monitor overall system performance and also help in detecting bottlenecks, failures, unwanted long response times and other abnormal activities.

Linux System and Network Monitoring Tool

Monitorix – Linux System and Network Monitoring Tool

It is written in Perl language and licensed under the terms of GNU (General Public License) as published by the FSP (Free Software Foundation). It uses RRDtool to generate graphs and display them using web interface.

This tool is specifically created for monitoring Red HatCentOSFedora based Linux systems, but today it runs on many different flavors of GNU/Linux distributions and even it runs on UNIX systems like OpenBSDNetBSDand FreeBSD.

The development of Monitorix is currently in active state and adding new features, new graphs, new updates and fixing bugs to offer a great tool for Linux system/network administration.

Monitorix Features

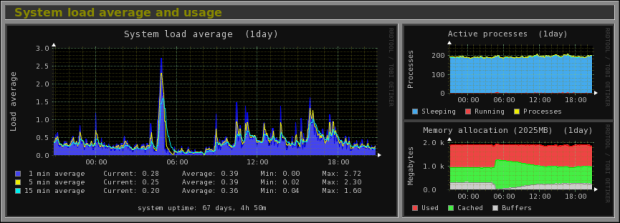
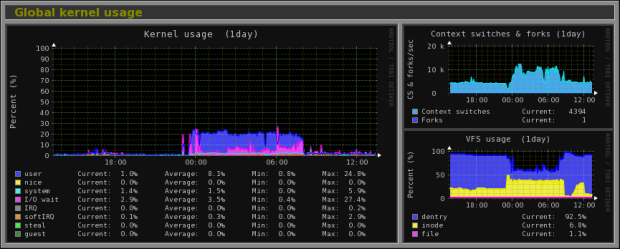
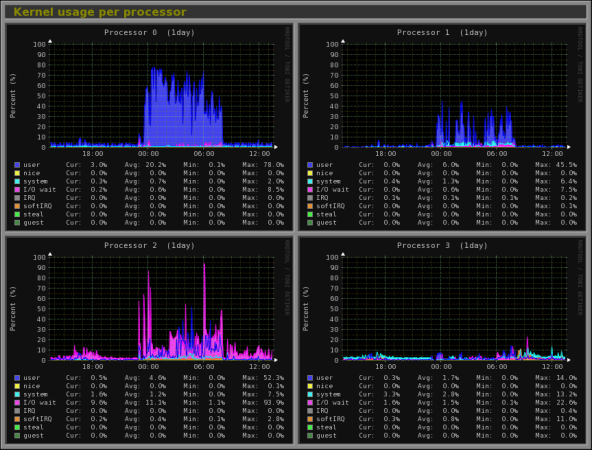
  1. System load average, active processes, per-processor kernel usage, global kernel usage and memory allocation.
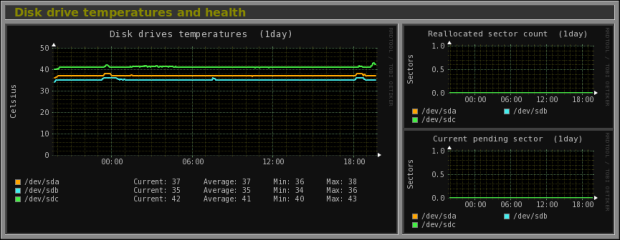
  2. Monitors Disk drive temperatures and health.
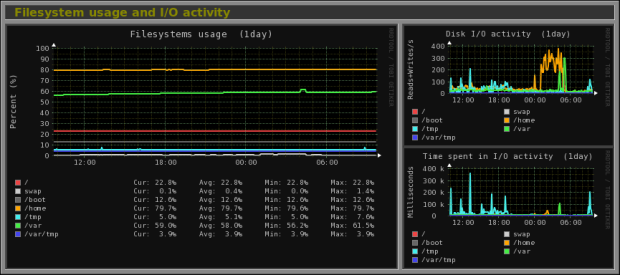
  3. Filesystem usage and I/O activity of filesystems.
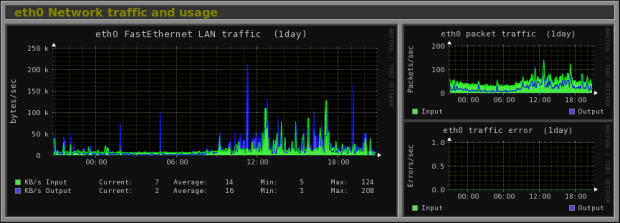
  4. Network traffic usage up to 10 network devices.
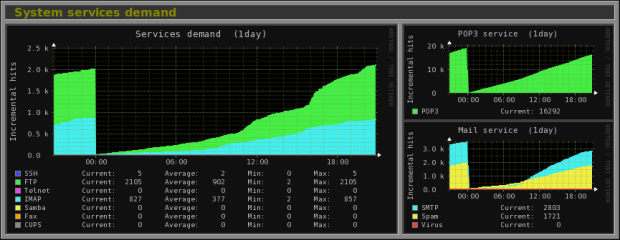
  5. System services including SSH, FTP, Vsftpd, ProFTP, SMTP, POP3, IMAP, POP3, VirusMail and Spam.
  6. MTA Mail statistics including input and output connections.
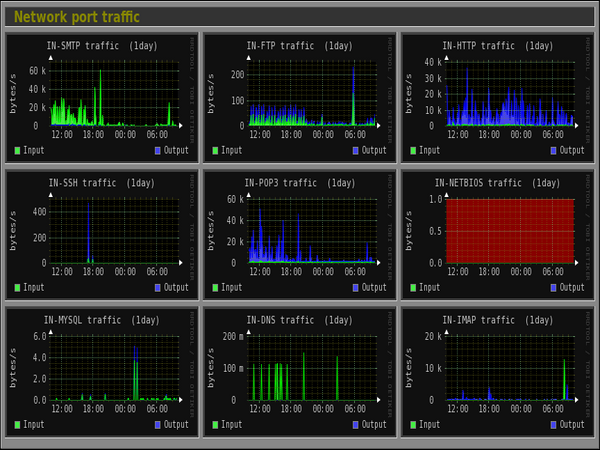
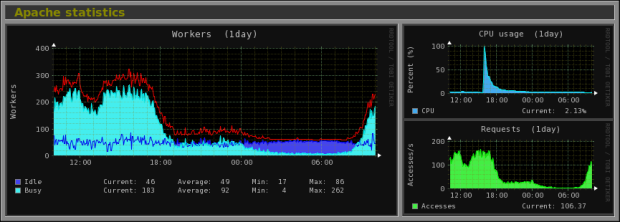
  7. Network port traffic including TCP, UDP, etc.
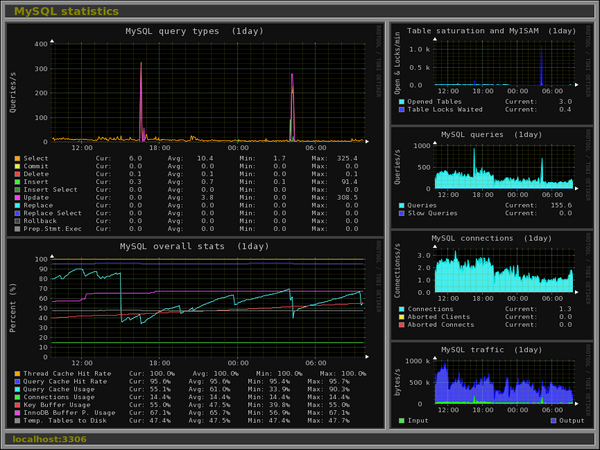
  8. FTP statistics with log file formats of FTP servers.
  9. Apache statistics of local or remote servers.
  10. MySQL statistics of local or remote servers.
  11. Squid Proxy Web Cache statistics.
  12. Fail2ban statistics.
  13. Monitor remote servers (Multihost).
  14. Ability to view statistics in graphs or in plain text tables per day, week, month or year.
  15. Ability to zoom graphs for better view.
  16. Ability to define the number of graphs per row.
  17. Built-in HTTP server.

For a full list of new features and updates, please check out the official feature page.

Installing Monitorix on a RHEL/CentOS/Fedora Linux

First, install following required packages.

# yum install rrdtool rrdtool-perl perl-libwww-perl perl-MailTools perl-MIME-Lite perl-CGI perl-DBI perl-XML-Simple perl-Config-General perl-HTTP-Server-Simple perl-IO-Socket-SSL wget

If in case yum fails to installing one or more of above packages, then you could enable following additional repositories to install them.

  1. Enable EPEL repository
  2. Enable RPMforge repository

Next, download the latest version of ‘Monitorix‘ package using wget command.

# wget http://www.monitorix.org/monitorix-3.10.1-1.noarch.rpm

Once successfully downloaded, install it using the rpm command.

# rpm -ivh monitorix-3.10.1-1.noarch.rpm
Preparing...                ########################################### [100%]
   1:monitorix              ########################################### [100%]

Once successfully installed, please have a look at the main configuration file ‘/etc/monitorix.conf‘ to add some extra settings according to your system and enable or disable graphs.

Finally, add Monitorix service to system start-up and start the service with following commands.

# chkconfig --level 35 monitorix on
# service monitorix start        
# systemctl start monitorix       [On RHEL/CentOS 7 and Fedora 22+ versions ]

Once, you’ve started service, the program will start collecting system information according to configuration set in ‘/etc/monitorix.conf‘ file, and after few minutes you will start seeing system graphs from your browser at.

http://localhost:8080/monitorix/

If you have SELinux in enabled state, then graphs are not visible and you will get tons of error messages in ‘/var/log/messages‘ or ‘/var/log/audit/audit.log‘ file about access denied to RRD database files. To get rid of such errors messages and visible graphs, you need to disable SELinux.

To Turn Off SELinux, simple changing the line “enforcing” to “disabled” in ‘/etc/selinux/config’ file.

SELINUX=disabled

The above will disable SELinux temporarily, until you reboot the machine. If you want the system to start in always disable mode, you need to reboot the system.

Installing Monitorix on a Ubuntu/Debian/Linux Mint

The Monitorix installation can be done in two-ways, using Izzy repository for automatic installation/updates and another using manually download and install .deb package.

The Izzy repository is an experimental repository but the packages from this repository should work on all versions of UbuntuDebian, etc. However, no warranties are given – So, the risk is all yours. If you still want to add this repository for automatic updates via apt-get, simply follow the steps provided below for automatic installation.
Automatic Installation Using Izzy Repository

Add the following line to your ‘/etc/apt/sources.list’ file.

deb http://apt.izzysoft.de/ubuntu generic universe

Get GPG key for this repository, you can get it using wget command.

# wget http://apt.izzysoft.de/izzysoft.asc

Once downloaded, add this GPG key to apt configuration by using the command ‘apt-key‘ as shown below.

# apt-key add izzysoft.asc

Finally, install the package via the repository.

# apt-get update
# apt-get install monitorix

Manual Installation Using .Deb Package

Manually, downloading latest version of .deb package and install it with taking care of required dependencies as shown below.

# apt-get update
# apt-get install rrdtool perl libwww-perl libmailtools-perl libmime-lite-perl librrds-perl libdbi-perl libxml-simple-perl libhttp-server-simple-perl libconfig-general-perl libio-socket-ssl-perl
# wget http://www.monitorix.org/monitorix_3.10.1-izzy1_all.deb
# dpkg -i monitorix_3.10.1-izzy1_all.deb

During installation, a web server configuration takes place. So, you need to reload the Apache web server to reflect new configuration.

# service apache2 restart         [On SysVinit]
# systemctl restart apache2       [On SystemD]

Monitorix comes with a default configuration, if you wish to change or adjust some settings take a look at the configuration file at ‘/etc/monitorix.conf‘. Once you’ve done changes reload the service for new configuration to take effect.

# service monitorix restart         [On SysVinit]
# systemctl restart monitorix       [On SystemD]

Now point your browser to ‘http://localhost:8080/monitorix‘ and start watching graphs of your system. It can be accessed from localhost only, if you wish to allow access to remote IP’s. Simply open the ‘/etc/apache2/conf.d/monitorix.conf‘ file and add IP’s to the ‘Allow from‘ clause. For example see below.
<Directory /usr/share/monitorix/cgi-bin/>
        DirectoryIndex monitorix.cgi
        Options ExecCGI
        Order Deny,Allow
        Deny from all
        Allow from 172.16.16.25
</Directory>

After you made changes to above configuration, do not forget to restart Apache.

# service apache2 restart         [On SysVinit]
# systemctl restart apache2       [On SystemD]

Monitorix Screenshots

Please check out the following are some screenshots.

Monitorix Homepage

Monitorix Homepage

Monitorix Homepage

Monitor Linux Load Average

System load average, active processes and memory allocation.

System load average, active processes and memory allocation.

Monitor Linux Kernel Usage

Global kernel usage

Global kernel usage

Monitor Linux Kernel Processor

Per-processor kernel usage.

Per-processor kernel usage.

Monitor Linux Disk Health

Disk drive temperatures and health.

Disk drive temperatures and health.

Monitor Linux Filesystem and Disk I/O Read

Filesystem usage and I/O activity.

Filesystem usage and I/O activity.

Monitor Linux Network Traffic

eth0 interface traffic

eth0 interface traffic

Monitor Linux System Services

System services demand

System services demand

Monitor Linux Network Port Traffic

Network Port Traffic

Network Port Traffic

Monitor Linux Apache Statistics

Apache Statistics

Apache Statistics

Monitor MySQL/MariaDB Statistics

MySQL Statistics

MySQL Statistics

Reference Links:

  1. Monitorix Homepage
  2. Monitorix Documentation

Source

Dstat – A Resourceful Tool to Monitor Linux Server Performance in Real-Time

Some of the popular and frequently used system resource generating tools available on the Linux platform include vmstatnetstatiostatifstat and mpstat. They are used for reporting statistics from different system components such as virtual memory, network connections and interfaces, CPU, input/output devices and more.

As a system administrator, you may be looking for that one tool that can give your a good amount of the information provided by above tools, even more, a single and powerful tool that has additional features and capabilities, then look no further than dstat.

Suggested Read: 20 Command Line Tools to Monitor Linux Performance

dstat is a powerful, flexible and versatile tool for generating Linux system resource statistics, that is a replacement for all the tools mentioned above. It comes with extra features, counters and it is highly extensible, users with Python knowledge can build their own plugins.

Features of dstat:

  1. Joins information from vmstat, netstat, iostat, ifstat and mpstat tools
  2. Displays statistics simultaneously
  3. Orders counters and highly-extensible
  4. Supports summarizing of grouped block/network devices
  5. Displays interrupts per device
  6. Works on accurate timeframes, no timeshifts when a system is stressed
  7. Supports colored output, it indicates different units in different colors
  8. Shows exact units and limits conversion mistakes as much as possible
  9. Supports exporting of CSV output to Gnumeric and Excel documents

How to Install dstat in Linux Systems

dstat is available to install from default repositories on most Linux distributions, you can install and use it for monitoring a Linux system in the process of performance tuning tests or troubleshooting exercises.

# yum install dstat             [On RedHat/CentOS and Fedora]
$ sudo apt-get install dstat    [On Debian, Ubuntu and Linux Mint]

It works in real-time, outputting selective information in columns, including the magnitude and units for stats displayed after every one second, by default.

Note: The dstat output is aimed specifically for human interpretation, not as input for other tools to process.

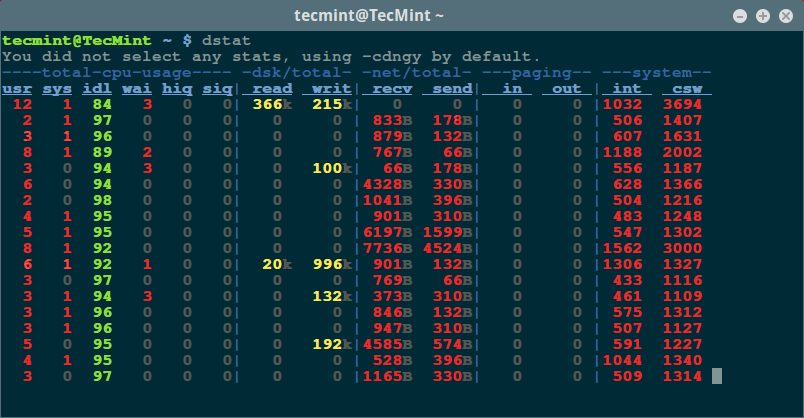
Below is an output seen after running the dstat command without any options and arguments (similar to using -cdngy (default) options or -a option).

$ dstat 
Dstat - Linux Performance Statistics Monitoring

Dstat – Linux Performance Statistics Monitoring

The output above indicates:

  1. CPU stats: cpu usage by a user (usr) processes, system (sys) processes, as well as the number of idle (idl) and waiting (wai) processes, hard interrupt (hiq) and soft interrupt (siq).
  2. Disk stats: total number of read (read) and write (writ) operations on disks.
  3. Network stats: total amount of bytes received (recv) and sent (send) on network interfaces.
  4. Paging stats: number of times information is copied into (in) and moved out (out) of memory.
  5. System stats: number of interrupts (int) and context switches (csw).

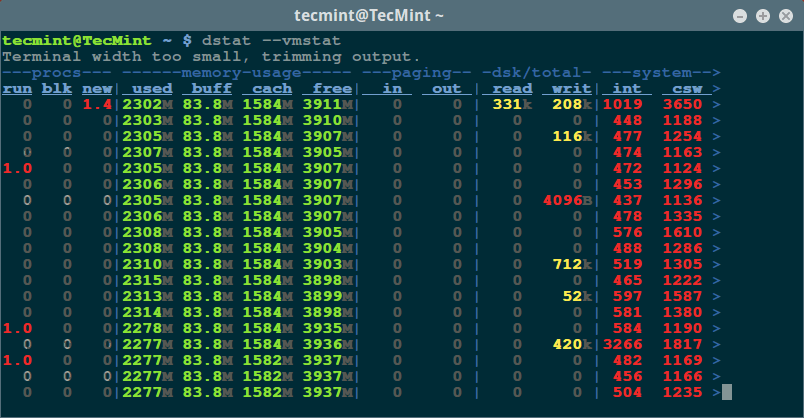
To display information provided by vmstat, use the -v or --vmstat option:

$ dstat --vmstat
Dstat - Linux Process and Memory Monitoring

Dstat – Linux Process and Memory Monitoring

In the image above, dstat displays:

  1. Process stats: number of running (run), blocked (blk) and new (new) spawned processes.
  2. Memory stats: amount of used (used), buffered (buff), cached (cach) and free (free) memory.

I already explained at the last three sections (pagingdisk and system stats) in the previous example.

Suggested Read: Sysstat – All-in-One System Performance and Usage Activity Monitoring Tool For Linux

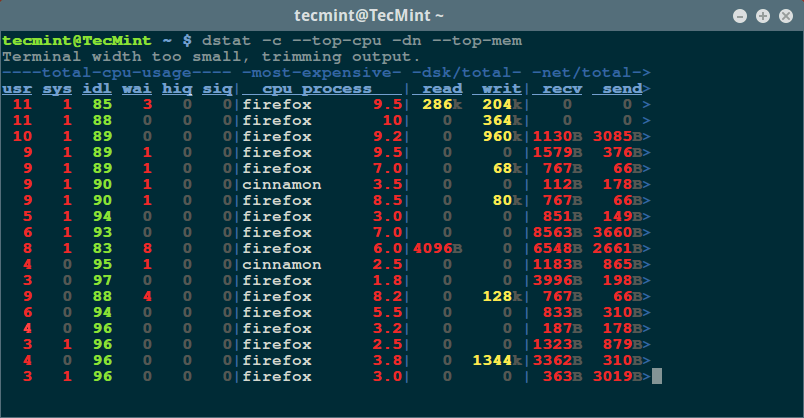
Let us dive into some advanced dstat system monitoring commands. In the next example, we want to monitor a single program that is using the most CPU and consuming the most amount of memory.

The options in the command are:

  1. -c – cpu usage
  2. --top-cpu – process using most CPU
  3. -dn – disk and network stats
  4. --top-mem – process consuming the most memory
$ dstat -c --top-cpu -dn --top-mem
Dstat - Monitor Processes by CPU and Memory Usage

Dstat – Monitor Processes by CPU and Memory Usage

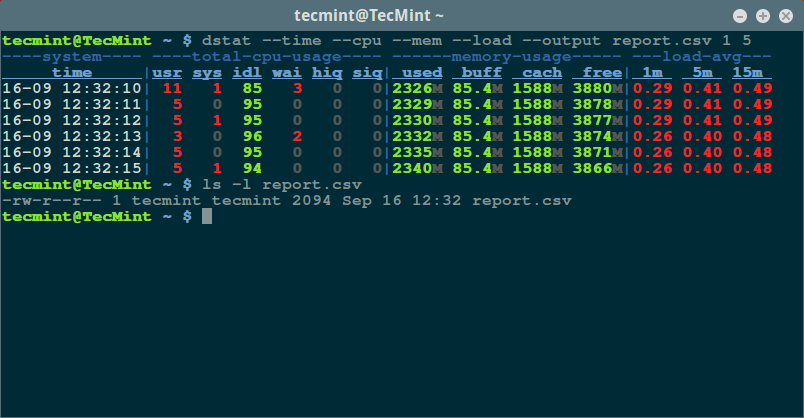
Additionally, you can also store the output of dstat in a .csv file for analysis at a latter time by enabling the --output option as in the example below.

0Here, we are displaying the time, cpu, mem, system load stats with a one second delay between 5 updates (counts).

$ dstat --time --cpu --mem --load --output report.csv 1 5 
Dstat - Monitor Linux CPU Memory and Load

Dstat – Monitor Linux CPU Memory and Load

There are several internal (such as options used in previous example) and external dstat plugins you can use with dstat, to view a list of all available plugins, run the command below:

$ dstat --list
List of Dstat Plugins

List of Dstat Plugins

It reads plugins from the paths below, therefore, add external plugins in these directories:

~/.dstat/
(path of binary)/plugins/
/usr/share/dstat/
/usr/local/share/dstat/

For more usage information, look through the dstat man page or visit the homepage at: http://dag.wiee.rs/home-made/dstat/.

Suggested Read: Collectl: An Advanced All-in-One Performance Monitoring Tool for Linux

dstat is a versatile, all-in-one system resources statistics generating tool, it combines information from several other tools such as vmstat, mpstat, iostat, netstat and ifstat.

I hope this review will be helpful to you, most importantly, you can share with us any suggestions, supplementary ideas to improve the article and also give us feedback about your experience using of dstatthrough the comment section below.

 
Source

How to Monitor Linux Server Security with Osquery

Osquery is a free open source, powerful and cross-platform SQL-based operating system instrumentation, monitoring, and analytics framework for Linux, FreeBSD, Windows, and Mac/OS X systems, built by Facebook. It is a simple and easy-to-use operating system explorer.

It combines a number of tools which perform low-level OS analytics and monitoring; these tools reveal an operating system as a high-performance relational database such as MySQL/MariaDBPostgreSQL and more, where OS concepts are represented in tabular form, thus allowing users to employ SQL commands to carry out system monitoring and analytics.

Osquery use a simple plugin and extensions API to implement SQL tables, there is a collection of tables in existence ready for use, and more are being written. Some tables can only be found on a specific operating system, for instance, you only find the kernel_modules table on Linux systems.

Additionally, you can run queries to monitor and analyze OS state on a single host via the osqueryi shell, or on several hosts on a network via a scheduler or execute them from any of your custom applications using osquery Thrift APIs.

How to Install Osquery in Linux

The Osquery can be installed from the official repository using apt yum or dnf package management tool on your respective Linux distribution as shown.

On Debian/Ubuntu

$ export OSQUERY_KEY=1484120AC4E9F8A1A577AEEE97A80C63C9D8B80B
$ sudo apt-key adv --keyserver keyserver.ubuntu.com --recv-keys $OSQUERY_KEY
$ sudo add-apt-repository 'deb [arch=amd64] https://pkg.osquery.io/deb deb main'
$ sudo apt update
$ sudo apt install osquery

On RHEL/CentOS

$ curl -L https://pkg.osquery.io/rpm/GPG | sudo tee /etc/pki/rpm-gpg/RPM-GPG-KEY-osquery
$ sudo yum-config-manager --add-repo https://pkg.osquery.io/rpm/osquery-s3-rpm.repo
$ sudo yum-config-manager --enable osquery-s3-rpm-repo
$ sudo yum install osquery

On Fedora 22+

$ curl -L https://pkg.osquery.io/rpm/GPG | sudo tee /etc/pki/rpm-gpg/RPM-GPG-KEY-osquery
$ dnf config-manager --add-repo --add-repo https://pkg.osquery.io/rpm/osquery-s3-rpm.repo
$ sudo dnf config-manager --set-enabled osquery-s3-rpm
$ sudo dnf install osquery

How to Monitor and Analyze Linux Using Osquery

Once you have successfully installed Osquery on your system, launch the osqueryi shell to start querying the state of your OS as shown.

$ osqueryi

Using a virtual database. Need help, type '.help'
osquery> 

To get a summarized Linux system information run the following command.

osquery> SELECT  * FROM system_info;

Get Linux System Info

Get Linux System Info

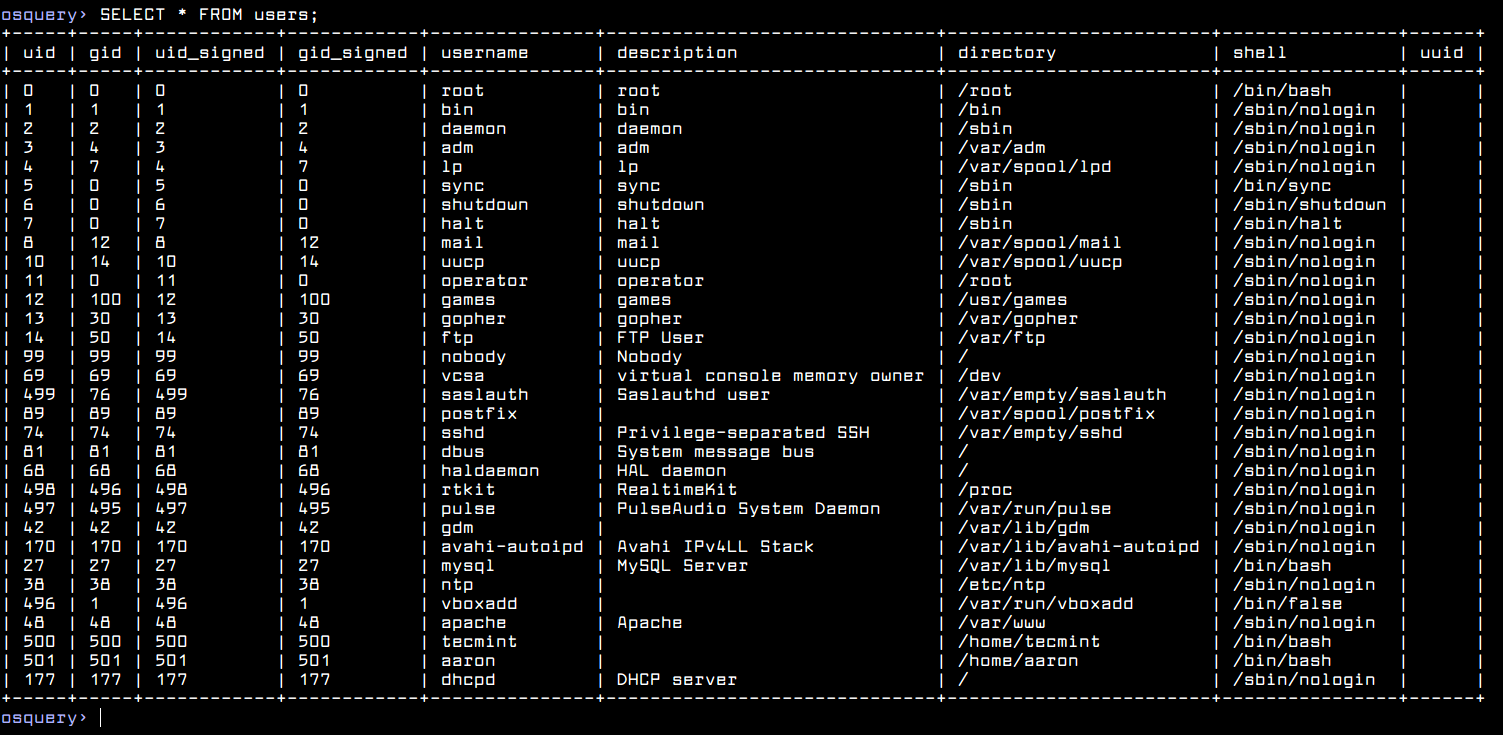
To get a well formated list of all users on the Linux system, run the following query.

osquery> SELECT * FROM users;

List of All Linux Users

List of All Linux Users

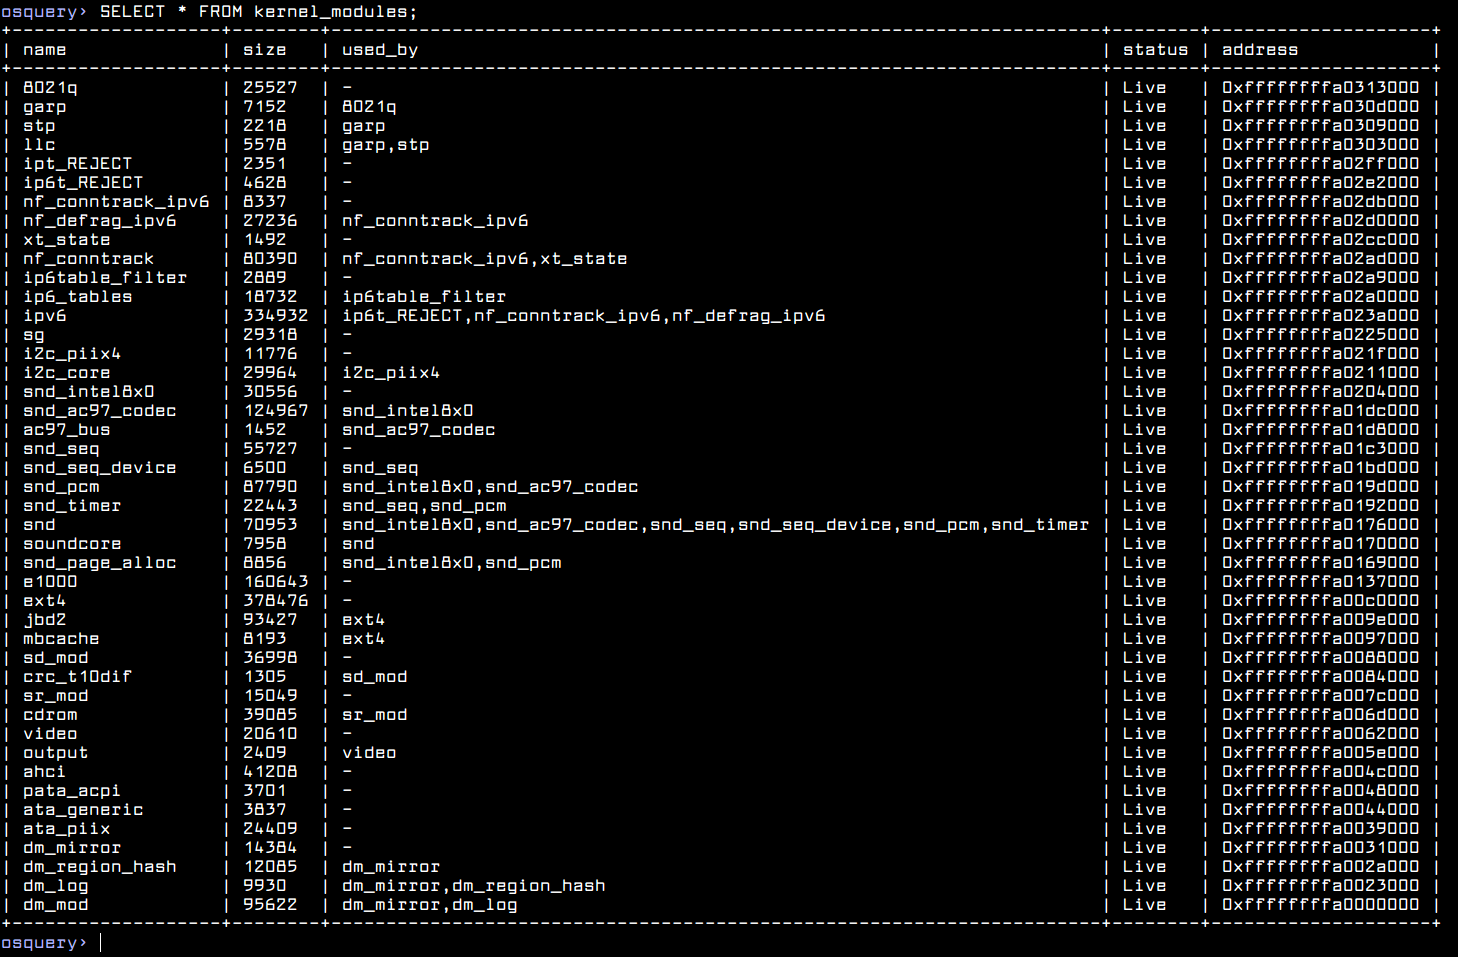
To get a list of all Linux kernel modules and their status, run the following query.

osquery> SELECT * FROM kernel_modules;

List All Kernel Modules in Linux

List All Kernel Modules in Linux

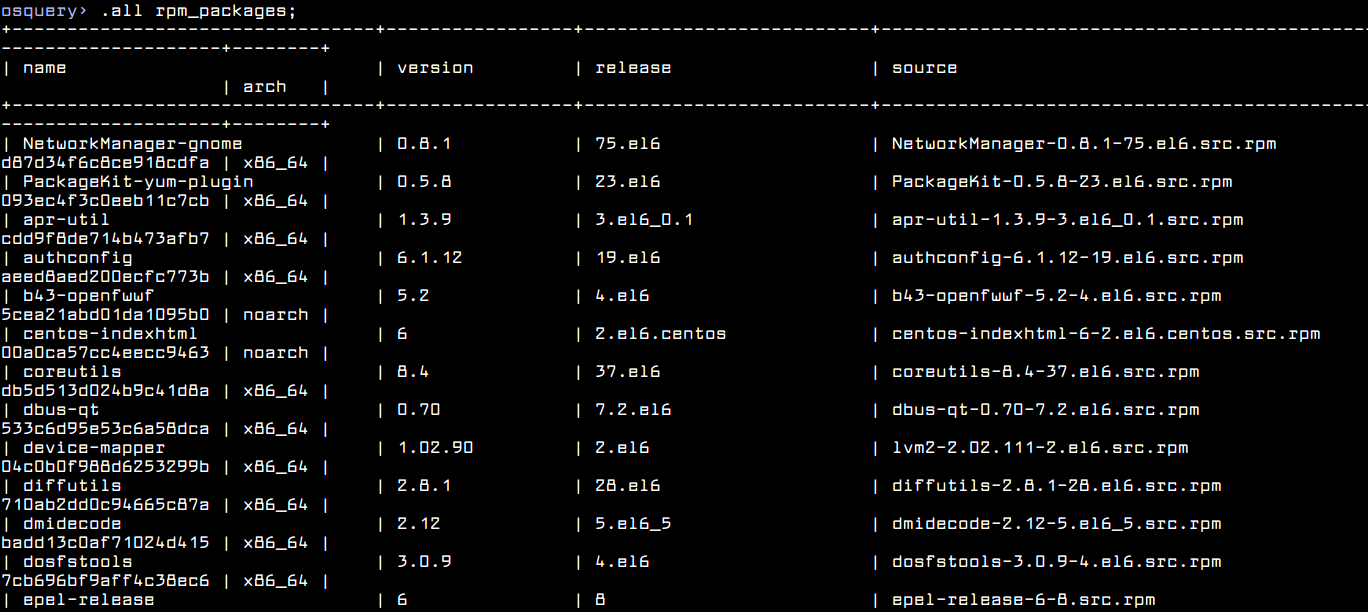
To get a list of all installed RPM packages on CentOS, RHEL and Fedora, run the following query.

osquery> .all rpm_packages;

List All Installed RPM Packages

List All Installed RPM Packages

To get a informatin about running Linux processes, run the following query.

osquery> SELECT DISTINCT processes.name, listening_ports.port, processes.pid FROM listening_ports JOIN processes USING (pid) WHERE listening_ports.address = '0.0.0.0';

List Linux Processes Information

List Linux Processes Information

If you are running osquery on a desktop and have Firefox or Chrome installed, you can list all your add-ons using the following query.

osquery> .all firefox_addons;
osquery> .all  chrome_extensions;

To display a list of all implemented tables in Linux, use the .tables command as shown.

osquery> .tables;	#list all implemented tables
osquery> .help; 	#view help message

Osquery also provides file integrity monitoring (FIM), and process and socket auditing features and more, thus it is an intrusion detection tool, but this calls for certain configurations before you can deploy it for such a purpose. You can find more information from the Osquery Github repository.

Source

WP2Social Auto Publish Powered By : XYZScripts.com