As computing devices quickly surpass the requirements of operating systems, it has increasingly become more efficient for organizations to invest/migrate to virtualized systems. Operating system virtualization technologies aren’t anything new but over the last several years they have become more and more popular as data centers look to provide more functionality in the same or less amounts of physical space. By simply leveraging un-used resources on powerful servers/workstations companies can effectively run multiple logical servers on one or several physical servers.

XenServer Installation and Configuration Guide – Part 1
Citrix offers such a solution, known as XenServer, which utilizes the popular Linux Xen hypervisor. The Xen hypervisor is referred to as a “bare-metal hypervisor” meaning that it is installed to the physical server and acts as a resource manager for all of the virtualized server instances that will be run on top of Xen.
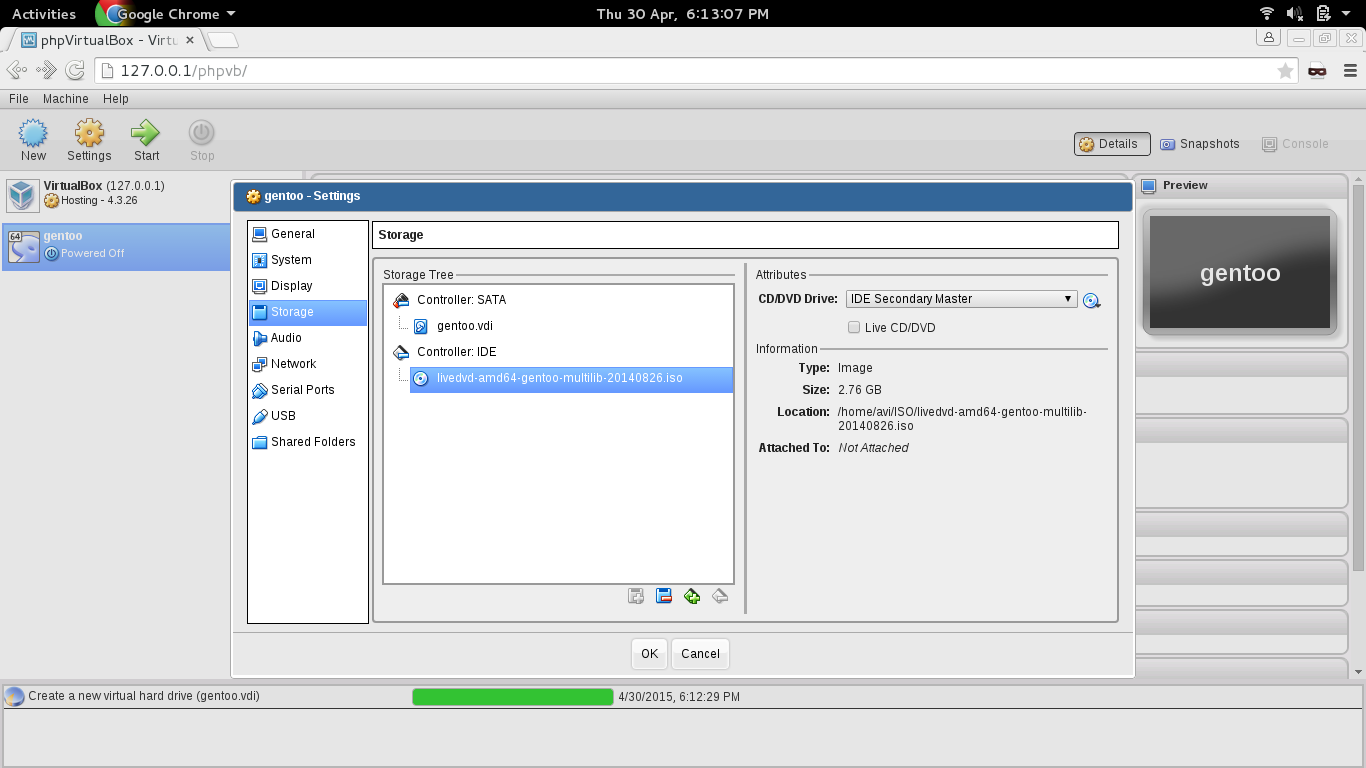
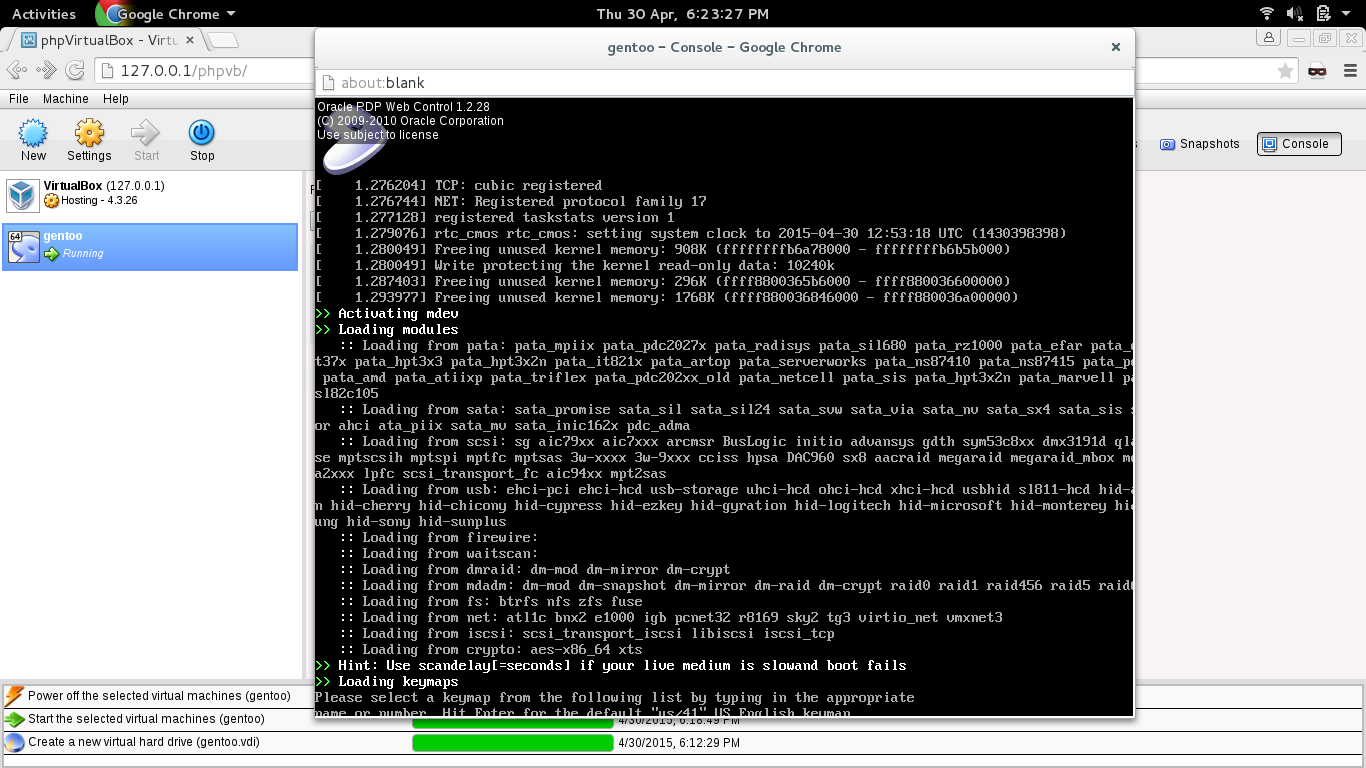
This contrasts to systems such as Virtualbox which require a Linux/Mac/Windows operating system to be installed and then virtual machines created within the Virtualbox application. This type of hypervisor is generally referred to as a hosted hypervisor. Both types of hypervisors have their place and benefits but this particular article is going to look at the bare-metal hypervisor in XenServer.
In this 5-article Citrix Xenserver series, we will going to cover the following topics:
Part 1: Installation and Configuring XenServer 6.5
Update*: In May 2016, Citrix released the new version of the XenServer 7 platform.
This first article will walk through the process of installing and configuring Citrix XenServer. Future additions to this article will walk through adding virtual machine storage repositories, XenServer pooling, creating virtual machines on the XenServer, as well as managing XenServers with XenCenter and Xen Orchestra as discussed above series.
System Requirements
- XenServer 6.5 ISO : http://xenserver.org/open-source-virtualization-download.html
- Server capable of virtualization
- Hardware Compatibility List is here: http://hcl.xenserver.org/
- Many systems will work even if not listed but results may vary, use at your own risk.
- Minimum 2GB ram; 4GB or more recommended to run virtual machines
- Mimimum 1 64bit 1.5GHz cpu; 2GHz or more and multiple CPUs are suggested
- Harddrive space of at least 16GB; more required if virtual machines will be saved locally
- At least a 100mbps network card; multiple gigabit suggested
Test System Configuration
- 1 IBM X3850
- 4 hexcore 2.66 GHz CPUs
- 64gb ram
- 4 gigabit NIC cards
- 4 300GB SAS drives (overkill but it was all that was available)
- 24TB Dell PE5500E for storage of the virtual machine disks (Not necessary if enough local space exists on the XenServer)
All in all this server is primed to be a stellar XenServer so let’s begin the installation process.
Installation of Citrix Xenserver 6.5 Guide
1. The first step in the installation is to download the XenServer ISO file. This can easily be accomplished by visiting the link above or using the ‘wget‘ utility on a Linux system.
# wget -c http://downloadns.citrix.com.edgesuite.net/10175/XenServer-6.5.0-xenserver.org-install-cd.iso
Now burn the ISO to a CD or using ‘dd‘ to copy the ISO to a flash drive.
# dd if=XenServer-6.5.0-xenserver.org-install-cd.iso of=</path/to/usb/drive>
2. Now place the media into the system that XenServer will be installed and boot to that media. Upon successful boot the user should be greeted by the wonderful Citrix XenServer boot splash.
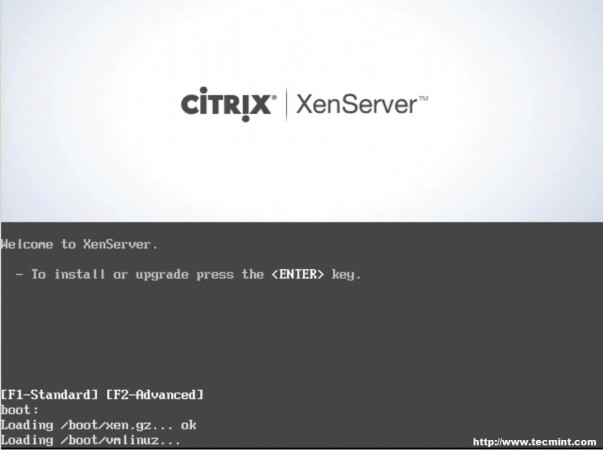
XenServer Boot Menu
3. At this point simply press enter to begin the booting process. This will boot the user into the XenServer installer. The first screen will ask the user to provide a language selection.
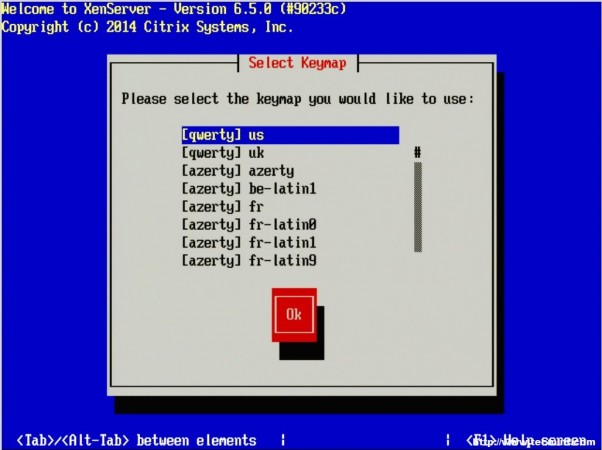
Select XenServer Installation Language
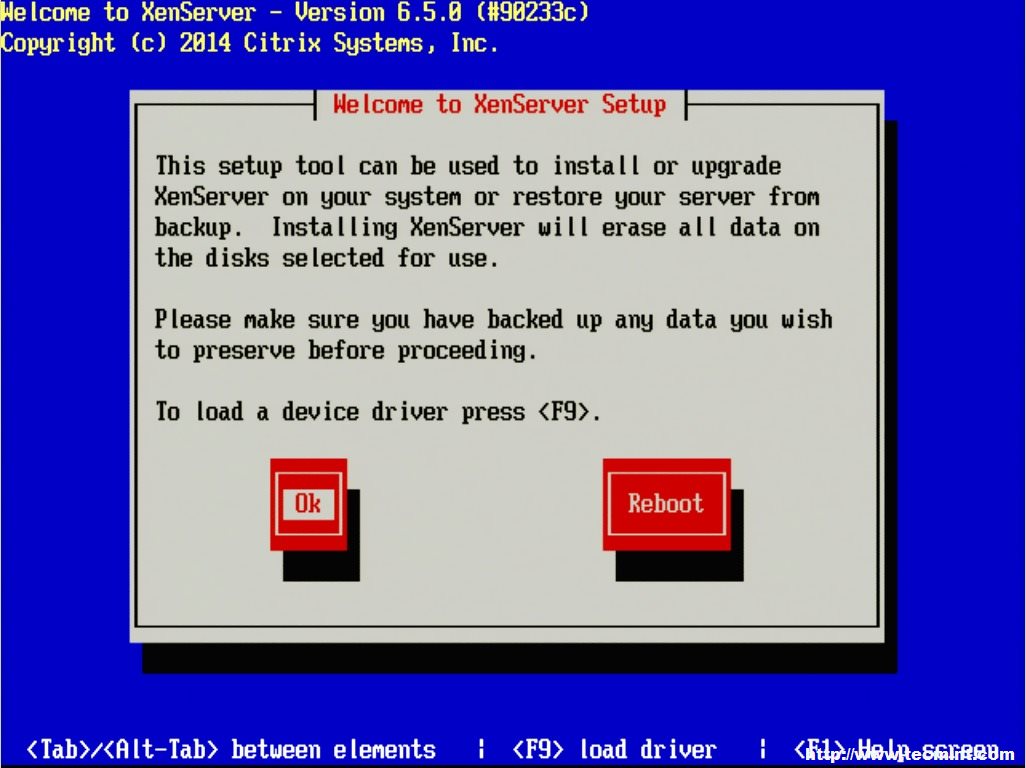
4. The next screen asks the user to confirm the reason for booting to this media as well as provide the option to load extra hardware drivers if needed. In this particular case, it is to install XenServer to the machine so it is safe to click “OK”.
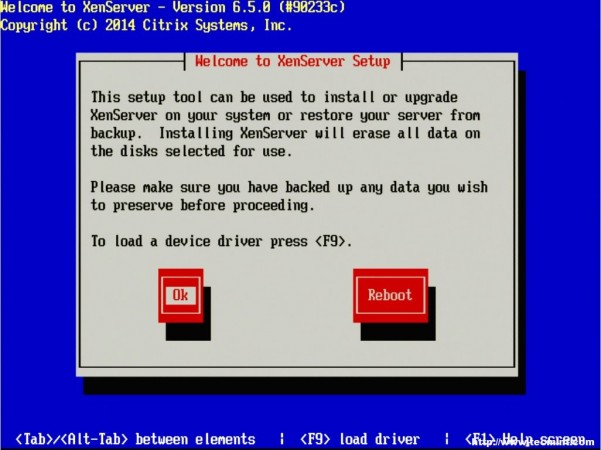
Load XenServer Device Driver
5. The next prompt is the obligatory EULA (End User License Agreement). Feel free to read the whole thing, as your supposed to anyways right, otherwise using the keyboard arrows move the cursor over to the “Accept EULA” button and hit enter.
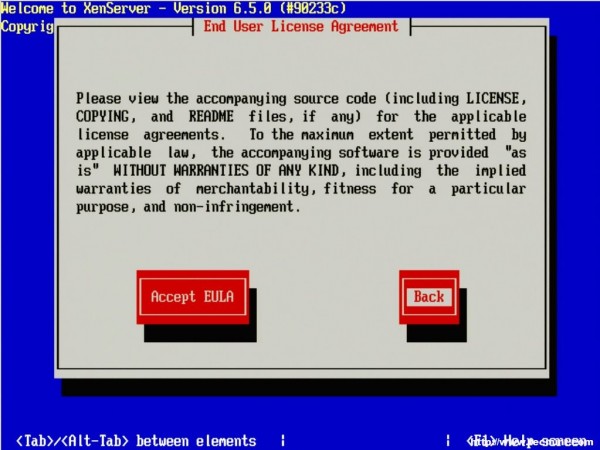
Accept License Agreement
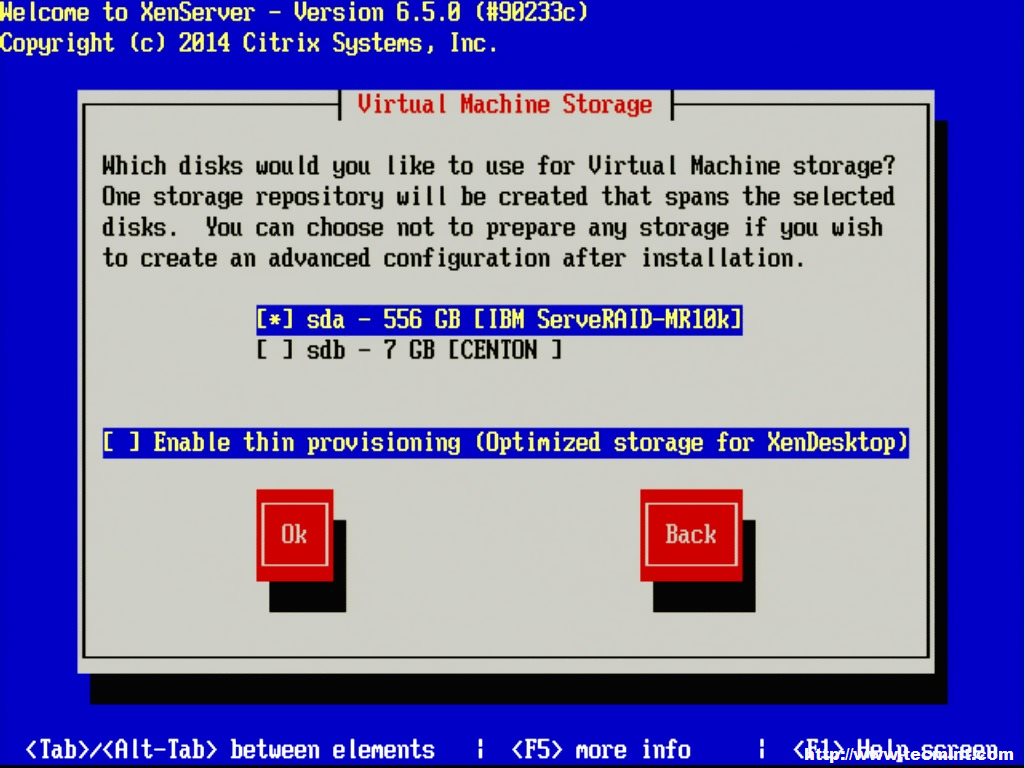
6. The next screen requests the installation device. In this example the RAID setup on the server is where XenServer will be installed.
The RAID system is reflected as “sda – 556 GB [IBM ServeRAID-MR10k]” For this guide, thin provisioning is not necessary. Make sure the the asterisk ( * ) character is next to the hard drive selection to install XenServer and tab to the “OK” button.
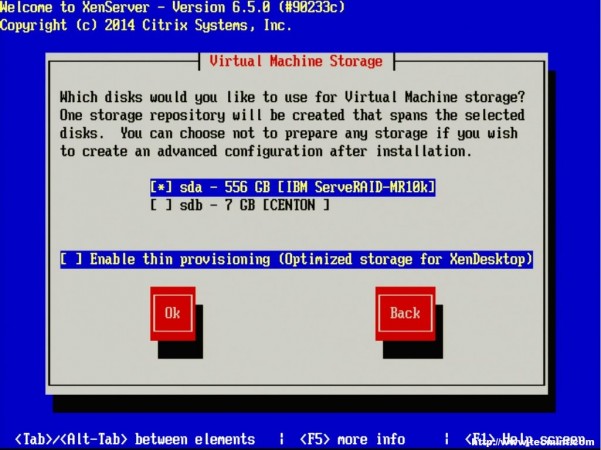
Select XenServer Virtual Machine Storage
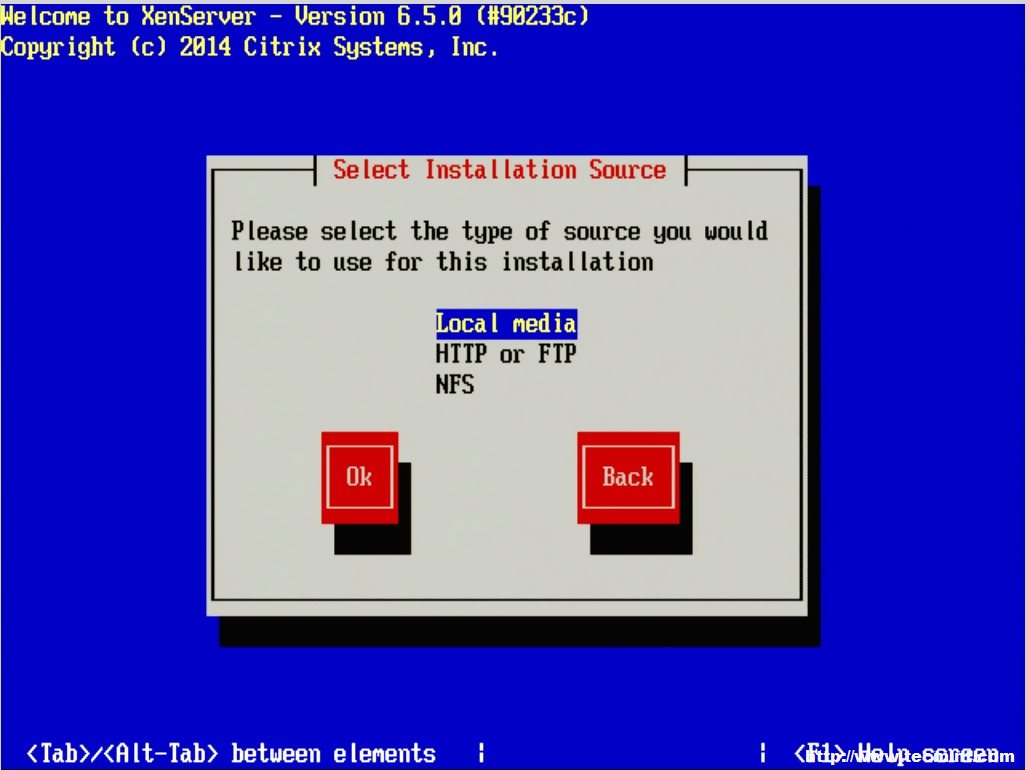
7. The next screen will prompt the user for the location of the installation files. Since the installer was boot locally with a CD/DVD/USB, make sure to select the “Local Media” option.
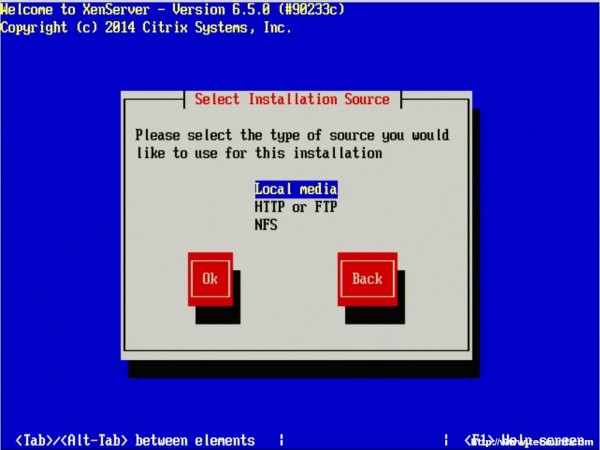
Select XenServer Installation Source
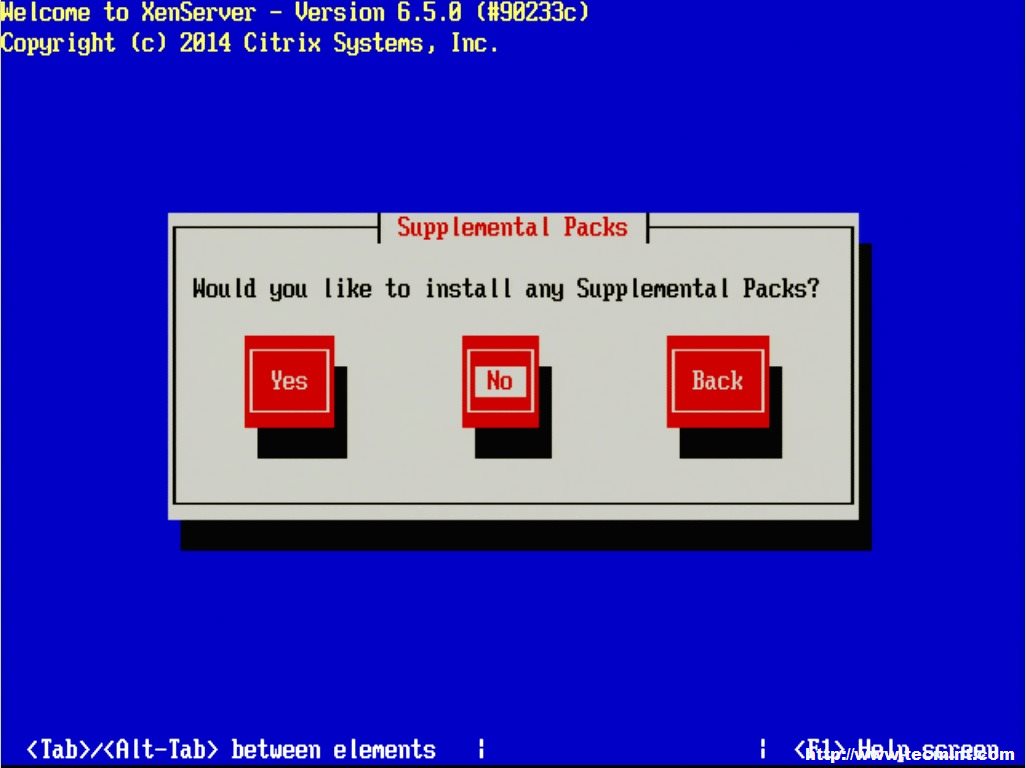
8. The next step allows for the installation of Supplemental Packs (SP) at the time of install. For this guide, none of the supplemental packs available will be installed at this point but will be covered later once XenServer is up and running.

Select Supplemental Packs
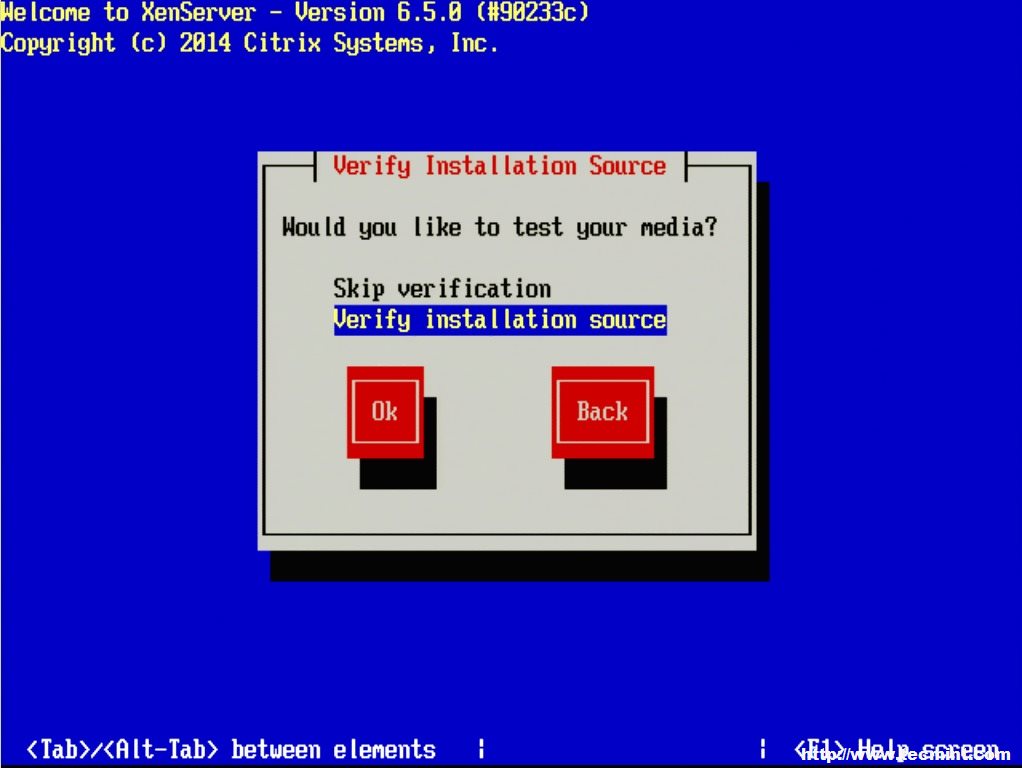
9. The next screen will ask if the user wishes to verify that the installer media is not corrupt. Generally this is a good idea but is a personal choice. All in all the verification on this test server took about 3 minutes from a CD.
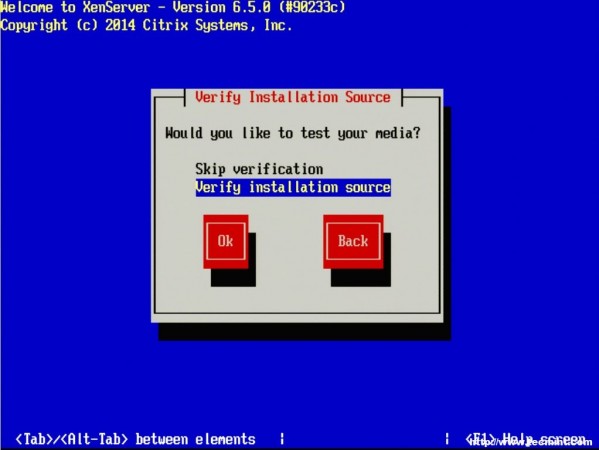
Verify XenServer Installation Media
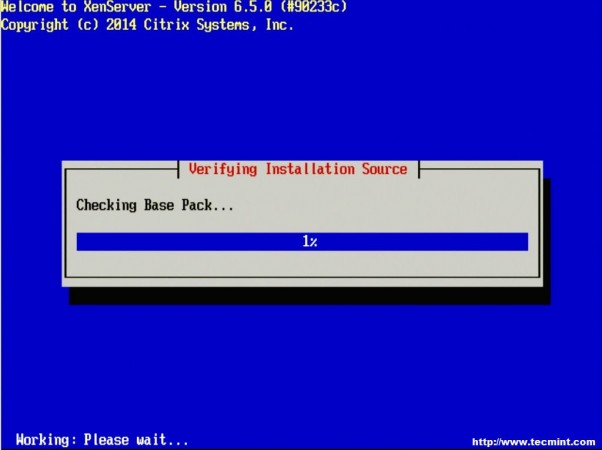
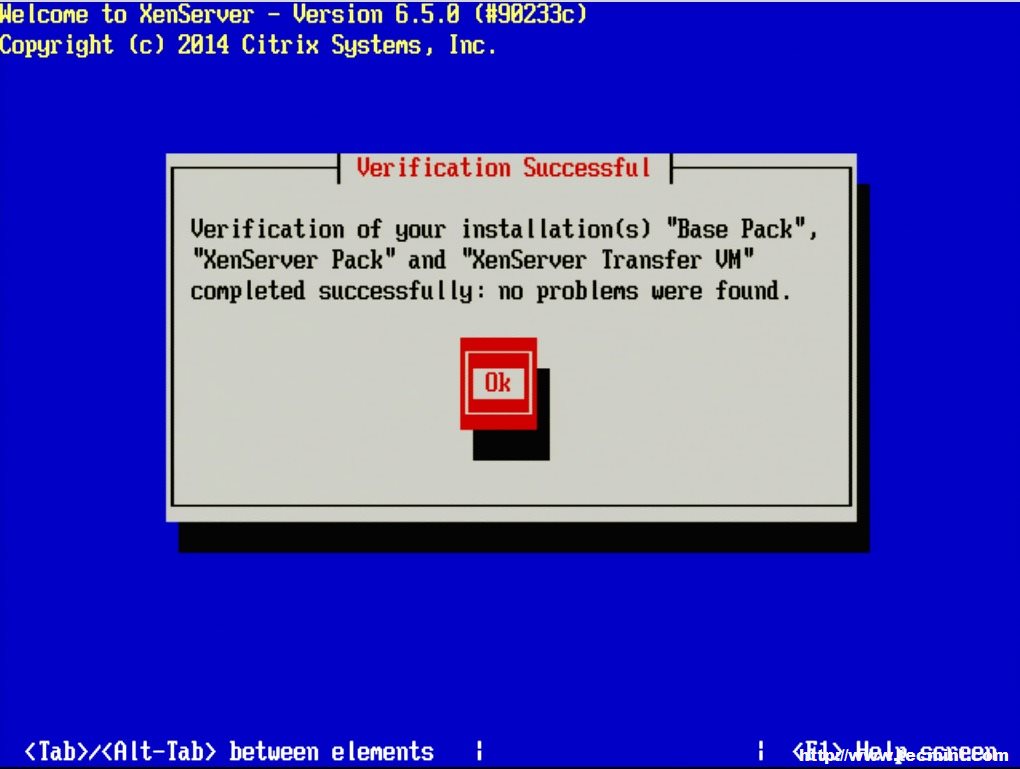
Checking Base Pack

Verification Successful
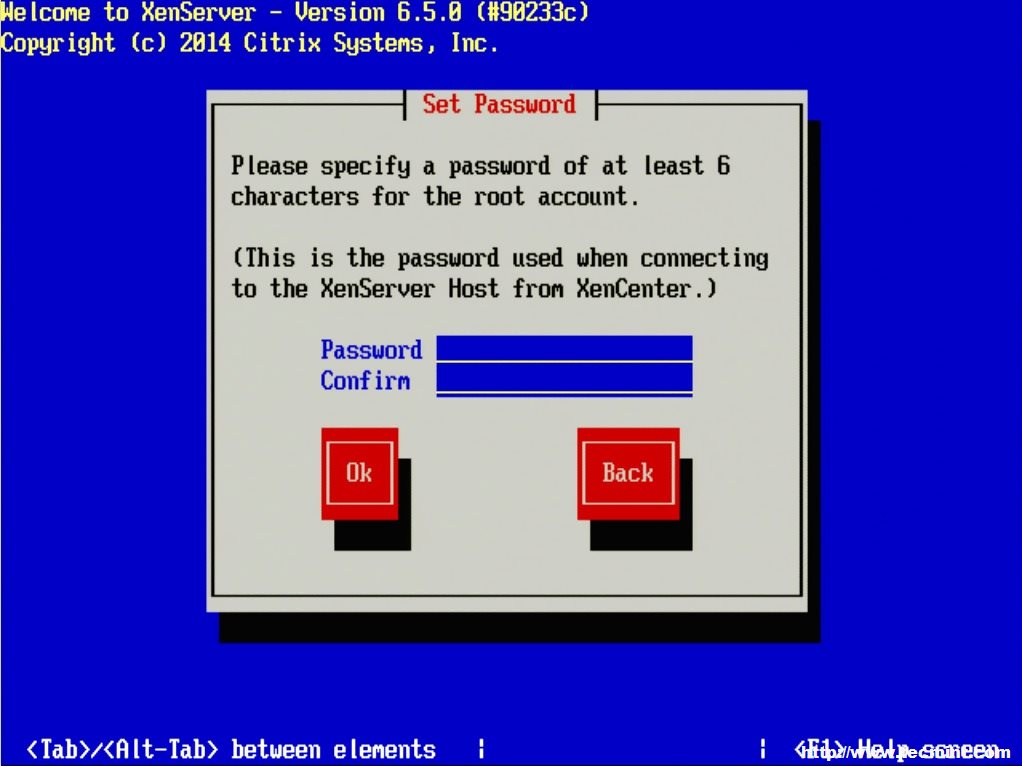
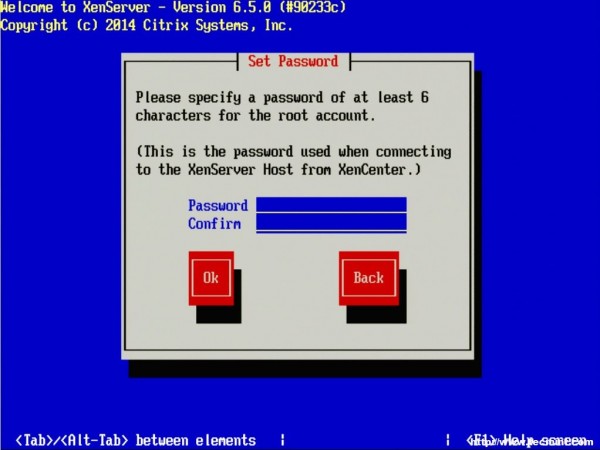
10. Once the verification is completed, if selected during install, the XenServer installer will ask the user to setup some system information.
The first prompt will be to set the root user’s password. Now, since XenServer will be the underlying system to potentially several important virtualized servers, it is imperative that the password be secured as well as sufficiently complex!
Important: Do not forget this password either as there will not be any other users on the system once the installer finishes!
Set XenServer Root Password
11. The next screen will ask the user to chose a management interface. The number of interfaces that shows up will vary from system to system and the management interface doesn’t have to be a separate interface. A separate interface can be used to secure administrative access to the hypervisor itself.
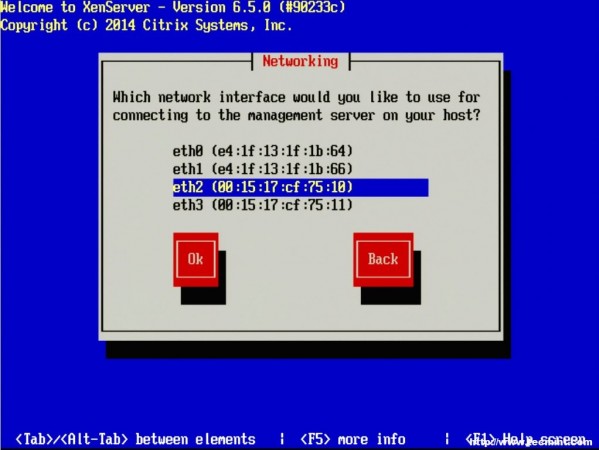
Configure XenServer Network
12. Once the management interface is selected, the system will prompt for how to obtain an IP address for the management interface. This step will obviously vary from site to site as well.
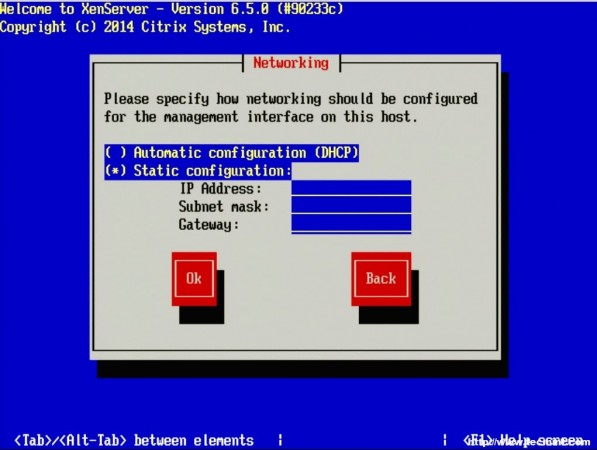
Set XenServer IP Address
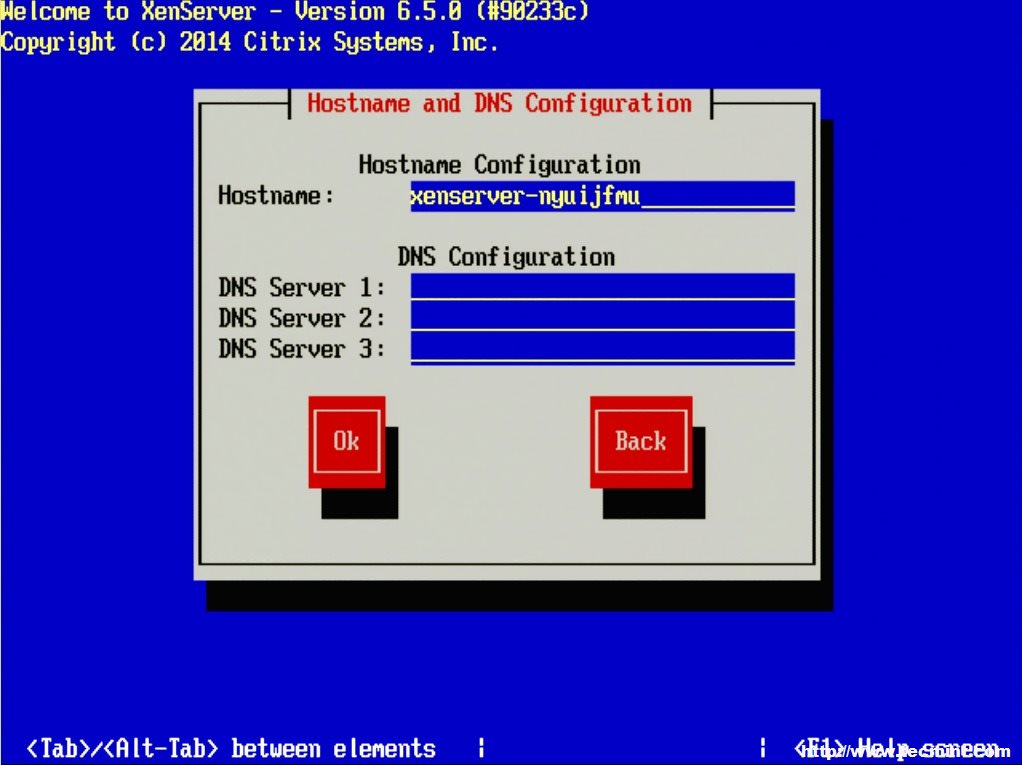
13. After determining the IP address information for the XenServer, the system will ask for a hostname to be set as well as DNS server configuration.

Hostname and DNS Configuration
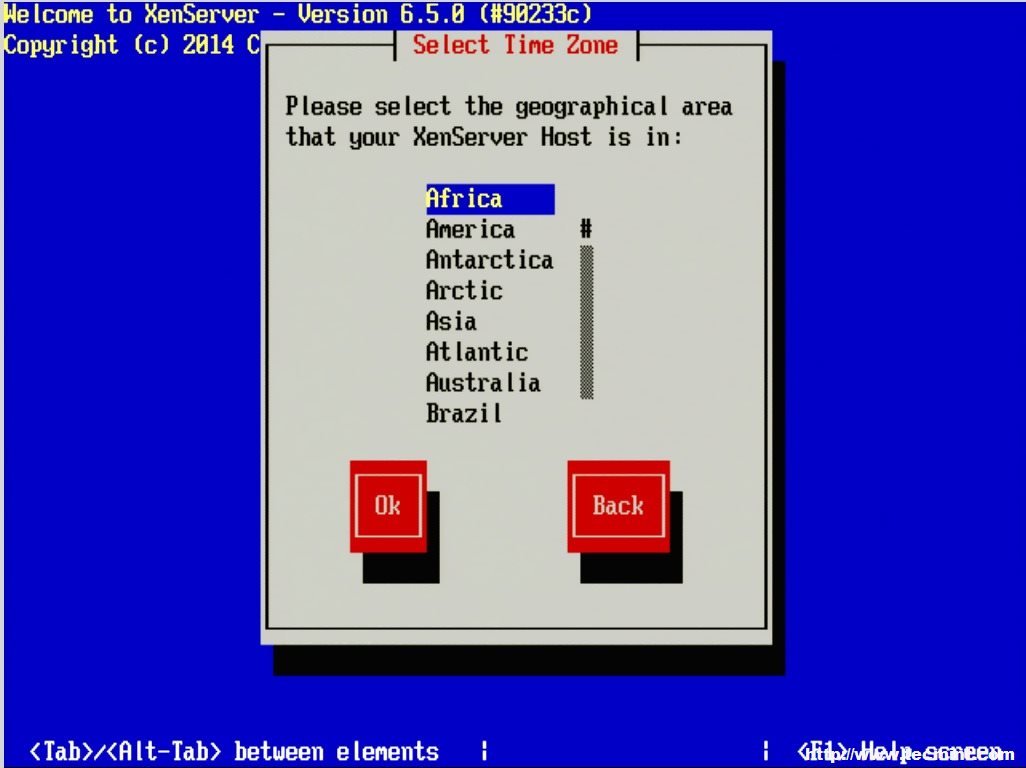
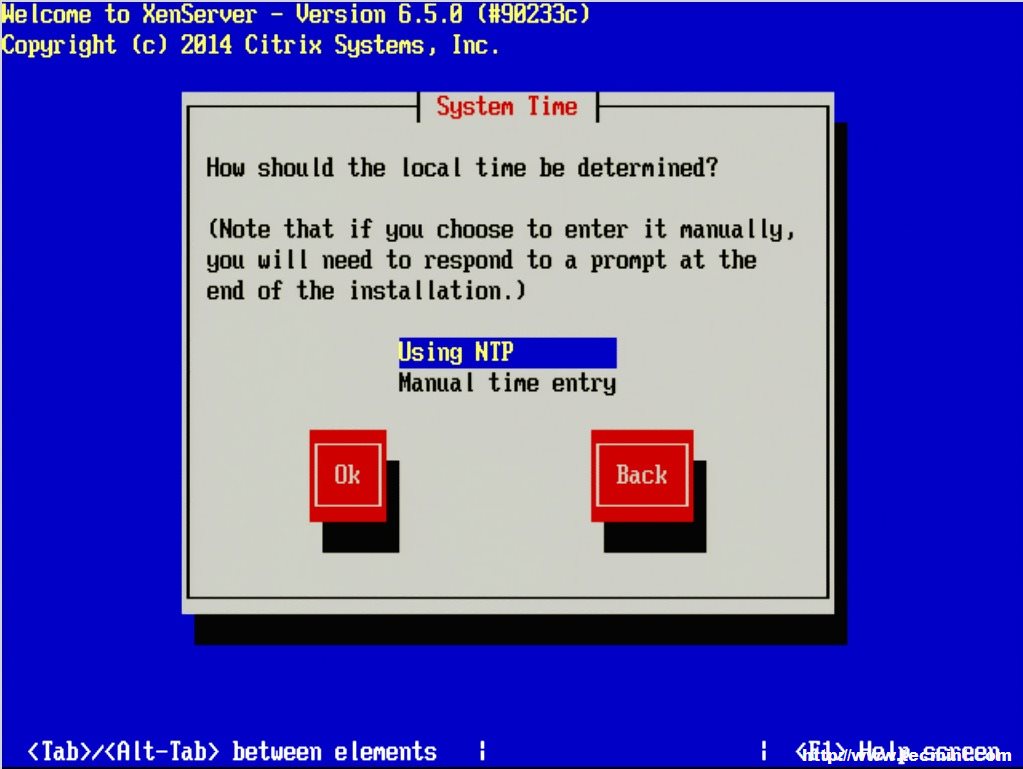
14. The next three screens will go through the steps of setting up time zones as well as the method for keeping track of time. Generally, Network Time Protocol is suggested for keeping system time synchronized on systems but again this will vary from location to location.
If a network time server isn’t available or the XenServer doesn’t have access to the Internet time servers, the installer will allow for manual time setting.
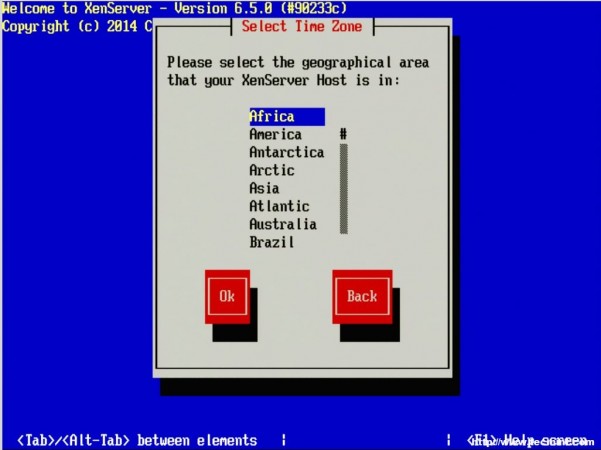
Set Time Zone
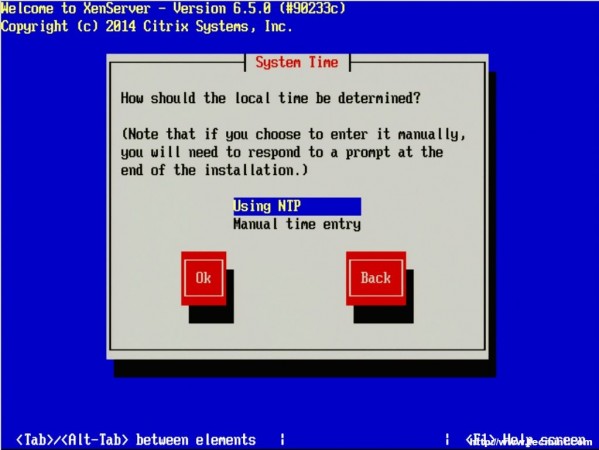
Set Time Using NTP
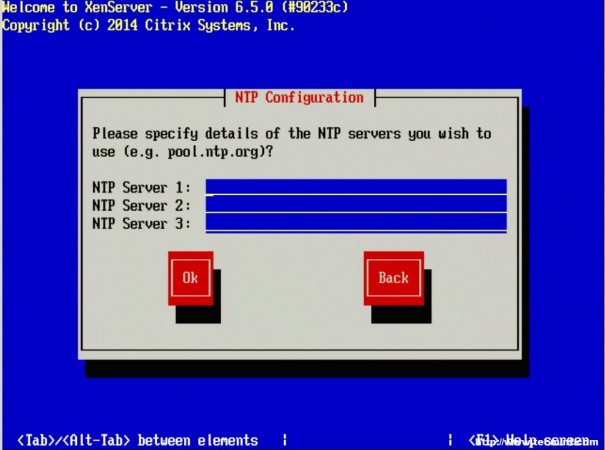
Add NTP Servers
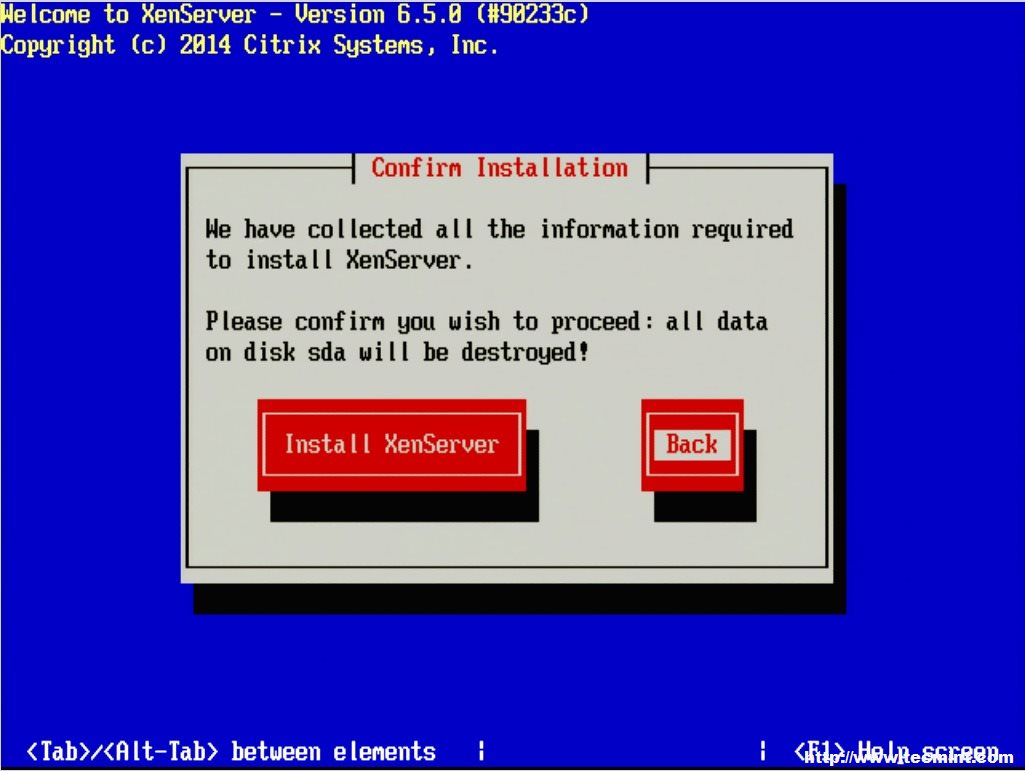
15. At this point all of the initial configuration parameters will be complete and the XenServer installer will be ready to begin the installation of the hypervisor.
WARNING – Continuing at this point WILL ERASE ALL DATA on the target disks!

Confirm XenServer Installation Drive
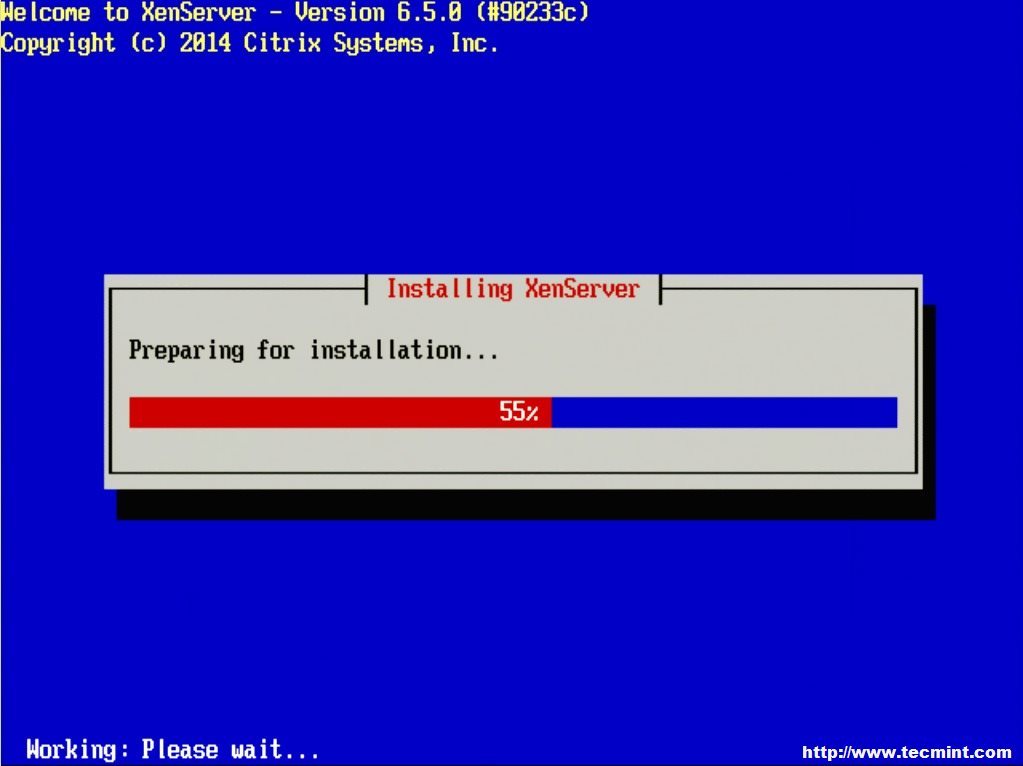
16. The installation will take some time but a progress bar will be displayed. Once the installer is done, it will prompt the user to restart the system to boot to the newly installed hypervisor (be sure to remove the XenServer installation disk upon reboot).
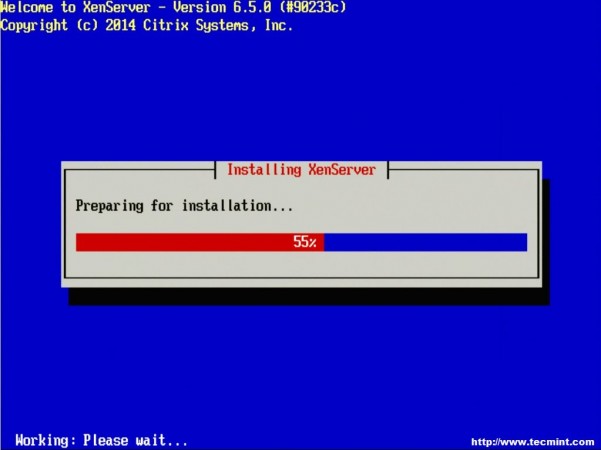
Preparing XenServer Installation
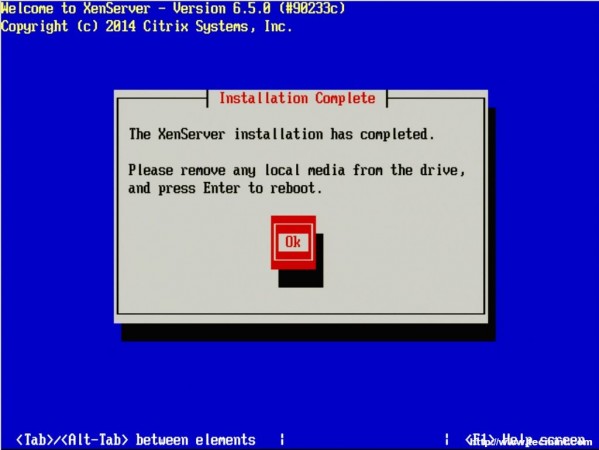
XenServer Installation Complete
17. Upon removing the installation media and rebooting the system, the user should be presented with the Citrix XenServer splash page. Allow the system to continue booting.
Citrix XenServer Booting
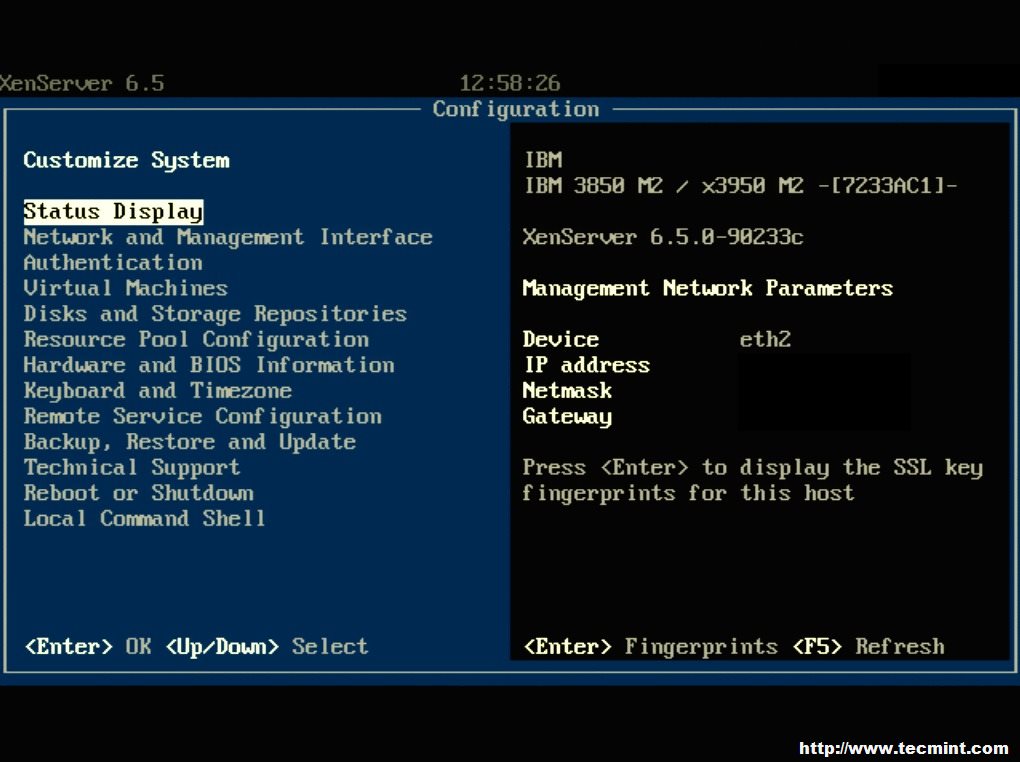
18. Once the booting has completed, the system will present the XenServer control page.
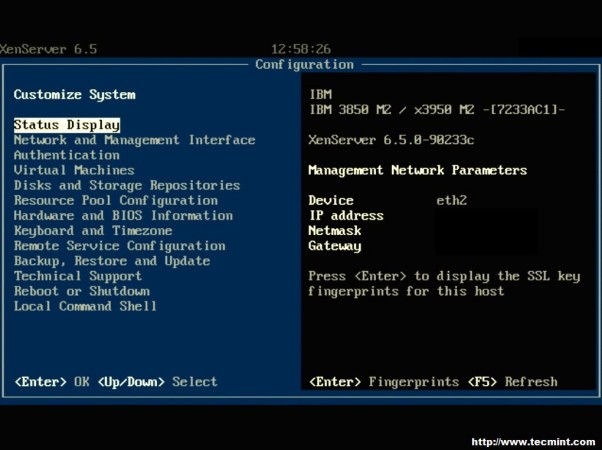
XenServer Configuration Page
Congratulations! XenServer was successfully installed and is now ready to have any hotfixes/supplemental packs applied, storage repositories designated, and ultimately virtual machines created. The next step in this series will address the methods available to patch a XenServer system with patches from Citrix.
Installing XenServer 6.5 Patches with Local Media and Remotely – Part 2
Patching a XenServer install is a crucial task to ensure security updates are applied to vulnerable XenServer installs. While in theory the hypervisor is secure from the virtual machines it supports, there are still some potential issues that could happen and Citrix, as well as the rest of the open source community, do their best to provide code updates for these vulnerabilities as they are discovered.

Install XenServer Patches in Linux – Part 2
That being said, these updates aren’t applied automatically by default and require administrator interaction. Patches also aren’t always security issues. Many times patches will provide increased functionality to the virtual machines hosted on the XenServer. Applying these updates is typically very easy and straight forward and can be done remotely or with local media (local to the XenServer).
While this article is going to walk through applying patches to one XenServer, it is important to note that in the event that multiple pooled XenServers need updated, tools exist to allow the pool master to push the updates out to all of the other XenServers in the pool!
Let’s begin the process of updating a single XenServer by means of local media. Local in this instance means that the administrator has put the update files onto a CD/DVD/USB or similar device and will physically connect this media to the XenServer needing updated.
The first step in this whole process is to obtain the patches. Publicly available patches can be obtained from the following URL:
- http://support.citrix.com/article/CTX138115
This guide is going to walk through installing the XenServer 6.5 SP1 patch both using local media as well as remotely sending the update files to the server and then updating remotely.
The patch files are located here: http://support.citrix.com/article/CTX142355
This supplemental pack contains a lot of the patches already put out for XenServer 6.5. It is important to note Citrix’s notes about any patch as many patches require other patches be installed BEFORE! The only prerequisite for this patch is that XenServer 6.5 be installed (which should be covered already).
The file can be downloaded via http or via the wget tool.
# wget -c http://downloadns.citrix.com.edgesuite.net/10340/XS65ESP1.zip
Installing Patches with Local Media
Once the file is downloaded, the contents of the zip file need to be extracted. This can be accomplished with gui tools or via the command line using the ‘unzip‘ tool.
# unzip XS65ESP1.zip
Upon successful completion, two files should now exist in the current working directory. The one of importance will be the file with the extension ‘.xsupdate‘.
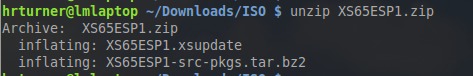
Unpack Xen Patch Update
Now the file ‘XS54ESP1.xsupdate‘ needs to be copied to the installation media. Once the file has been transferred to the media, connect the media to the XenServer in need of the patch.
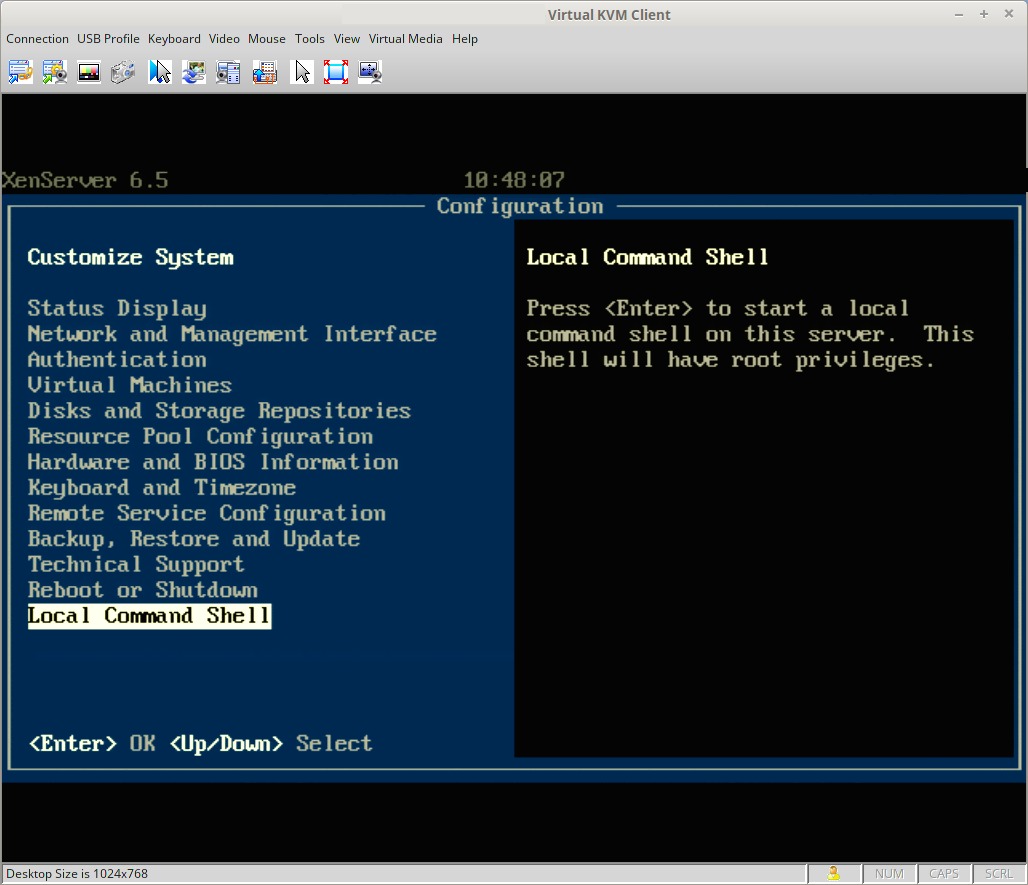
At this point a monitor and keyboard connected to the server will be needed to complete the update process. Upon connecting a monitor to the XenServer, the XenServer control panel page should be visible. Scroll down to the ‘Local Command Shell‘ selection and hit enter.
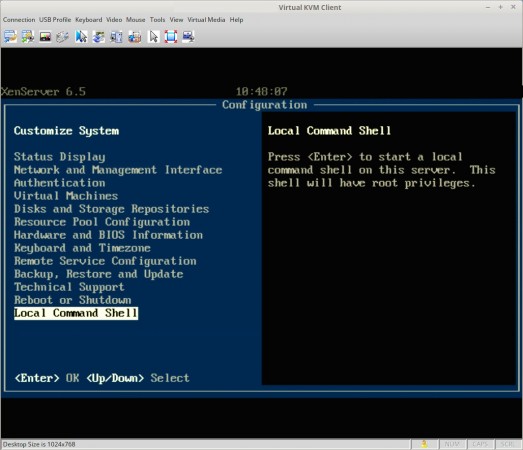
Xen Server Local Command Shell
This will prompt the user for the XenServer root user password and upon successfully entering that password, the user will be in a command prompt within the XenServer. At this point, the local media will need to be mounted to be accessible to XenServer. In order to do this, the name of the block device needs to be determined using the ‘fdisk‘ utility.
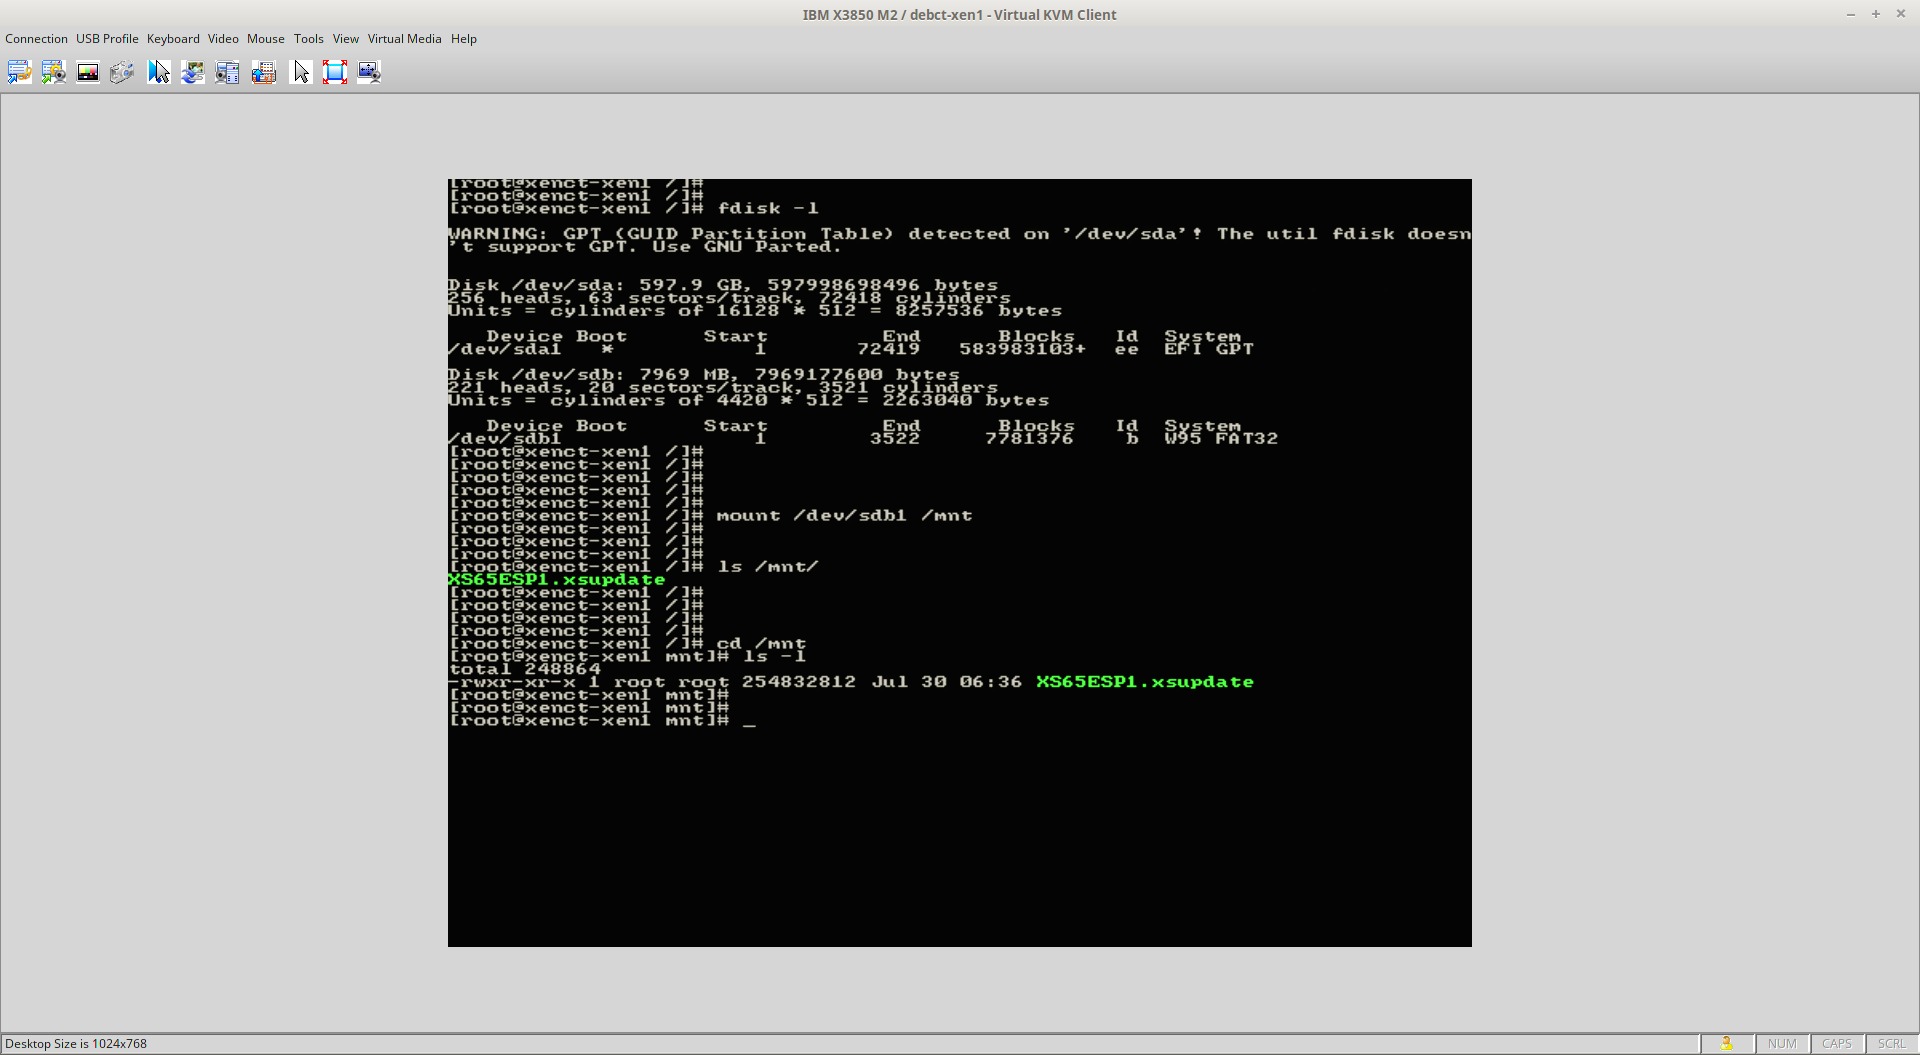
# fdisk -l
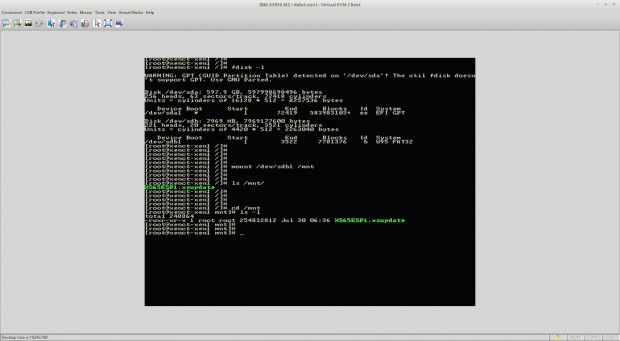
Find Media Disk
From this output the device name of the USB device plugged into the XenServer can be determined as ‘/dev/sdb1‘ and this is what will need to be mounted in order to access the update file. Mounting this device can be accomplished using the ‘mount‘ utility.
# mount /dev/sdb1 /mnt

Mount Device
Assuming that the system didn’t throw out any errors, the USB device should now be mounted to the ‘/mnt‘ directory. Change to this directory and make sure that the update file is indeed showing up in this directory.
# cd /mnt
# ls

Check Mounted Device
At this point, the update file is accessible to the server and ready to be installed using the ‘xe‘ command. The first thing to do is prepare the patch file and obtain the UUID of the patch file with the ‘xe patch-upload‘ command. This step is important and must be done!
# xe patch-upload file-name=XS65ESP1.xsupdate

Prepare XenServer Patch File
The box in red above is the output from the above command and will be needed when ready to actually install the patch to the XenServer system. Now the UUID of the XenServer itself is needed and can be determined again by passing arguments to the ‘xe‘ command.
# xe host-list

Check XenServer UUID
Again the box in red is the UUID value that will be needed in order to apply the patch to this particular XenServer. At this point all of the necessary commands have been run and the UUID’s determine.
Once more using the ‘xe‘ command with different arguments, XenServer will be instructed to install the supplemental pack to this local system.
# xe patch-apply uuid=7f2e4a3a-4098-4a71-84ff-b0ba919723c7 host-uuid=be0eeb41-7f50-447d-8561-343edde9fad2

Apply Patch to XenServer
At this point, the system will begin installing the update but will show nothing more than a flashing cursor until the process is completed. Once the system returns to a command prompt, the system can be checked to confirm that the patch was indeed installed again using the ‘xe’ command with different arguments.
# xe patch-list | grep -i sp1
This command will list all patches applied and then pipe that output into grep which will search for the string ‘sp1‘ regardless of case. If nothing is returned, then the patch likely did not install successfully.

List XenServer Installed Patches
If the command returns output similar to the above screen-shot, then the supplemental pack was installed successfully!
Installing Patches Remotely
In the event that the administrator doesn’t have physical access to the XenServer or has the option to install patches remotely, the following steps will walk through patching the system remotely.
The first steps for installing the patches remotely is downloading the patch files from Citrix. The file can be downloaded via http or via the wget tool.
# wget -c http://downloadns.citrix.com.edgesuite.net/10340/XS65ESP1.zip
Now the update zip file needs to be transferred to the XenServer system. The entire zip file can be transferred or the contents of the zip can be extracted and then only the file ending in ‘.xsupdate‘ can be transferred.
This can easily be accomplished through the use of the secure copy tool, ‘scp‘. This will assume that the XenServer still has SSH enabled and that the user has the ability to SSH into the system.
# scp XS65ESP1.xsupdate root@server_ip:/root/
The above command will transfer the file ‘XS65ESP1.xsupdate‘ to the system indicated by ‘server_ip‘ and place the file in the directory ‘/root‘.

Upload Patch to XenServer
The transfer appears to have been successful and the rest of the process will require a command shell to the XenServer via SSH.
# ssh root@server_ip
This will log into the XenServer and place the user in root’s home directory. From the previous scp command, root’s home directory is the place where the file should have been transferred. Using the ‘ls‘ command, confirm that the patch files are indeed on the system.
# ls -l
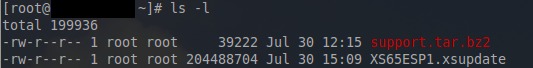
Confirm Xen Patches
The output above shows that the xsupdate file is indeed in root’s home directory and confirms the the scpcommand earlier was successful. Now a series of ‘xe‘ commands are needed to prepare this patch for installation.
The first ‘xe‘ command will return the UUID of the patch file to be installed.
# xe patch-upload file-name=XS65ESP1.xsupdate

Confirm Patch UUID
The string of numbers in red indicate the UUID of the patch file to be installed and will become important in a few steps.
The next process is to again use the ‘xe‘ utility to determine the UUID of the XenServer on which this patch will be applied.
# xe host-list
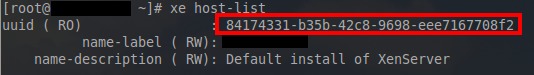
Find XenServer UUID
Again the UUID in red will be needed to specify which XenServer instance to apply this particular patch. Now that all of the UUID’s are available, it is time to apply the patch to the system with the use of the ‘xe‘ utility.
# xe patch-apply uuid=7f2e4a3a-4098-4a71-84ff-b0ba919723c7 host-uuid=84174331-b35b-42c8-9698-eee7167708f2

Apply Patch to XenServer
At this point, the prompt will display nothing but a flashing cursor until the patch installs. Once the prompt returns, confirmation of the patch installation can be determined by another ‘xe‘ command.
# xe patch-list | grep -i sp1

Check Installed Xen Patches
If the above command doesn’t produce any output, there may have been an issuing installing the patch. Otherwise, the output above indicates that the patch was successfully applied to this particular system!
If you have made it to this point of the article, hopefully XenServer 6.5 is running and completely patched with SP1.
In the not too distant future there will be more articles covering setting up XenServer storage repositories, networking, creating virtual machines, managing XenServer with a web interface known as Xen Orchestra, and managing XenServer with the approved Citrix application known as XenCenter.
XenServer Network (LACP Bond, VLAN and Bonding) Configuration – Part 3
In the third part of this series, the configuration of networking in XenServer will be discussed. Networking in XenServer is often a little difficult to grasp at first but is actually quite simple. The first task before configuration is to step back and understand all of the new terminology used by XenServer in reference to networking.
XenServer Network Configuration – Part 3
Read Also:
Installing and Configuring XenServer – Part 1
Installing XenServer Important Patches – Part 2
XenServer, as a virtualization platform, introduces virtual interfaces for the guests that have to be mapped to physical interfaces or networks on the actual physical network that the XenServer itself is connected. This mapping is what often leads to confusion. So let’s take a look at these new terms and how they allow guests to interact with the actual physical network that is connected to the XenServer.
XenServer introduces three new terms when it comes to networking. The first of which is generally the easiest to understand as it is simply a variant of the traditional Network Interface Card (NIC). In XenServer, the actual physical NICs of a system are often referenced as Physical Interfaces or its acronym of ‘PIF‘.
The second term that XenServer will use is what is known as a Virtual Interface or more commonly its acronym of ‘VIF‘. These Virtual Interfaces represent the Network Interface Cards that will be attached to the guests (virtual machines) running on the XenServer.
The third term that is often used when talking about XenServer networking is the Xen Bridge whose acronym will vary but typically will be represented as ‘xenbr0‘. These bridges are created at the time of the XenServer install and one is created per each PIF (Physical Interface) that is found during the installation. These bridges are used to allow VIF (Virtual Interfaces) to communicate through PIF (Physical Interfaces).
Now that the terminology is out of the way, there are some special caveats when working with virtual interfaces. Since the virtual interfaces will be used to connect guests to networks, it is important to understand what is needed from these interfaces. One caveat that will cause individuals lots of grief is when a guest needs connectivity to two real networks from a XenServer.
In order to accomplish this task the virtual machine (guest) will need to have 2 VIFs (virtual interfaces) connected to it so that each can be on the appropriate network. This will require some manipulation of the guest’s routing table as well to ensure that guests communicate out the proper interfaces.
Another caveat with virtual interfaces is that each one needs its own Media Access Control address or MAC address. XenServer can automatically assign a randomly generated MAC address or an administrator can manually assign them as well.
The last couple of paragraphs have greatly condensed a lot of the networking concepts within XenServer. Sometimes reading isn’t nearly as easy to comprehend as seeing drawings or actually configuring.
Below is a diagram that attempts to cover the concepts introduced before the actual configuration of XenServer networking.
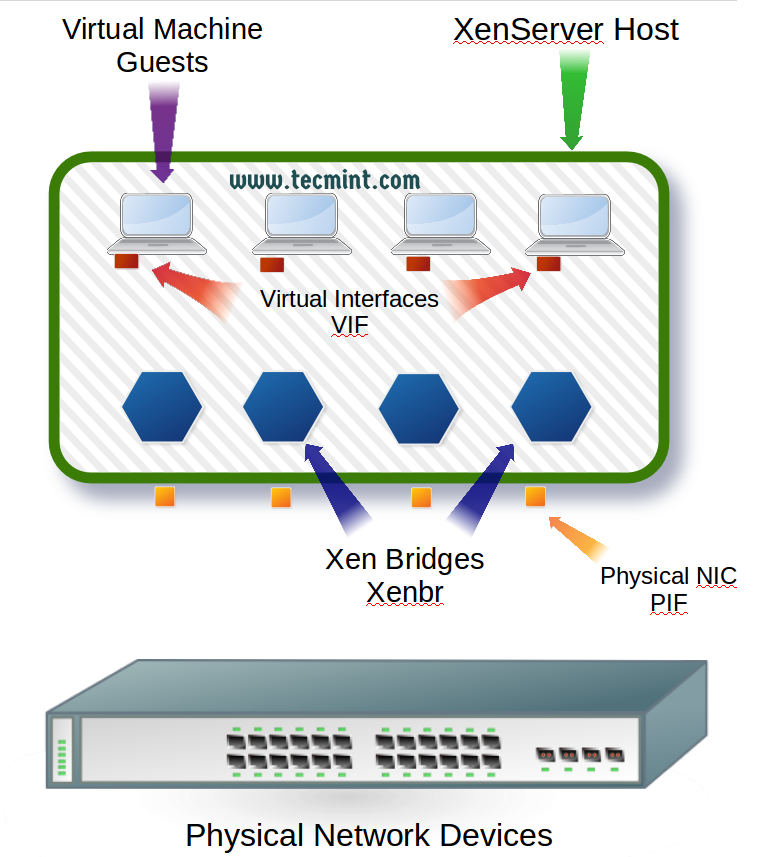
Figure 1 introduces the major terms involved in XenServer networking. Now that the terminology is out of the way, it is time to begin configuring the physical interfaces to allow the XenServer host and guests connectivity.
XenServer typically requires an interface for management traffic and an interface for guest traffic, however, this guide will be showing how to setup bonds for redundancy as well as link aggregation.
As a result this guide will assume the following about the physical wiring of the XenServer host:
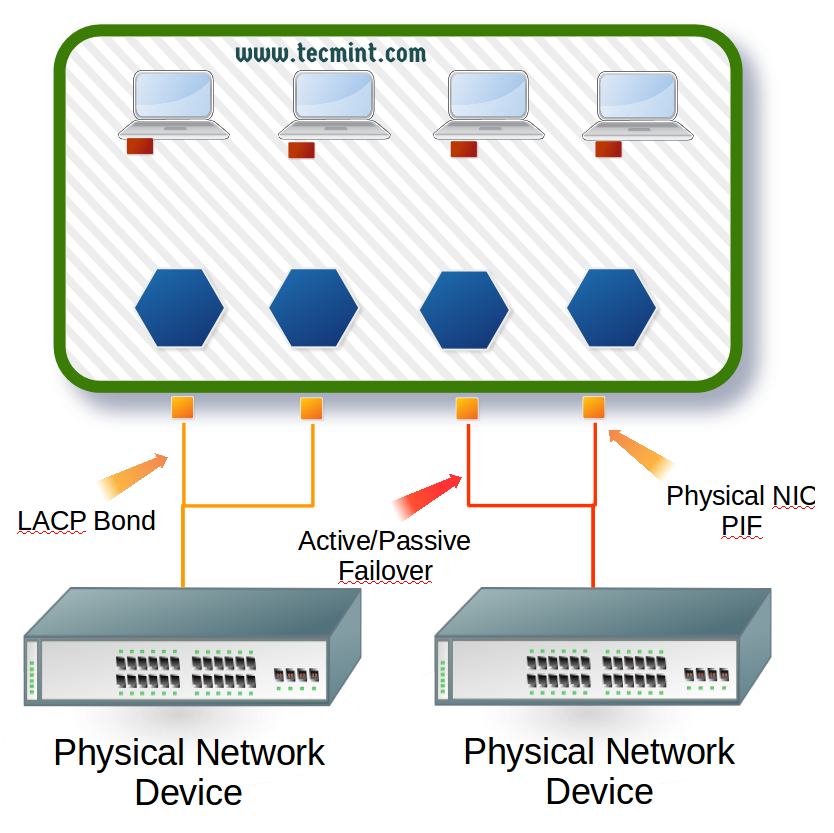
- The server has four total PIFs (Physical Interfaces).
- The first two PIF interfaces are wired to a switch and will be aggregated via LACP (guide will cover this on the XenServer side but LACP requires the switch side be configured as well).
- The remaining two PIF interfaces are wired to a switch and are on the same network and will be used for management traffic as well as storage traffic.
- Remaining PIF interfaces will be setup in an active/failover setup.
Figure 2 to below details out the wiring for this particular XenServer. Realize that there are many ways to setup XenServer networking. The configuration is dependent upon the organization and the role of the XenServer. The solution here was chosen as it allows for some common configurations on a XenServer to be discussed.
Now that all of the conceptualization is complete, let’s begin the actual configuration process.
This guide assumes that all configuration will be done using the XenServer CLI. Normally the management interface is configured during XenServer installation but this guide will assume that nothing is configured other than XenServer being installed.
The first task is to obtain the information about the physical interfaces on this particular XenServer. This is accomplished with a utility known as ‘xe‘.
# xe pif-list
This will return most of the crucial information needed to configure these network interfaces. The most important parts from this output include the traditional Linux name for the interfaces (eth0, eth1, etc) and the UUID of each of those interfaces.
The configurations done will require the UUID of the interface rather than the name so it is important to understand how the two are mapped logically in XenServer.
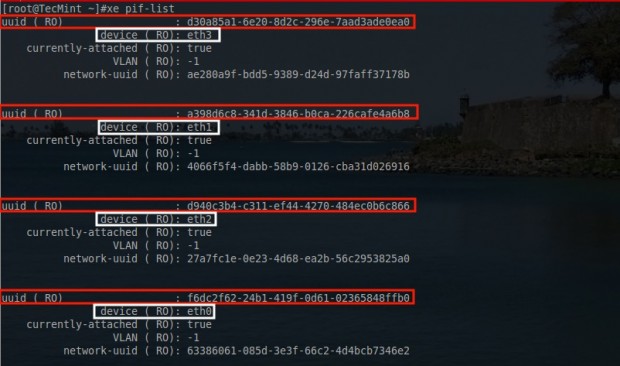
XenServer Physical Network Interfaces List
A special note of caution, it isn’t out of the realm of possibilities for XenServer to initialize PIF interfaces in an odd order or an order that makes pool network settings break.
In the event that XenServer initializes a PIF with an incorrect ‘eth‘ identifier, there is a utility that will allow for renaming of the interfaces built into XenServer. The utility is ‘interface-rename‘ and it has seen its fair amount of use by the author.
Now that a list of PIFs is available, the configuration of the appropriate networks to the appropriate interfaces can take place. For this server the PIF configuration will be as follows:
- eth0 and eth1: Configured into an LACP bond connected to a trunk. These interfaces will be used later for guest traffic.
- eth2 and eth3: Configured into an Active/Passive fail-over for Management and iSCSI traffic. These interfaces are connected to access ports on the switch.
Step 2: Creating a LACP Network Bond
Let’s begin by making the LACP bond connection first. In order to do this, the switch MUST be configured for LACP! This will not work if the switch isn’t setup for LACP as well. Again the ‘xe‘ command will be used to configure these PIFs. The first step is to create the bonded network.
# xe network-create name-label=”Tecmint-LACP-Bond”
This command will create a new XenServer network called Tecmint-LACP-Bond. Once this command is issued, a UUID for this network will be displayed in the terminal. Keep this UUID as it will be needed when adding the PIFs to the bond.

Create XenServer Network LACP Bond
In the event that the UUID wasn’t written down or is forgotten, it can always be recovered using the following xecommand.
# xe network-list name-label="Tecmint-LACP-Bond"
This will return the network’s information and specifically the UUID necessary for adding PIFs to the network.
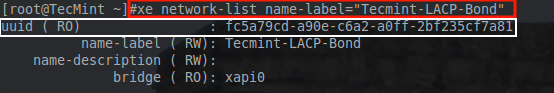
Check XenServer Network UUID
Now the proper PIFs need to be added to the network. The physical wiring for this server connects eth0 and eth1 to a switch that is configured with LACP.
# xe bond-create mode=lacp network-uuid=fc5a79cd-a90e-c6a2-a0ff-2bf235cf7a81 pif-uuids=f6dc2f62-24b1-419f-0d61-02365848ffb0,a398d6c8-341d-3846-b0ca-226cafe4a6b8
This is a busy command; let’s take a look at what is happening. “xe bond-create mode=lacp” indicates to the XenServer that a bond is being created and the mode will be LACP.
The “network-uuid=” indicates the UUID of the network that was created on the XenServer earlier.
The “pif-uuids=” is a comma separated list of the UUIDs for each of the PIFs that are to be apart of the LACP bond. If this command is successful, it will reply with the UUID of the newly created network bond.

XenServer Network Bond UUID
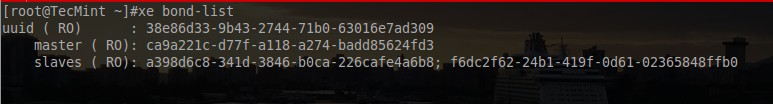
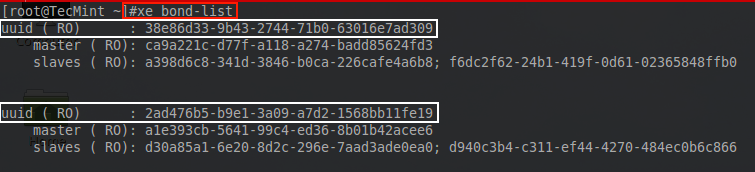
As with all system administration tasks, it is always a good idea to confirm that changes are recognized by the system.
# xe bond-list
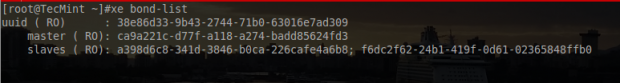
List XenServer Bond Nework Information
From this output it is clear that the XenServer indeed has created the bond and attached the two PIFs that were indicated on the command line.
Step 3: Creating a XenServer Network VLAN
At this point the LACP bond is ready to be used. Since this particular LACP bond is a trunk, it will be important to create tagged external networks so that traffic will have the proper VLAN tag.
Let’s visit this process now. The first step is to create a new network for this particular VLAN. This is the same as what was done to create the bond in the first place.
# xe network-create name-label=VLAN10 name-description="Tecmint test VLAN 10"
As with all of the other xe commands, this one when successful, will output the UUID of the newly created network. Keep this handy as it will be needed soon.

Create XenServer VLAN Network
The next step is to determine the UUID of the PIF that this VLAN network will use. In this example, the LACPbond from the previous steps will be used to support VLANs. Using xe, the UUID of the bond interface can be determined.
# xe pif-list network-name-label="Tecmint-LACP-Bond"
This will return the UUID of the bond0 interface. This UUID will be necessary for the VLAN network so that the tagged traffic knows what interface to exit the XenServer.
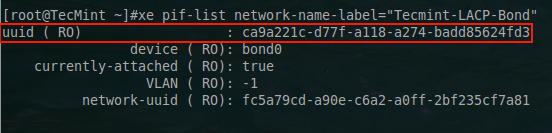
List XenServer VLAN Network UUID
From this point all the necessary information is available to build the xe command to create a VLAN tagged network.
# xe vlan-create network-uuid=cfe987f0-b37c-dbd7-39be-36e7bfd94cef pif-uuid=ca9a221c-d77f-a118-a274-badd85624fd3 vlan=10

Create XenServer VLAN Tagged Network
The UUID returned here indicates the host that this new VLAN network was created on and isn’t actually needed for any further steps. As with all steps, it is always a good idea to confirm that the changes were applied.
To confirm the new VLAN network:
# xe vlan-list tag=10
This will return the information for the VLAN 10 network just created as well as the associated PIFs.
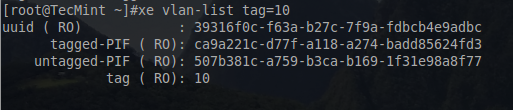
Check XenServer VLAN Network Information
This XenServer now has a LACP bonded network as well as one network that is ready to tag traffic for a VLAN 10. This VLAN 10 network can be added to a VIF (virtual interface) on a guest to allow guest traffic to be tagged by the virtual switch and sent across the trunk setup between the switch and the XenServer.
Step 4: XenServer Active/Passive Network Bonding
Now let’s take a look at storage and management traffic. This server currently only has two PIFs left for use and as such there are two options for how to proceed.
Each of the remaining PIFs could be used for one type of traffic or the two PIFs could be bonded together in an active/passive fail-over with both management and storage traffic going across the same set of PIFs (please note that according to Citrix, the management interface doesn’t support load balancing).
This process will be completed in a similar fashion to the LACP bond previously. The first step is to create the network for this bond.
# xe network-create name-label="Management/Storage Bond"
# xe network-list name-label="Management/Storage Bond"

Create XenServer Active/Passive Bonding
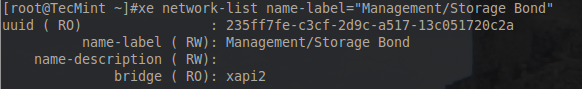
Confirm XenServer Active/Passive Bonding
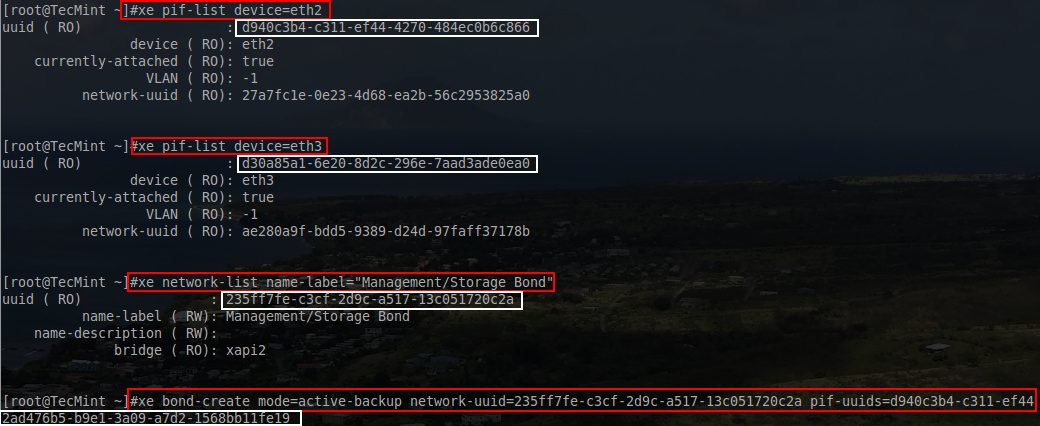
Again don’t forget to keep track of the UUID as it will be needed to attach PIFs to the bond network that is about to be created. The next step is to actually create the bond and in order to do this, the UUID for the other two PIFs will need to be determined.
# xe pif-list device=eth2
# xe pif-list device=eth3
# xe bond-create mode=active-backup network-uuid=<network_UUID> pif-uuids=<PIF_UUIDs>
Be sure to substitute the proper information from the prior commands for the UUIDs in the last command. At this point the system will return the UUID of the bond that was created.
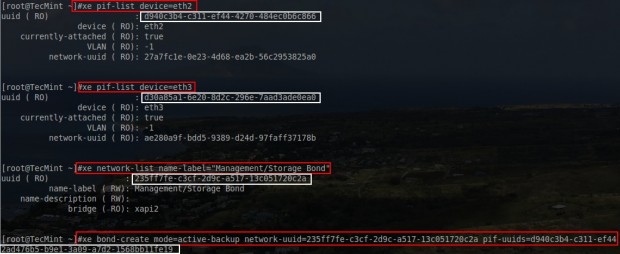
Create XenServer Network Bond
Then the creation of the bond can be confirmed with another xe command.
# xe bond-list

Confirm XenServer Network Bond UUID’s
From the output here, the UUIDs of the bonds can be compared. Notice that the second UUID matches the UUID returned from the bond-create command in the above photo.
At this point the 4 PIF interfaces on this XenServer are members of bonds. One of the bonds is a trunk and has one VLAN tag network ready to be sent across this trunk bond. The other bond is an active/passive bond that is used for network storage as well as management of the XenServer itself.
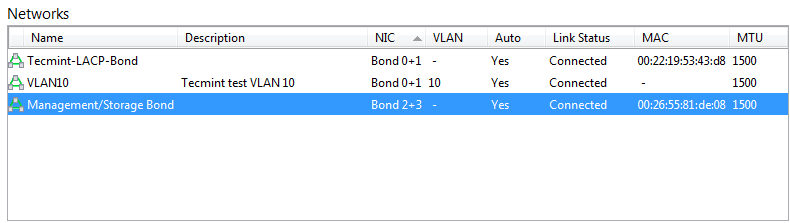
For illustrative purposes, once these networks have been created, they can also be verified within Citrix’s XenCenter application rather than the command line. This guide has used the CLI for these tasks as XenCenter is not installable on Linux.
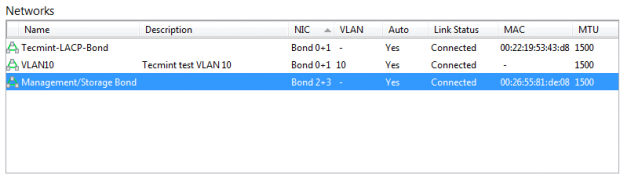
Verify XenServer Network Configuration
This concludes this brief introduction to networking in XenServer. The next article in this series will begin working with XenServer storage solutions.
In the fourth article of this XenServer series, storage solutions will be discussed. Much like networking, storage solutions in XenServer are often difficult to grasp at first. Before beginning any configuration, the new terminology and concepts involved in XenServer storage should be discussed.
Add Xenserver Storage Repository – Part 4
XenServer introduces several new terms to the traditional storage terminology list. While understanding the concepts are always important when working with any IT system, storage isn’t nearly as crucial as the prior article covering networking concepts. However, this article will still take the time to explain and attempt to clarify these storage concepts.
The first thing to remember with XenServer storage is that we have storage for the actual XenServer host and then we also have storage for the guest or virtual machines that will run on the XenServer host. Conceptually this is simple to grasp but managing it can be a daunting task if the administrator is unfamiliar with the purposes of each of the storage aspects.
The first term is known as ‘SR’ or Storage Repository. This is arguably the most important term in XenServer storage as it represents the physical medium to which virtual machine disks will be stored and retrieved. Storage repositories can be any of several different types of storage systems including, local storage attached physically to the XenServer host, iSCSI/Fibre Channel LUN, NFS Network File Shares, or storage on a Dell/NetApp storage appliance.
Storage repositories can be shared or dedicated and can support numerous useful features such as fast cloning, sparse allocation (storage provisioned as the virtual machine needs it), and re-sizable virtual disk images (more on these later).
Storage repositories, SR, are logically connected to a XenServer host with what is known as a Physical Block Device, more commonly referenced as ‘PBD’. The PBD is simply a reference to a storage location. These PBD objects can be “plugged” into a XenServer host to allow that host to read/write information to that storage repository.
The purpose of Storage repositories is primarily to store the virtual machine Virtual Disk Image (VDI) files. VDI files are spots on a SR that have been allocated to hold operating system and other files for virtual machine running on the XenServer host. VDI files can be any of several different types. The type is determine by the type of storage repository.
Common VDI types in XenServer are Logical Volumes (LV) managed by Logical Volume Manager, Virtual Hard Disk (VHD), or they can be Logical Unit Numbers (LUN) on a Dell or NetApp storage device. Note: This article will be using LUNs on a Dell storage device.
These VDI files are connected to virtual machines logically through an object known as a Virtual Block Device, commonly referenced as ‘VBD’. These VBD objects can be attached to virtual guests which then allows the guest machine to access the data stored in that particular VDI on a respective SR.
Much like networking in XenServer, reading about storage is one thing but being able to see the relationship amongst each of these items often solidifies the concepts. The common diagrams used to represent XenServer storage concepts often confuses newer people as the diagrams are often read in a linear fashion. Below is one such image borrowed from Citrix.
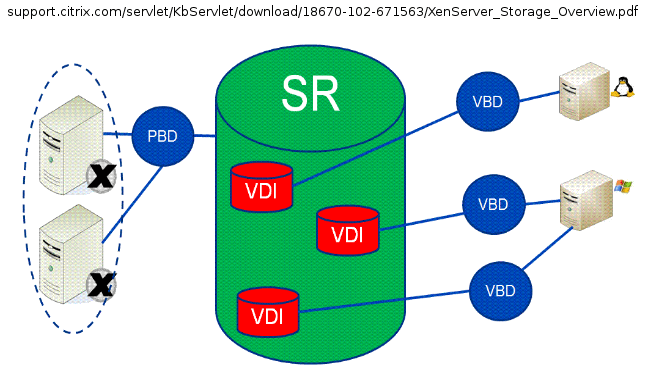
Citrix XenServer Storage Concepts
Many individuals read this linearly from left to right thinking that each part is a separate physical device. This isn’t the case and often leads to much confusion about how XenServer storage works. The graphic below attempts to explain the concepts in a less linear but more pragmatic manner.
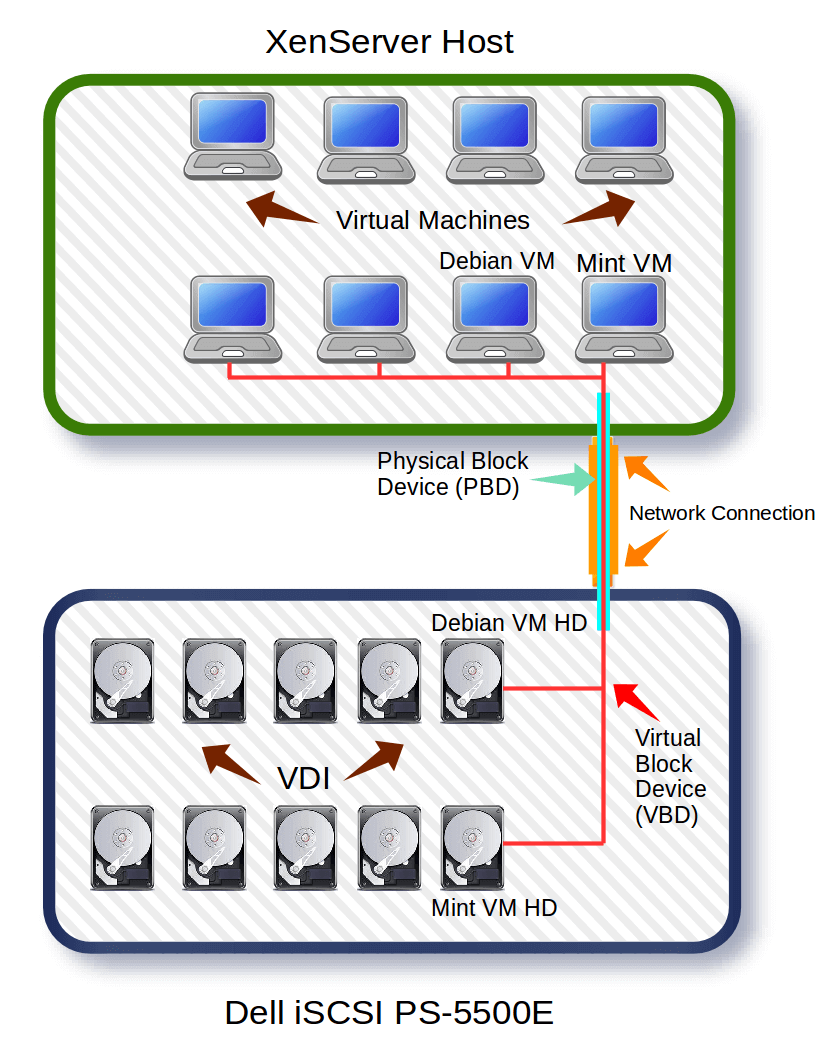
XenServer Storage Works
Hopefully the above graphic doesn’t further confuse individuals about XenServer storage. The second image is an attempt to show the logical connections (PBD and VBD) that are used to connect XenServers and guests to remote storage over one actual network connection.
With the conceptualization out of the way; the configuration can begin. Recalling from the first article in this series, this guide is using a Dell PS5500E iSCSI storage device for the storage of the virtual machine (guests) disks. This guide will not be walking through configuration of the Dell iSCSI device.
System Configuration:
- XenServer 6.5 installed and patched (Part 1 of series)
- Dell PS5500E iSCSI device (other iSCSI devices can be used just substitute environment information where needed).
- XenServer network interfaces configured (Part 3 of series).
- iSCSI device and XenServer can logically see each other (via ping utility).
- CIFS (SAMBA) Server running and hosting a share of CD ISO files (not required but very useful).
Citrix XenServer Storage Repository Creation
This first process will go through the steps to create a software iSCSI initiator from the XenServer host to the Dell PS5500E.
This particular LUN uses Challenge-Handshake Authentication Protocol (CHAP) to restrict access to the iSCSI volume to certain authorized parties.
To create the storage repository, a traditional ‘xe’ command will occur. The proper iSCSI information needs to be obtained before creating the Storage Repository.
Passing the ‘sr-probe’ parameter to the ‘xe’ utility will instruct the XenServer to query a storage device for the iSCSI IQN (iSCSI Qualified Name).
The first command will look intense at first but it’s not as bad as it looks.
# xe sr-probe type=lvmoiscsi device-config:target=X.X.X.X device-config:chapuser="tecmint" device-config:chappassword="tecmint_chap"
This first command is needed to gather the SCSI IQN for the Storage repository configuration. Before moving on, let’s take a look at all the parts of this command.
- sr-probe – Used to query the iSCSI device for information about the volume created for this XenServer host.
- type= Used to tell the XenServer the storage repository type. This will vary depending on what system is being used. Due to the usage of the Dell PS5500, lvm over iSCSI is used in this command. Be sure to modify to fit the storage device type.
- device-config:target= Used to tell the XenServer what iSCSI device to query by IP address.
- device-config:chapuser= This is used to authenticate to the iSCSI device. In this example an iSCSI volume has been created previously for the user “tecmint”. By sending the user-name and password in this command, the iSCSI device will respond back with the necessary information to finish creating the storage repository.
- device-config:chappassword= This is the password for the above CHAP user-name.
Once the command is entered and submitted, the XenServer will attempt to log into the iSCSI device and will return some information needed in order to actually add this iSCSI device as a Storage Repository.
Below is what the test system returned from this command.
Error code: SR_BACKEND_FAILURE_96
Error parameters: , The SCSIid parameter is missing or incorrect , <?xml version"1.0" ?>
<iscsi-target-iqns>
        <TGT>
                 <Index>
                              0
                 </Index>
                 <IPAddress>
                 </IPAddress>
                 <TargetIQN>
                              iqn.2001-05.com.equallogic:0-8a096-0d9a4ab02-46600020343560ef-xenct-xen2
                 </TargetIQN>
        </TGT>
        <TGT>
                 <Index>

                 </Index>
                 <IPAddress>

                 </IPAddress>
                 <TargetIQN>

                 </TargetIQN>
        </TGT>
</iscsi-target-iqns>
The highlighted piece here is known as the iSCSI IQN. This is very important and is needed to determine the SCSIid for the storage repository. With this new information, the prior command can be modified to obtain the SCSIid.
# xe sr-probe type=lvmoiscsi device-config:target=X.X.X.X device-config:targetIQN=iqn.2001-05.com.equallogic:0-8a0906-0d9a4ab02-46600020343560ef-xenct-xen2 device-config:chapuser="tecmint" device-config:chappassword="tecmint_chap"
The only thing added to the command is the targetIQN stanza. By issuing this new command, the system will respond with the last piece of information needed to create an iSCSI Storage Repository. That last piece of information is the SCSI id.
Error code: SR_BACKEND_FAILURE_107
Error parameters: , The SCSIid parameter is missing or incorrect , <?xml version"1.0" ?>
<iscsi-target>
        <LUN>
                 <vendor>
                        EQLOGIC
                 </vendor>
                 <serial>
                 </serial>
                 <LUNid>
                         0
                 </LUNid>
                 <size>
                         107379425280
                 </size>
                 <SCSIid>
                         36090a028b04a9a0def60353420006046
                 </SCSIid>
        </LUN>
</iscsi-target>
From this point, all the necessary pieces to create an iSCSI Storage Repository are available and it is time to issue the command to add this SR to this particular XenServer. Creating the Storage Repository from the combined information is done as follows:
# xe sr-create name-label="Tecmint iSCSI Storage" type=lvmoiscsi content-type=user device-config:target=X.X.X.X device-config:port=3260 device-config:targetIQN=iqn.2001-05.com.equallogic:0-8a0906-0d9a4ab02-46600020343560ef-xenct-xen2 device-config:chapuser="tecmint" device-config:chappassword="tecmint_chap" device-config:SCSIid=36090a028b04a9a0def60353420006046
If all goes well the system will connect to the iSCSI device and then return the UUID of the newly added Storage Repository.
bea6caa4-ecab-8509-33a4-2cda2599fb75
The UUID output is a great sign! As with all system administration tasks, it is always a good idea to confirm that the command was successful. This can be accomplished with another ‘xe’ command.
# xe sr-list name-label="Tecmint iSCSI Storage"
Sample Output
uuid ( RO)                 : bea6caa4-ecab-8509-33a4-2cda2599fb75
          name-label ( RW) : Tecmint iSCSI Storage
    name-description ( RW) :
                host ( RO) : xenct-xen2
                type ( RO) : lvmoiscsi
        content-type ( RO) : user
From the CLI output this XenServer has successfully connected to the Dell iSCSI device and is ready to store guest VDI files.
ISO Storage Repository Creation
The next series of steps walks through the process of creating an ISO library. ISO files are typically images of compact disk (CD) installation media.
By having a special storage repository created for these ISO files, the installation of new guests can be done very quickly. When an administrator wishes to create a new guest, they can simply select one of the ISO files that exist in this ISO library rather than having to put a CD physically in a XenServer in the pool.
This part of the guide will assume that the user has a working SAMBA server. If a SAMBA server isn’t setup please feel free to read this article about how to complete this task in Red Hat/Fedora (I will have a Debian SAMBA server guide in the future):
- Setup Samba Server for File Sharing
The first step is to gather the necessary credentials and configuration information for the SAMBA ISO library. Once the username, password, and connectivity information are available a simple ‘xe’ command variant can be used to connect the SAMBA library to the XenServer.
# xe-mount-iso-sr //<servername>/ISO -o username=<user>,password=<password>
This command won’t output anything to the screen unless it fails. To confirm that it did indeed mount the SAMBA ISO share, issue another ‘xe’ command:
# xe sr-list
Sample Output
uuid ( RO)                 : 1fd75a51-10ee-41b9-9614-263edb3f40d6
          name-label ( RW) : Remote ISO Library on: //                  /ISO
    name-description ( RW) :
                host ( RO) : xenct-xen2
                type ( RO) : iso
        content-type ( RO) : iso
This XenServer host is now configured with both an iSCSI Storage Repository as well as a CIFS ISO library to store installation media for virtual machines (guests).
The next steps will be the creation of virtual machines and connecting those systems to the proper networks from the earlier networking article.
How to Create and Install Guest Virtual Machines in XenServer – Part 5
Continuing to move forward with the XenServer series, this article will approach the creation of the actual guests themselves (often called virtual machines).
Create and Install Guest Virtual Machines in XenServer
This article will assume all the previous articles covering networking, patching, and storage have been completed. Thankfully, no more new terminology really needs to be discussed and the creation of the guests can begin!
System Review
At this point, a lot has been configured on this XenServer host. This will serve as a quick review about what has been configured and which article the topic was discussed.
- XenServer 6.5 was installed to the server
- https://www.tecmint.com/citrix-xenserver-installation-and-network-configuration-in-linux/
- All XenServer 6.5 patches have been applied
- https://www.tecmint.com/install-xenserver-patches-in-linux/
- Network interface teaming and VLANs were created
- https://www.tecmint.com/xenserver-network-lacp-bond-vlan-and-bonding-configuration/
- iSCSI and ISO storage repositories were created to hold operating system installation files and the virtual harddisks used by the guests
- https://www.tecmint.com/xenserver-create-and-add-storage-repository/
Creation of Virtual Guests in XenServer
This portion of the guide will be relying on ISO installers to actually boot the newly created guest machine and install an operating system. Be sure to review the fourth article for information on creating an ISO repository.
XenServer comes with a series of templates that can be used to quickly provision a virtual guest. These templates provide common options for the chosen operating system. Options include things such as hard drive space, CPU architecture, and amount of ram available among other options.
These options can be manually modified later but for now a simple template will be used to illustrate their usage. To obtain the list of available templates, the traditional 'xe' command can be passed different arguments to prompt the system to return the templates available.
# xe template-list
This command is likely to return a lot of output. To make the output easier to read, it is suggested that the output be piped into ‘less’ as follows:
# xe template-list | less
This will allow for easier parsing of the available templates to locate the necessary UUID information. This article is going to be working with Debian 8 Jessie but will require the use of the older Debian 7 Wheezytemplate until Citrix releases the new template.
Selecting Debian 7 won’t affect anything in the operation of the actual operating system. (The screen shot below used the UUID in the command to trim out some of the normal output).
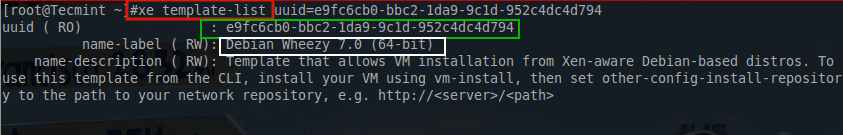
Check XenServer Template List
# xe sr-list name-label=”Tecmint iSCSI Storage”
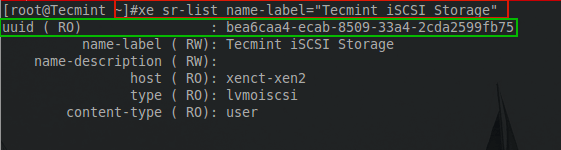
List XenServer Storage Label Name
With this UUID, all of the initial information to setup this guest has been obtained. As with almost everything in XenServer, another ‘xe’ command will be used to provision the new guest.
# xe vm-install template=”Debian Wheezy 7.0 (64-bit)” new-name-label="TecmintVM" sr-uuid=bea6caa4-ecab-8509-33a4-2cda2599fb75

XenServer Guest Template Creation
The highlighted UUID is the UUID of the newly provisioned guest. There are a couple of house keeping steps that can potentially make things easier in the future. The first is to provide a name-label to the newly created VDI and the second is modifying any of the default hardware specifications provisioned by the template.
To see why it would be important to name the VDI, take a look at what the system will automatically assign to the VDI when provisioned using the following ‘xe’ commands:
# xe vbd-list vm-name-label=TecmintVM – Used to get the VDI UUID
# xe vdi-list vbd-uuids=2eac0d98-485a-7c22-216c-caa920b10ea9    [Used to show naming issue]
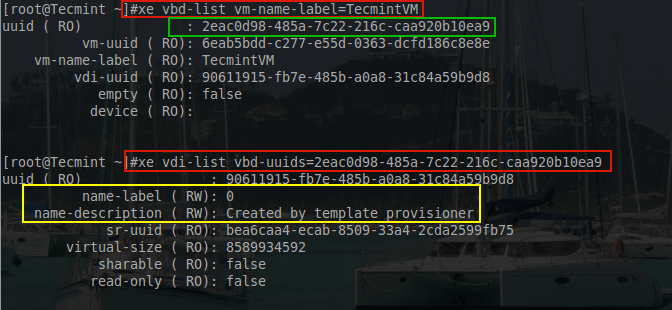
Check XenServer VDI Name and UUID
Another option available is to gather both pieces of information is the following command:
# xe vm-disk-list vm=TecmintVM
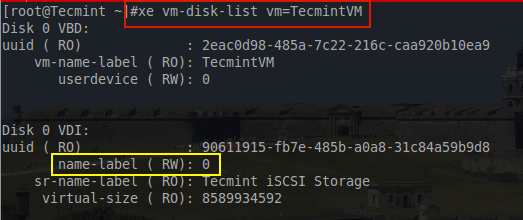
List Virtual Machine Disk Information
The part in yellow is the concern. To many people this issue is minor but for house keeping purposes a more descriptive name is desired to keep track of the purpose of this particular VDI. To rename this particular VDI, the UUID in the above output is needed and another ‘xe’ command needs to be created.
# xe vdi-param-set uuid=90611915-fb7e-485b-a0a8-31c84a59b9d8 name-label="TecmintVM Disk 0 VDI"
# xe vm-disk-list vm=TecmintVM
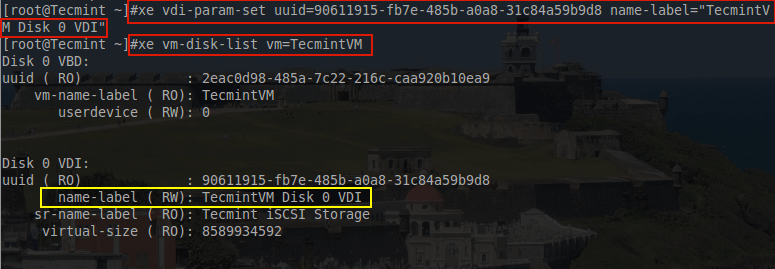
Rename VDI Name Label
This may seem trivial to set but from experience, this has prevented a serious issue when detaching a storage repository from one XenServer and attempting to attach it to another XenServer. This particular scenario, a metadata backup of all the guest information failed to be restore-able on the new XenServer and thankfully by naming the VDI on each of the guests, proper mapping of the guest to its VDI was able to be done simply by the name-label.
The next house keeping step for this article is to provide this particular guest with more resources. As provisioned this guest will only have about 256 MiB (Mebibytes) worth of memory. Most guests this isn’t enough so it is beneficial to know how to increase a guest’s available memory. As with anything in XenServer this can be accomplished with ‘xe’ commands.
# xe vm-param-list uuid=6eab5bdd-c277-e55d-0363-dcfd186c8e8e | grep -i memory
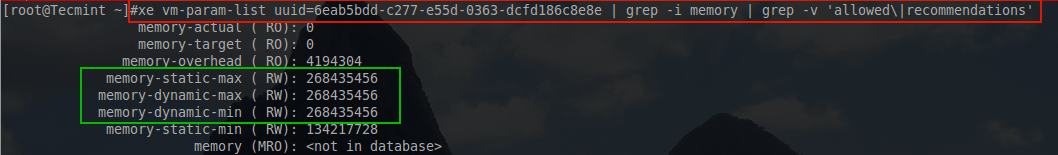
Check XenServer Guest Memory List
The box in green above indicates that the most memory that this particular guest could ever have is about 256 MiB. For testing purposes this would be okay but for any sort of heavy use system, this would prove to be insufficient.
To modify this value to give the guest access to more RAM, a simple ‘xe’ command can be issued with the guest powered off. In this example, the amount of ram to be given to this machine will be represented in bytes but will equal 2 Gibibytes worth of ram.
# xe vm-memory-limits-set dynamic-max=2147483648 dynamic-min=2147483648 static-max=2147483648 static-min=2147483648 name-label=TecmintVM
Notice that this will reserve two GiB of ram for this guest all the time.
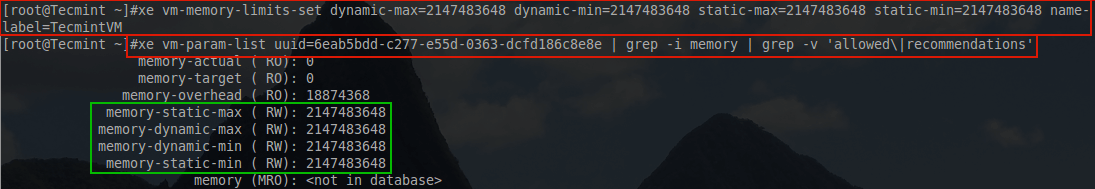
Increase XenServer Guest Memory Limit
Now this particular guest is ready to have an operating system installed. From the previous article about Storage Repositories, a Samba share was added to this XenServer to store ISO installer files. This can be confirmed with the following ‘xe’ command:
# xe sr-list name-label=Remote\ ISO\ Library\ on:\ //<servername>/ISO
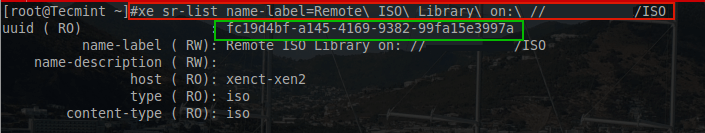
List XenServer Samba Share Directory
Be sure to replace <servername> with the name of the proper Samba server for the environment in which this configuration is taking place. Once the XenServer is confirmed to see the ISO storage repository, a virtual CD-ROM needs to be added to the guest in order to boot the ISO file. This guide will assume that the Debian Net Installer ISO exists on the ISO storage repository.
# xe cd-list | grep debian
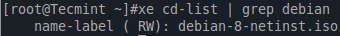
Check Guest ISO in XenServer ISO Storage
# xe vm-cd-add vm=TecmintVM cd-name=debian-8-netinst.iso device=3
# xe vbd-list vm-name-label=TecmintVM userdevice=3
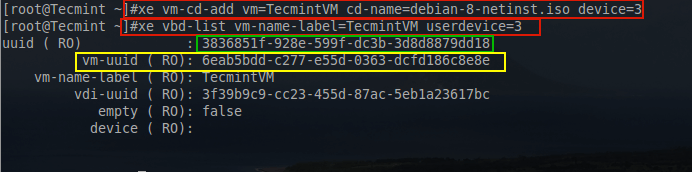
Add Guest ISO to XenServer
The above commands first list out the name for the Debian ISO. The next command will add a virtual CD-ROMdevice to the TecmintVM guest and assigns it the device ID of 3.
The third command is used to determine the UUID for the newly added CD-ROM to continue setting up the device to boot the Debian ISO.
The next step is to make the CD-ROM bootable as well as instruct the guest to install an operating system from the CD-ROM.
# xe vbd-param-set uuid=3836851f-928e-599f-dc3b-3d8d8879dd18 bootable=true
# xe vm-param-set uuid=6eab5bdd-c277-e55d-0363-dcfd186c8e8e other-config:install-repository=cdrom
The first command above sets the CD-ROM to be bootable by using its UUID highlighted in green in the above screen-shot. The second command instructs the guest to use the CD-ROM as the method for installing the operating system. The UUID for the Tecmint guest is highlight in the above screen-shot in yellow.

Install Guest Operating System in XenServer
The last step in setting up the guest is to attach a virtual network interface (VIF). This is especially important for this install method since the Debian Network installer is being used and will need to pull packages from the Debian repositories.
Looking back at the XenServer networking article, a special VLAN was already created for this guest and it was VLAN 10. Using ‘xe’ the necessary network interface can be created and assigned to this guest.
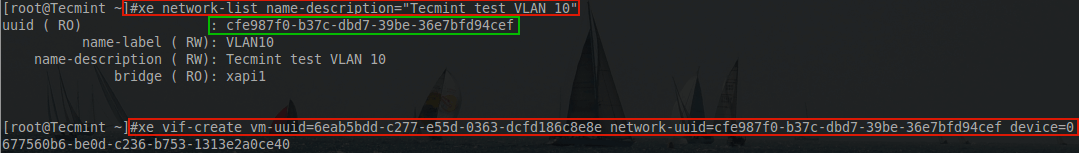
# xe network-list name-description="Tecmint test VLAN 10"
# xe vif-create vm-uuid=6eab5bdd-c277-e55d-0363-dcfd186c8e8e network-uuid=cfe987f0-b37c-dbd7-39be-36e7bfd94cef device=0
The first command is used to obtain the UUID of the network created for this guest. The next command is used to create a network adapter for the guest and attach the network adapter to the proper network.
Add Network Adapter to XenServer Guest OS
Congrats! At this point, the virtual machine is ready to boot and install! To start the guest, issue the following ‘xe’ command.
# xe vm-start name-label=TecmintVM
If the terminal doesn’t produce any errors, then the guest started successfully. Proper starting of the guest can be confirmed with the following ‘xe’ command:
# xe vm-list name-label=TecmintVM
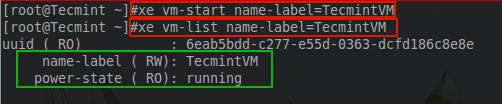
Check XenServer Guest OS Running Status
Now the big question. How to access the installer? This is a valid question. Citrix’s approved method is to use XenCenter. The issue here is that XenCenter doesn’t run on Linux! So a workaround exists so that users don’t have to create a special Windows station simply to access the console of a running guest.
This process involves creating an SSH tunnel from the Linux computer to the XenServer host and then port forwarding a VNC connection through that tunnel. It is very clever and works wonderfully but this method does assume that the user can access the XenServer over SSH.
The first step is to determine the guest’s domain number on the XenServer. This is done through the use of several different commands.
# xe vm-list params=dom-id name-label=TecmintVM
# xenstore-read /local/domain/1/console/vnc-port
The order of these commands is important! The first command will return a number that is needed for the second command.
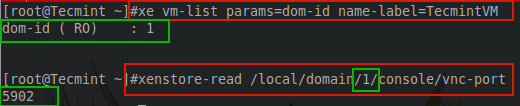
Find Out XenServer Domain Name Number
The output from both commands is important. The first output states the domain ID that the guest is running in; 1 in this case. The next command requires that number in order to determine the VNC port for the guest console session. The output from this command provides the VNC port that can be used to connect to the video out of this particular guest.
With the above information obtained, it is time to switch to a Linux station and connect to the XenServer to view the console session of this guest. To do this, an SSH tunnel will be created and port forwarding will be setup to direct a local VNC connection through the SSH tunnel. This connection will be done from a Linux Mint 17.2workstation but should be similar for other distributions.
The first step is to ensure that OpenSSH client and xtightnvcviewer are installed on the Linux host. In Linux Mint this can be accomplished with the following command:
$ sudo apt-get install openssh-client xtightvncviewer
This command will install the necessary utilities. The next step is to create an SSH tunnel to the XenServer host and setup port forwarding to the VNC port determine earlier on the XenServer host (5902).
# ssh -L <any_port>:localhost:<VM_Port_Above> root@<server> -N
# ssh -L 5902:localhost:5902 root@<servername> -N
The ‘-L’ option tells ssh to port forward. The first port can be any port above 1024 that isn’t in use on the Linux Mint machine. The ‘localhost:5902’ indicates that the traffic should be forwarded to the remote localhost port 5902 in this case that is the XenServer VNC port of the TecmintVM.
The ‘root@<server>’ is the login credentials to SSH into the XenServer host. Finally the ‘-N’ tells SSH to simply open a port forwarding connection. Using ‘lsof’ command the tunnel can be viewed in the output.
$ sudo lsof -i | grep 5902

Check Port Number Listening
Here the tunnel is setup and listening for connections. Now it is time to open a VNC connection to the guest on the XenServer. The utility installed is ‘xvncviewer’ and the ssh connection to forward traffic to the XenServer is listening on ‘localhost:5902’ so the appropriate command can be built.
$ xvncviewer localhost:5902
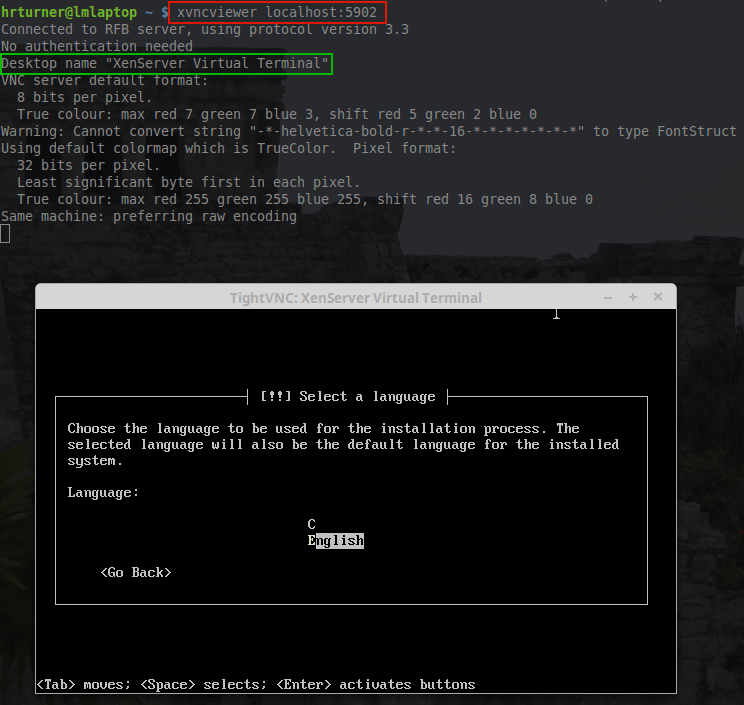
Connect XenServer Over VNC Connection
Voila! There is the TecmintVM console session running the Debian Network Installer waiting for the installation process to begin. At this point, the installation proceeds just like any other Debian installation.
Up to this point, everything with XenServer has been done via command line interface (CLI). While many Linux users enjoy the CLI, there are utilities that exist to simplify the process of managing XenServer hosts and pools. The next article in this series will cover the installation of those tools for users who wish to use graphical systems rather than CLI.
XenServer Physical to Virtual Migration – Part 6
Moving forward with a bit of a value add article and still tying into the previous article about guest creation in XenServer, this article will approach the concept of Physical to Virtual (P2V) migration within a XenServer environment.
The process of moving a physical server to a virtual server is sadly poorly documented in XenServer. In the past there have been tools that did the work for the administrator but as of XenServer 6.5 those tools appear to no longer be apart of the XenServer installer.
XenServer Physical to Virtual Migration – Part 6
This article will go through the process of taking a disk image with a utility known as Clonezilla, a fantastic open source project for disk/partition imaging. The image of this server will be stored to a Samba server on the network and then a new virtual guest will be created on the XenServer system.
This new guest will obviously not have an operating system and will be setup to PXE boot to Clonezilla so that the image can be pulled from the Samba server and placed on a newly created virtual hard disk (VDI).
System Requirements
- XenServer 6.5
- Clonezilla Live – Imaging software
- PXE boot server with Clonezilla PXE bootable – http://clonezilla.org/livepxe.php
- Samba Server – Enough storage to store the physical guest’s image
This article will focus on the actual migration of a physical server rather than all of the intricate details about how to setup a Samba and PXE boot system and as such it will be assumed that the user already has the ability to PXE boot Clonezilla from a local PXE server.
Imaging the Physical Server
1. The first part of this process is the act of actually imaging the physical server. This will be accomplished by PXE booting Clonezilla Live but can be done using Clonezilla live via a USB or CD-ROM. When Clonezilla finishes booting, the screen will wait to determine what the next step is to Select “Start_Clonezilla”...
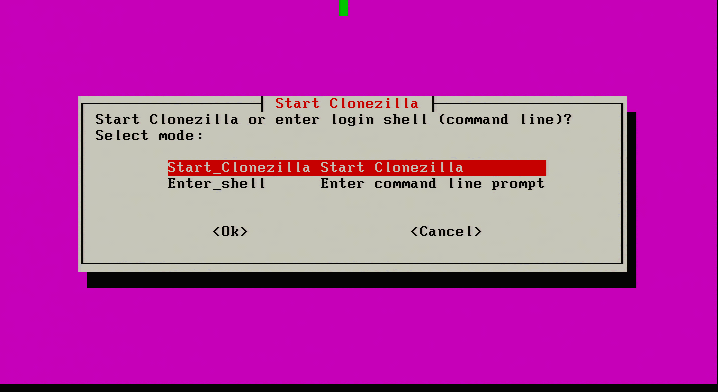
Start Clonezilla Installation
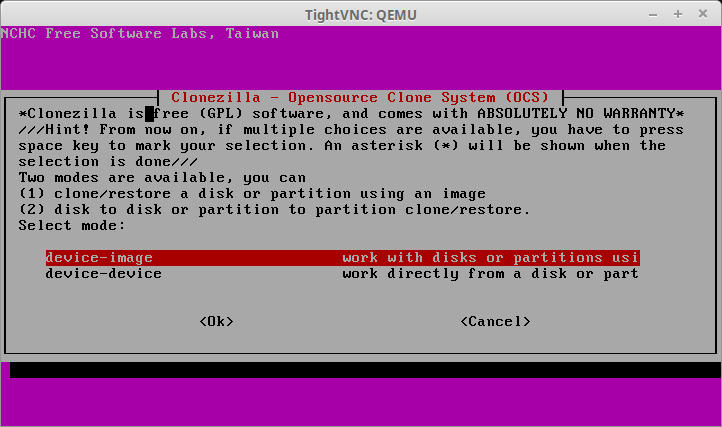
2. Selecting ‘Start_Clonezilla’ will prompt for all the necessary configurations rather than a shell environment. The next screen will ask for the imaging mode. For this physical to virtual migration the server’s entire disk is being moved to a virtual system and as such ‘device-image’ needs to be selected.
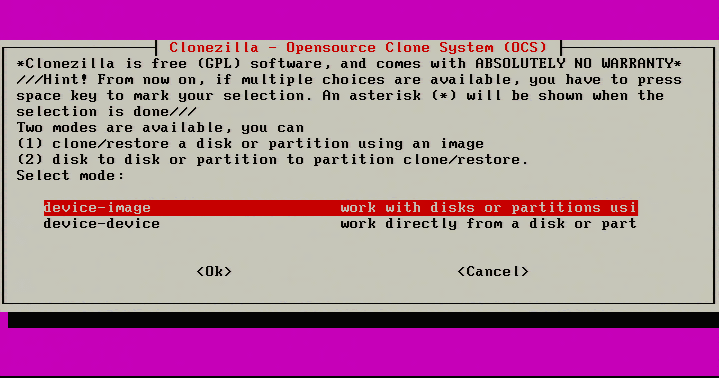
Select Device Image
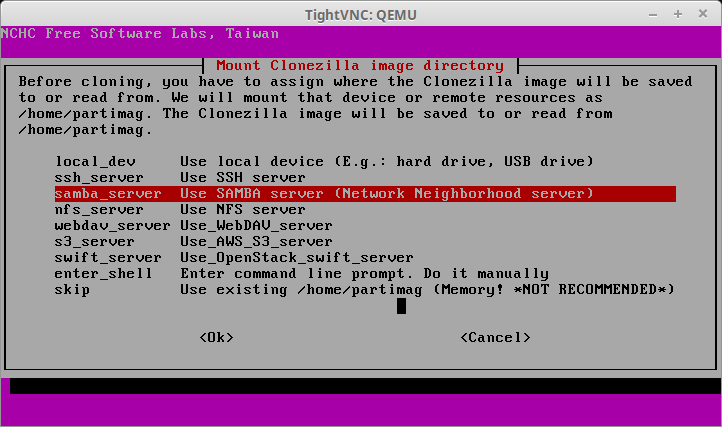
3. The next screen will ask where to save the image of the server. This article is going to be using a Samba share on another networked server.
Select Samba Share to Store Clonezilla Image
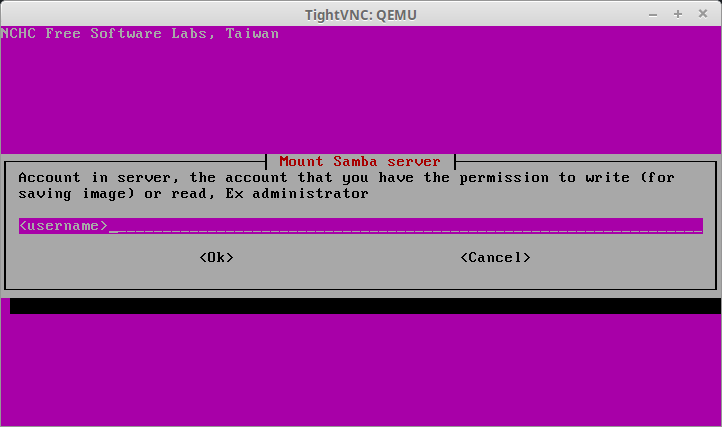
4. Continuing to the next screen, Clonezilla will now prompt for the credentials to access the Samba share. Be sure to enter the IP address of the server or if DNS is functioning properly, the fully qualified hostname of the the server can be used instead.
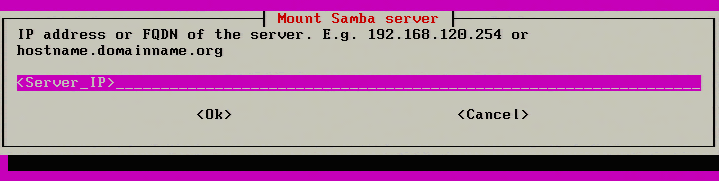
Mount Samba Server
5. The next screen asks for the Samba domain. If one exists enter it here but most systems don’t require it and hitting enter will go to the next screen.
Mount Samba Server
6. The next step is to enter a valid SAMBA user for the particular share. Make sure that this user can log into the share normally. Clonezilla isn’t always clear as to authentication errors and if the user is already a known valid user, it will make troubleshooting simpler.
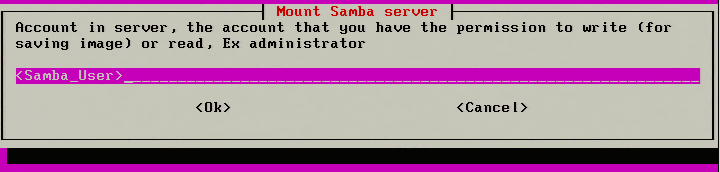
Enter Samba User
7. The next step is to specify the name of the SAMBA share. The default share name is “images” but environments vary. Be sure to place the appropriate share name in the following prompt.
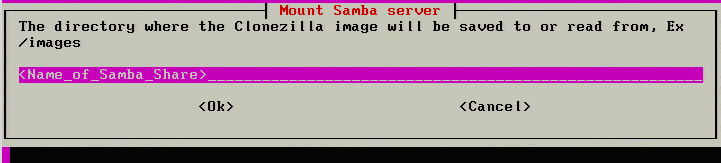
Enter Samba Share Directory
8. Clonezilla will now ask for the security mode to use. Select ‘auto’ unless there is specific reason to use ‘ntlm’in the environment.
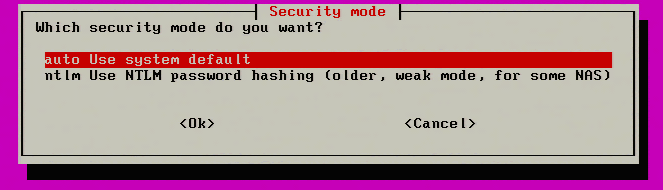
Select Clonezilla Security Mode
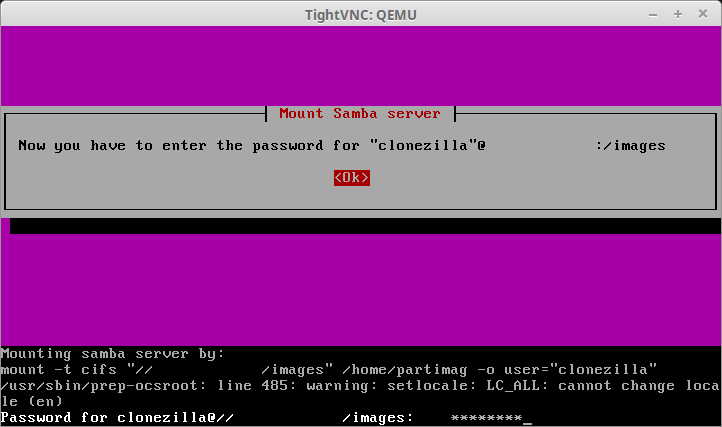
9. Finally, Clonezilla will prompt for the Samba user’s password to access the share. The command line will follow normal Linux password entry in regards to not displaying anything while the password is being typed but the password is still being entered.
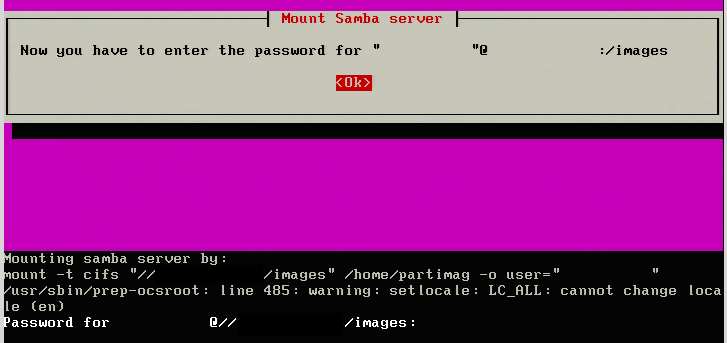
Enter Samba Password
10. After typing the password for the Samba share, hit enter. Clonezilla will attempt to contact the Samba server and mount the Samba share. If Clonezilla is unsuccessful, it will display an error, otherwise a successful connection will result in the following screen.
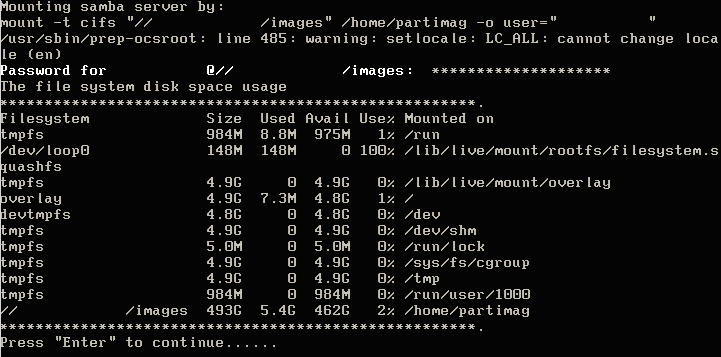
Mounting Samba Network Share
If this screen is presented, then Clonezilla has successfully mounted the SAMBA share and the imaging process/configuration can continue. It never hurts to confirm that the SAMBA server also ‘sees’ the connection as well. The following command can be issued on the Samba server to ensure that Clonezilla is indeed connected.
# lsof -i :445 | grep -i established

Check-Clonezilla Connection Status
11. The next process is to configure the imaging of this particular server. Clonezilla has two modes; Beginnerand Expert. This guide will simply use ‘Beginner’ as it will provide all the necessary options for the imaging process.
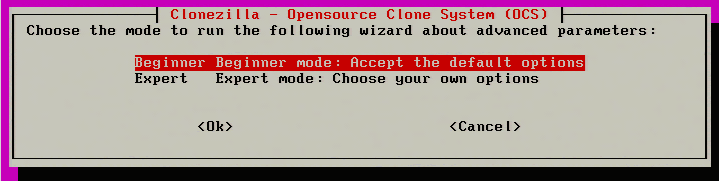
Select Clonezilla Mode
12. The next step asks what Clonezilla should take an image of on this particular system. Since the entire server needs to be virtualized, ‘savedisk’ will be selected to include all partitions on the system.
Note: Ensure that the Samba share has enough space to store the ENTIRE disk! Clonezilla will do some compression but it is better to ensure the space exists BEFORE cloning.
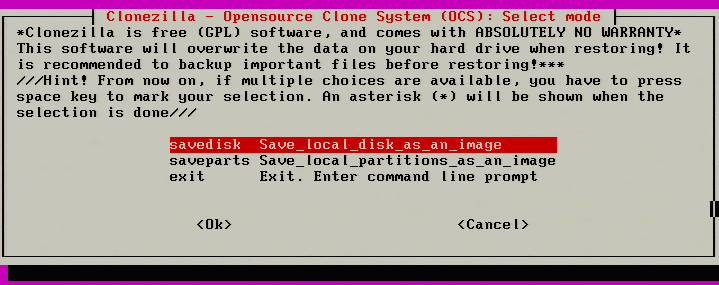
Select Entire Disk
13. Moving forward, the image will need to be given a name on the following menu prompt.
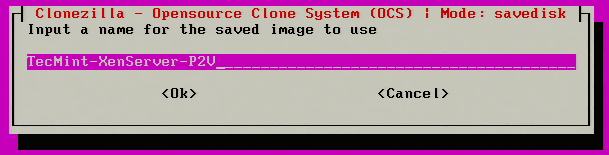
Give Name to Clonezilla Image
14. Once a name has been provided, Clonezilla will ask which disk (if multiple exist) should be imaged. In this example, Clonezilla will see the particular RAID controller of this server and report the size of the disk. In this case, the reported size is 146GB.
Note: Again, make sure that the Samba share has enough space for the imaging process! Clonezilla will do some compression but better safe than sorry.
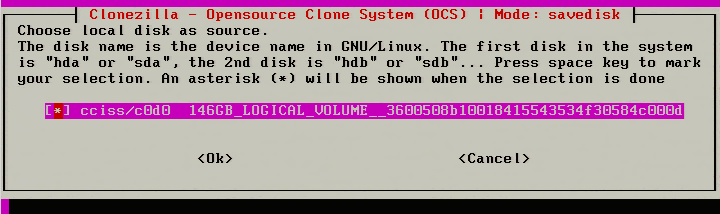
Select Disk to be Cloned
15. The next step is something relatively new to Clonezilla and it is the ability to repair filesystems while the imaging is taking place. The filesystems supported by this feature are the same ones normally supported by the Linux ‘fsck’ utility.
This check isn’t mandatory but could help prevent a bad image. Skip the check if this option is not desired.
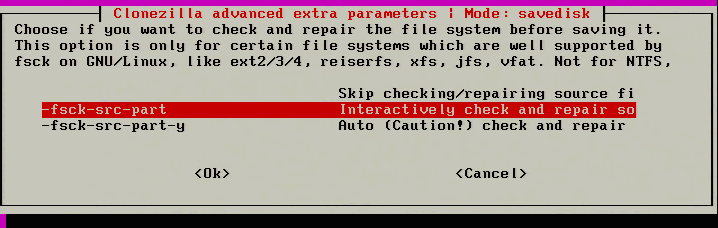
Check and Repair Filesystem
16. The next screen is used to check to ensure that the image is restorable after the image has been taken. It is suggested that this be done to help ensure a good image the first time through. This will add some time to the imaging process though if the system being imaged is large.
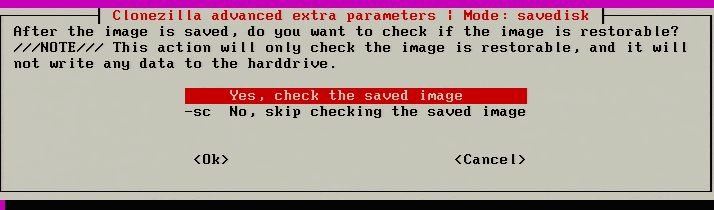
Check Image Restore Process
17. After hitting ‘Ok’ to the check saved image prompt, Clonezilla will begin the initial configuration and preparations for imaging. The imaging process hasn’t started yet though! When all the checks are done, Clonezilla will prompt one last time to verify that all parameters are correct and ask to begin the imaging process.
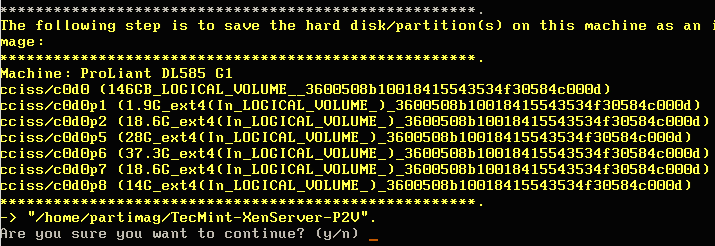
Clonezilla Imaging Process and Configuration
18. After confirming that all the settings are confirmed, Clonezilla will start the imaging process and provide some insight into the status.
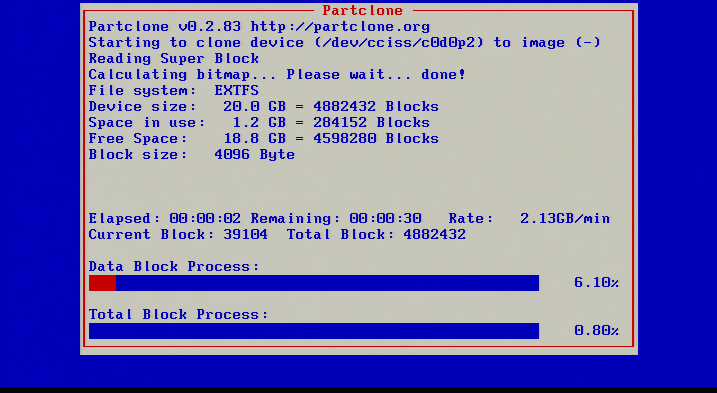
Clonezilla Disk Imaging Process
19. This screen will gradually fill up with red indicating the progress of the imaging. If instructed, Clonezilla will check the saved image immediately after taking the image. Once Clonezilla has finished, it will provide instructions on how to continue.
Clonezilla Disk Cloning Finishes
This is a great sign that the image was likely taken successfully and should be ready to be moved to the virtual guest within XenServer.
XenServer Virtual Guest Creation
20. The first step is to build a virtual machine to restore this newly image physical server. This is accomplished with a series of ‘xe’ commands. The first ‘xe’ command will be used to locate the necessary UUID’s for the storage repository.
# xe sr-list name-label="Tecmint Storage"
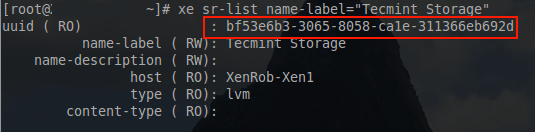
Find Storage Repository UUID
With the UUID of the storage repository available, the next task is the creation of the virtual guest from a template. The physical server that is being virtualized here is a Debian 8 system and as such, the Debian template will be utilized.
# xe vm-install template=”Debian Wheezy 7.0 (64-bit)” new-name-label="TecmintVM P2V" sr-uuid=bf53e6b3-3065-8058-ca1e-311366eb692d

Create Virtual Guest from Template
Note: If virtualizing something that isn’t Debian, the following command can be used to see the list of templates available.
# xe template-list
It is always a good idea to confirm the creation/modification of technology items. To confirm the creation of this virtual guest issue the following command.
# xe vm-list name-label=Tecmint\ P2V\ VM
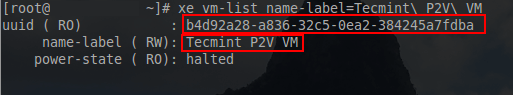
Confirm Virtual Guest Creation
21. Now that the guest has been created, some of the boot parameters need to be adjusted. This particular guest will need to PXE boot first in order for Clonezilla to be able to recover the recently imaged physical server. Changing the virtual guest to boot via PXE can be accomplished and confirmed via the following ‘xe’ commands.
# xe vm-param-set uuid=<vm_uuid> HVM-boot-policy="BIOS order" HVM-boot-params:order=n
# xe vm-param-list uuid=b4d92a28-a836-32c5-0ea2-384245a7fdba | grep -i hvm

Enable Virtual Guest Boot via PXE
22. At this point the guest is set to boot via the network but the template didn’t provide a network interface for this virtual machine. A virtual interface (VIF) must be attached to this guest in order for the guest to boot via PXE. The first step is to locate the appropriate network for this virtual machine.
# xe network-list
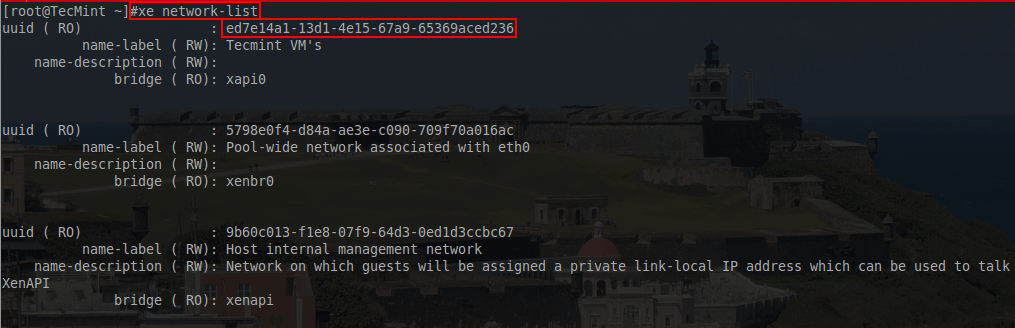
List Virtual Interface for Virtual Machine
23. The network that this VM should use is the “Tecmint VM’s” network and the UUID output from this command is necessary to attach a VIF the the virtual machine. With the network UUID available, a VIF can be added to the guest for PXE booting using another ‘xe’ command.
# xe vif-create network-uuid=ed7e14a1-13d1-4e15-67a9-65369aced236 vm-uuid=b4d92a28-a836-32c5-0ea2-384245a7fdba device=1
# xe vif-list vm-uuid=b4d92a28-a836-32c5-0ea2-384245a7fdba
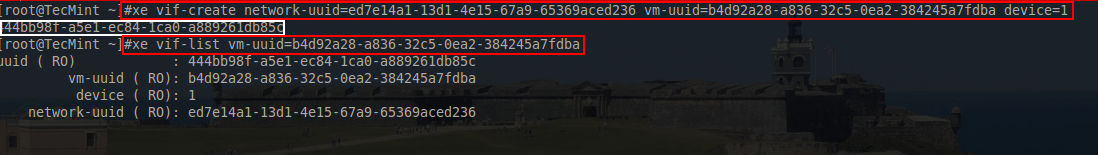
Add-Virtual Machine to PXE Boot
24. At this point the guest is ready to attempt PXE booting however in order to see the guest’s console, a sshtunnel to the XenServer is necessary and xvncviewer will be needed to connect to the console over the SSH tunnel.
The first step is to power on the guest in order to determine the domain it was started within. The following series of commands are done on the XenServer host to determine the necessary information for the VNC client connection.
# xe vm-start vm=Tecmint\ P2V\ VM
# xe vm-list params=dom-id name-label=Tecmint\ P2V\ VM
# xenstore-read /local/domain/1/console/vnc-port
These commands will start the VM, locate the domain the the VM is running in, and then using that domain number, the VNC port will be determined for the xvnc client to connect.
This process must be accomplished quickly and on the XenServer host. If there are any problems booting, the VM will shutdown in approximately 30 seconds and a console session to the guest will not be available.
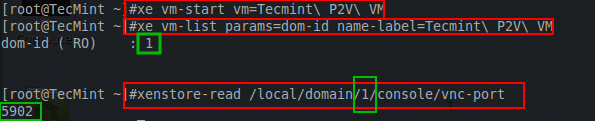
Find Virtual Machine Information
With the last green box, the information necessary to build the SSH tunnel to the XenServer host has been located. Now a SSH tunnel can be created using the following command.
# ssh -L <any_random_port>:localhost:<VNC_Port_Above> root@<server> -N
# ssh -L 5902:localhost:5902 root@<server_ip> -N
This sets up a SSH connection to the XenServer '<server>' from port 5902:localhost to port the VNC port on the XenServer determined above which in this example is also 5902. Now using Xvncviewer the console for this PXE booting VM can be viewed.
# xvncviewer localhost:5902
If all goes as planned, a small window should be presented that will contain the console session of the virtual guest on the XenServer host.
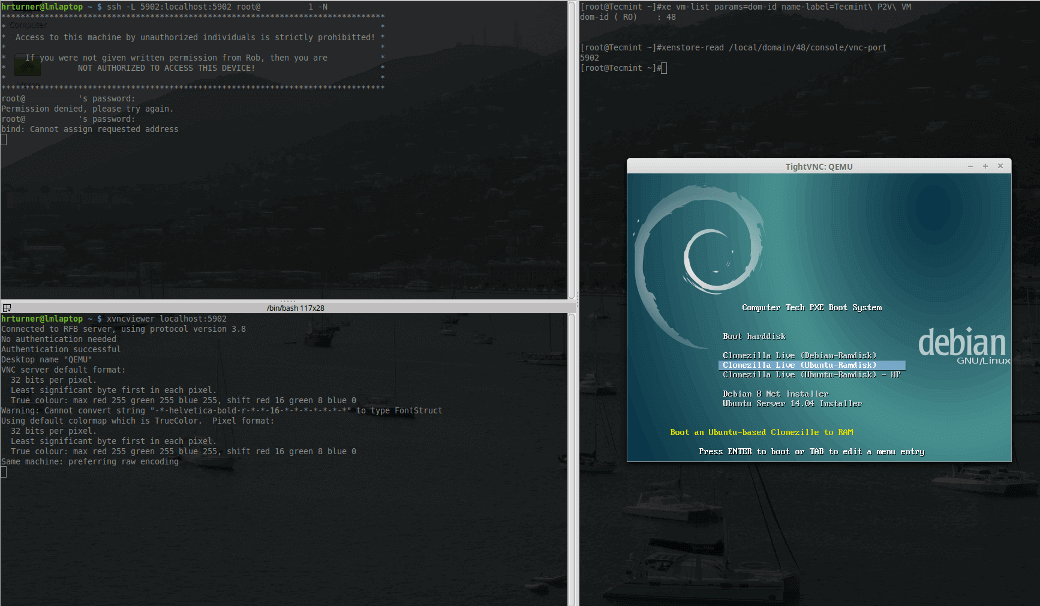
XenServer Virtual Console on VNC
25. At this point the console session is established and the host can be PXE booted to Clonezilla in order to push the image previously taken to this new virtual host.
A couple of cautions before continuing:
- The xvnc client may disconnect from time to time if the guest changes the graphics resolution. If this happens simply reconnect using the xvncviewer command from earlier.
- Clonezilla will require that this virtual machine have as much or more disk space available in order to recover this image to the virtual host.
- This process will take close to, if not longer than, the same amount of time as the initial imaging from the beginning of the article. Be patient and allow the process to finish.
- For some unknown reason, XenServer appears to be very picky about the pxelinux.0 file it will use to boot guests. To get this process to work, Debian’s netboot files were used and can be downloaded from here: https://www.debian.org/distrib/netinst#netboot.
Imaging the XenServer Virtual Guest with Clonezilla
26. At this point, the guest machine should be booted to Clonezilla via PXE and a console connection established to see the output of the process through xvncviewer.
Clonezilla starts the installation process of asking the user to choose between starting Clonezilla or starting a shell. Select ‘Start_Clonezilla’ to begin the process.
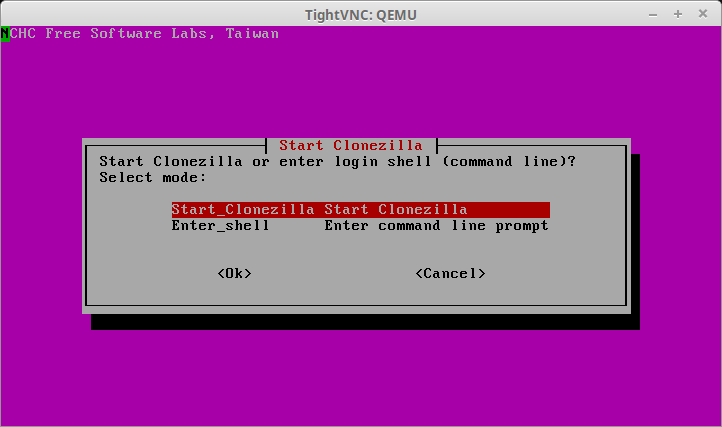
Start Clonezilla on Guest Machine
27. The following screen will determine the cloning method to be used for this particular session. Be sure to select ‘device-image’ at this prompt.
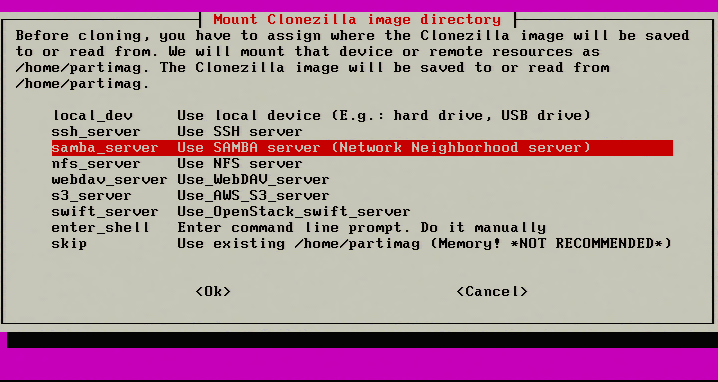
Select Device Cloning Method
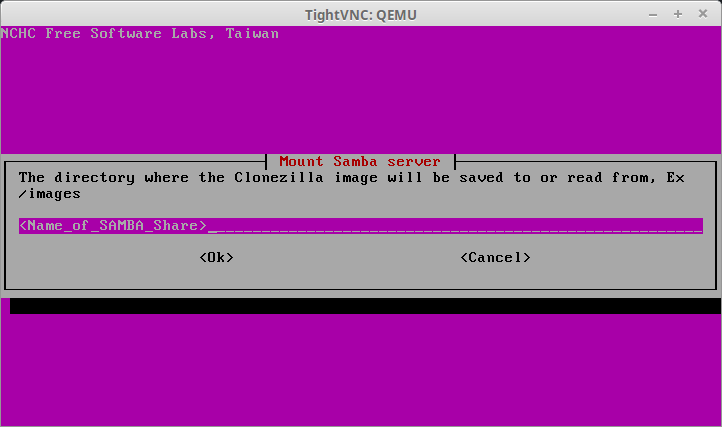
28. The next screen will ask how the image will be obtained. This article imaged the physical server to a SAMBA server and as such, the image will need to be retrieved from that same SAMBA server. To accomplish this, select the option ‘samba_server’.
Add Clonezilla Image Storage
29. The next couple of screens will ask for information about the SAMBA server such as IP address, login information, and the directory where the images are stored (default is /images). Fill in the proper information for the environment.

Add Samba Mount Location
Enter Samba User Name
Enter Samba User Password
30. At this point, assuming that all information has been input correctly and the server is accessible, Clonezilla will successfully mount the remote SAMBA share to the system to retrieve the image of the physical server. The following screen shot shows a successful connection to the SAMBA server.
Mounting Remote Samba Share Clonezilla
31. With the SAMBA share now mounted and accessible, the next step of this process is to instruct Clonezilla to recover from the image previously taken. With the first prompt, select ‘Beginner’ to start the process.
The screen that follows is the important screen. This screen is where Clonezilla will be instructed to recover the full disk image taken earlier in the article. The option needed here is ‘restoredisk’.
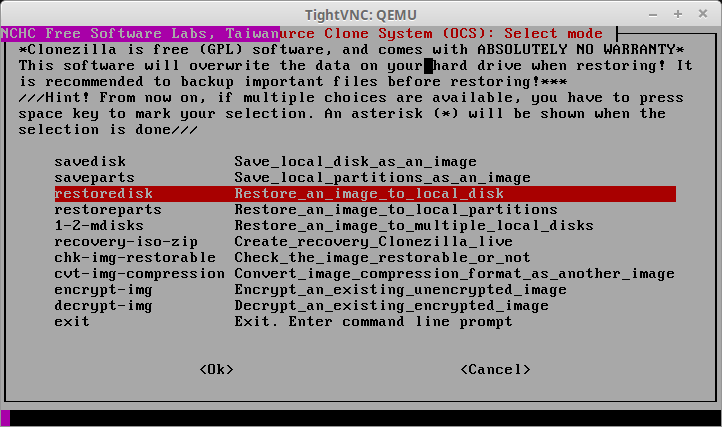
Restore Clonezilla Image
32. After hitting enter, Clonezilla will scan the SAMBA share for possible images to recover and present a list of options on the following screen. If this SAMBA share happens to have a lot of images, be sure to double check the proper image is being selected.
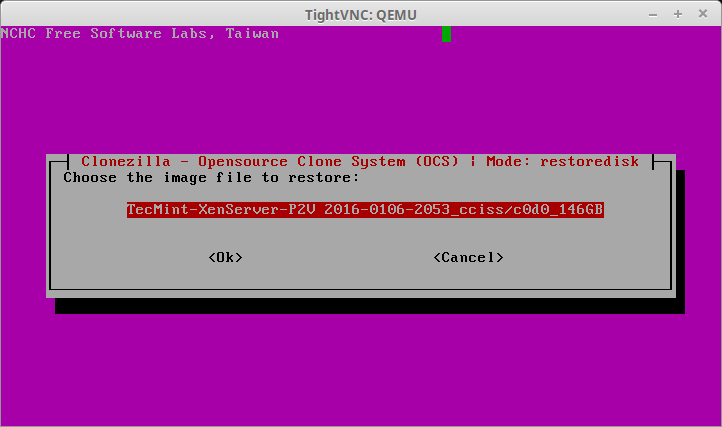
Select Image File to Restore
33. The next screen will ask the user to confirm the hard drive to restore the previously selected image. This will be the virtual machine’s hard disk. Be sure that this hard disk is as large as or larger than the drive space from the physical server! Clonezilla will fail if the device runs out of space.
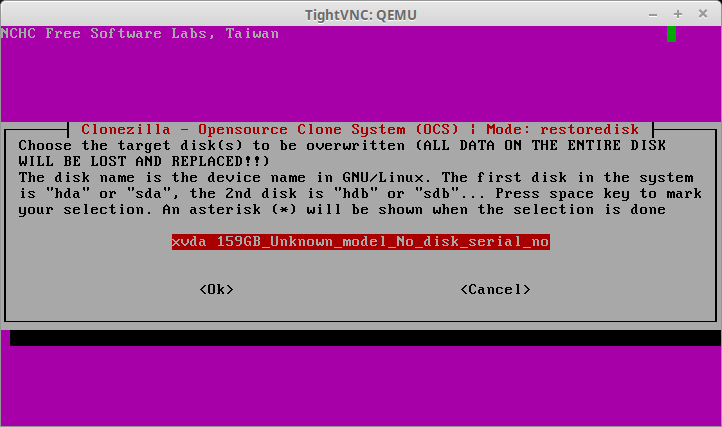
Confirm Clonezilla Disk Restoration
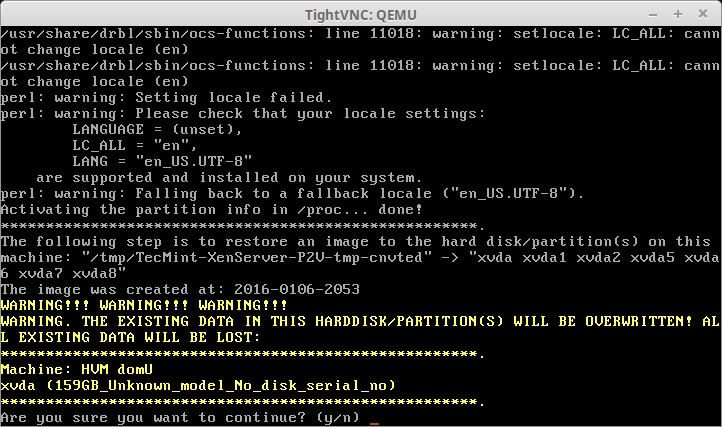
34. After selecting the appropriate hard drive, Clonezilla will prompt several times to confirm that the changes about to take place are correct. Be sure to double check that the image is correct, the drive to write the image to is correct, and that the hard disk to accept this image is as large as or larger than the drive in the physical server being virtualized.
Confirm Disk Restore Settings
35. This next prompt will provide some potential warnings to the user. In the case of this particular physical server, the unit had a special RAID device for the hard drives.
Clonezilla provides a warning to the user that the fstab file may need to be modified if device names were used in the file rather than UUID value for the partitions. This should be correctable after booting into the VM but it is something to take note of when virtualizing systems.
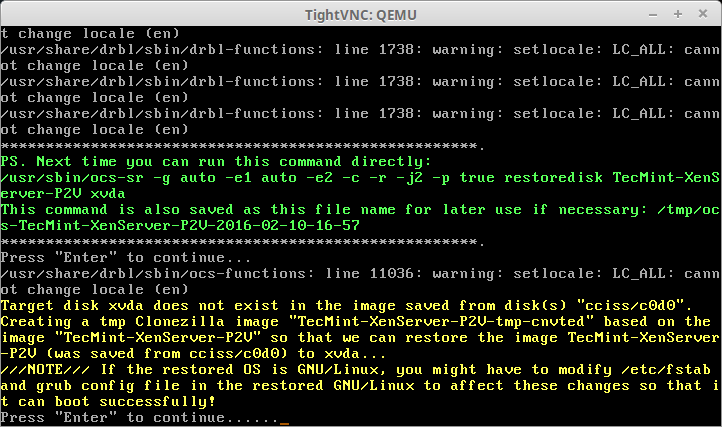
Disk Restore Warnings
36. The last prompt is the final confirmation before Clonezilla will start the imaging process. Make sure that everything is completely accurate before confirming. Anything beyond this point will cause data loss on the virtual guest as the Clonezilla image will be recovered to this virtual guest’s hard disk.
Clonezilla Image Restoration Confirmation
37. If Clonezilla start successfully, the next screen will be a progress indicator. A word of caution. If the physical server had multiple partitions, this screen will flash up multiple times for each partition being recovered.
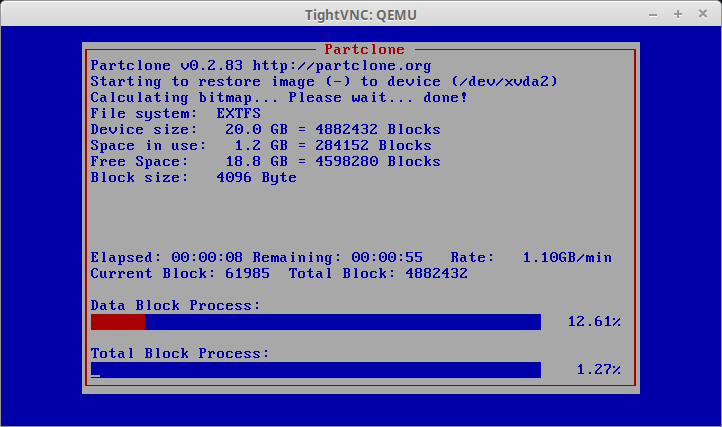
Clonezilla Image Restoration Process
38. Once the process finishes, Clonezilla will indicate if the process was successful or not and prompt the user for what to do next. One thing to keep in mind if the physical server is still up and running, once the virtual server is up and running as well they may be using the same IP address and this could cause issues with access to both servers.
Use caution when booting the new virtual server on a production network. Another option is once the guest has been imaged, remove the VIF (virtual interface) from the guest so that it won’t have a network connection when it restarts (this won’t affect management of the server through the SSH tunnel). Removing the VIF can be accomplished with two commands.
# xe vif-list vm-uuid=<uuid_of_VM> | head -1
# xe vif-destroy uuid=<uuid_from_above_command>
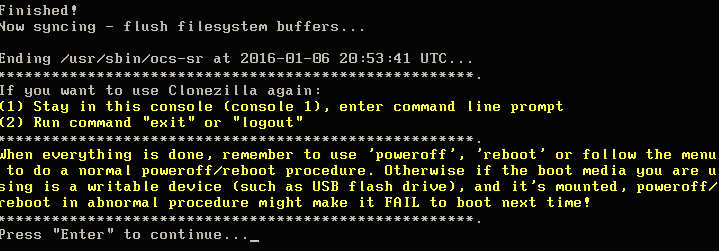
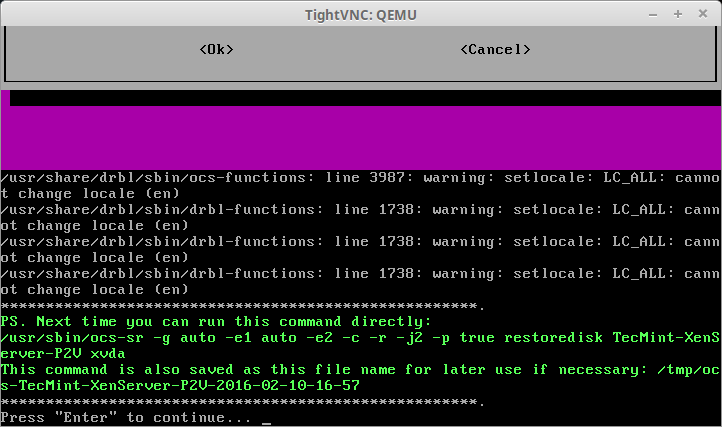
When Clonezilla is done, it will alert the user as to whether or not the image was successfully copied to the virtual guest.
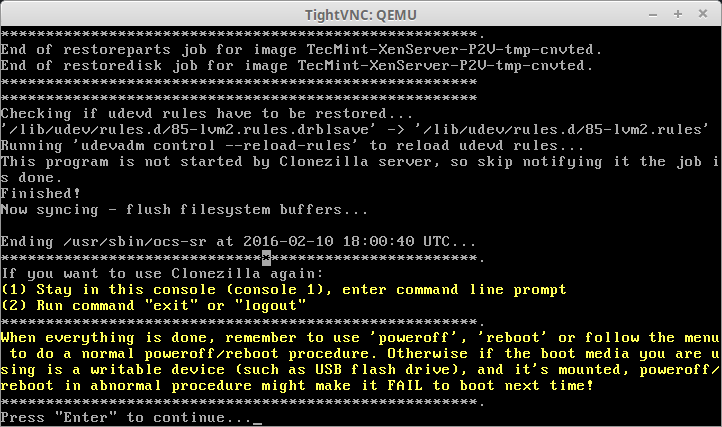
Clonezilla Disk Cloning Finishes
39. The next screen will provide the option to restart the virtual guest but from earlier in this article, the boot device was set to network boot and as such it needs to be changed back to the virtual guests hard disk first and network second. This is easily accomplish on the XenServer host by modifying the xe command from earlier.
# xe vm-param-set uuid=<uuid_of_VM> HVM-boot-params:order=cn
Once the command above has been entered, the guest can be rebooted from the next menu presented by Clonezilla.

Reboot Guest Virtual Machine
40. Rebooting will restart the virtual machine and disconnect the VNC session. There is a slight chance that the domain that the virtual machine starts up in or the VNC-port may change upon rebooting the virtual host.
It is suggested to have a SSH connection to the XenServer host open already so that command from earlier can be used to quickly determine the domain id and VNC-port again. Having this ready will make it easier to quickly re-establish a SSH tunnel to the XenServer host as well.
Upon rebooting, hopefully you’ll be presented with the wonderful boot screen of a physical server that is now a bona fide virtual host running on a XenServer system!
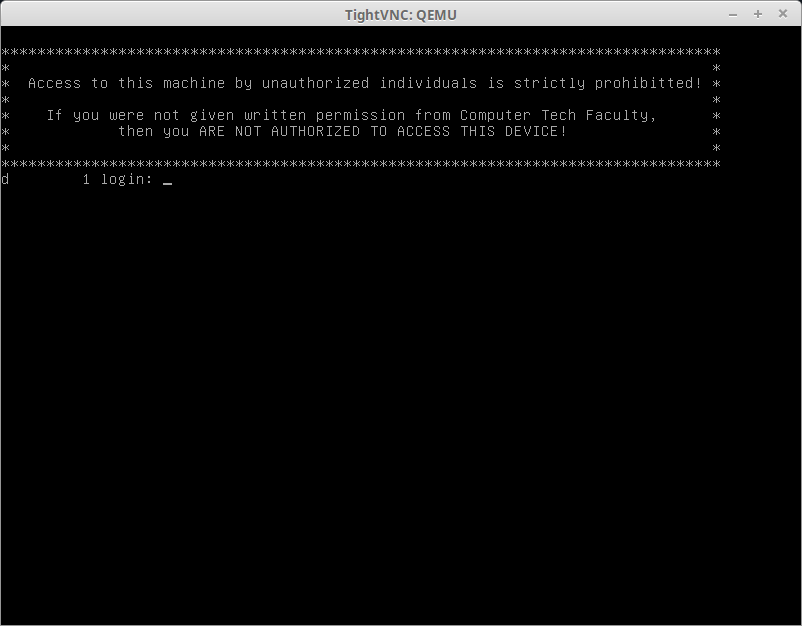
Boot Screen of Physical Server
There it is, a successful physical to virtual migration on a XenServer host. The physical server used for this virtualization had some special network configurations that will require further configuration in order to get it completely back up and running but once the host boots, these issues can be corrected.
Thanks for having the patience to read through this entire article and hopefully it will provide some insight into physical to virtual migrations within XenServer!
The next article in this series will cover XenCenter (Citrix’s approved GUI application method of managing XenServers) as well as an open source web based alternative known as Xen Orchestra.
Managing XenServer with a XenCenter and Xen Orchestra Web Interfaces – Part – 7
Up to this point all of the management of the XenServer host has been accomplished via a remote SSH connection. This is arguably the most straight forward approach, but it doesn’t always scale well to large XenServer pools or installations.
Several applications/utilities exist in order to manage XenServer implementations and this article will cover the highlights of some of the commonly used options as well as provide a bash script for Linux user’s to obtain a console session to a guest running on a XenServer host.
Go through our XenServer Part 1 to 6 series to learn how to install, configure and manage XenServer 6.5.
Citrix provides a Windows only utility known as XenCenter that allows an administrator to manage XenServerimplementations and the utility scales very well.
XenCenter provides all of the major features necessary for an administrator to effectively and efficiently manage XenServer hosts. XenCenter will allow for an administrator to manage multiple XenServer servers or pools and allows for the easy creation of guests, storage repositories, network interfaces (bonds/VIF), and other more advanced features in XenServer.
A third party option for managing XenServer implementations includes a web based manager known as Xen Orchestra. Xen Orchestra, in contrast to XenCenter, is installed on a Linux system and runs its own web server that allows system administrators to control XenServer implementations from theoretically any operating system.
Xen Orchestra has many of the same features as XenCenter and is constantly adding new features (including Docker management, disaster recovery solutions, and live resource modifications) and provides support subscriptions to companies who wish to have technical support on the product.
System Requirements
- XenServer 6.5 installed, updated, and accessible over the network.
- A Debian based Linux distro ( Xen Orchestra install only).
- Windows Machine ( Virtual or physical is fine; XenCenter install only).
Installation of XenCenter in Windows
XenCenter is Citrix’s approved method for managing XenServer. It is a fairly user friendly utility that can accomplish the bulk of the day to day tasks within organizations that utilize XenServer.
It is available both directly from Citrix (XenServer-6.5.0-SP1-XenCenterSetup.exe) or it can also be obtained from an already installed XenServer host by visiting the hosts IP/hostname from a web browser.
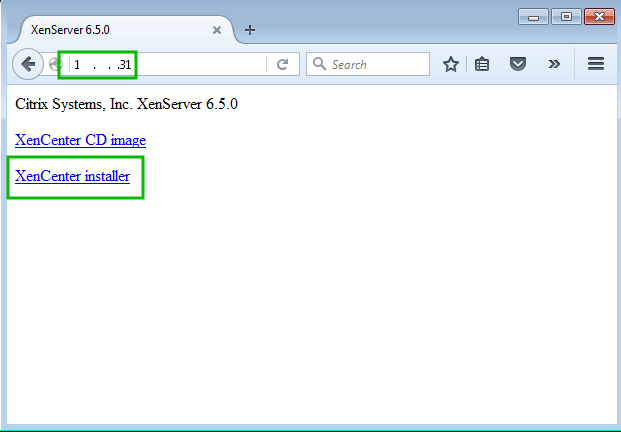
XenCenter Installer
Once the installer has downloaded, it needs to be launched to actually install XenCenter to this particular host. The installation is very straight forward and once the installation is done, the application can be launched by clicking the XenCenter icon on the desktop or by locating the program in the Windows start bar.
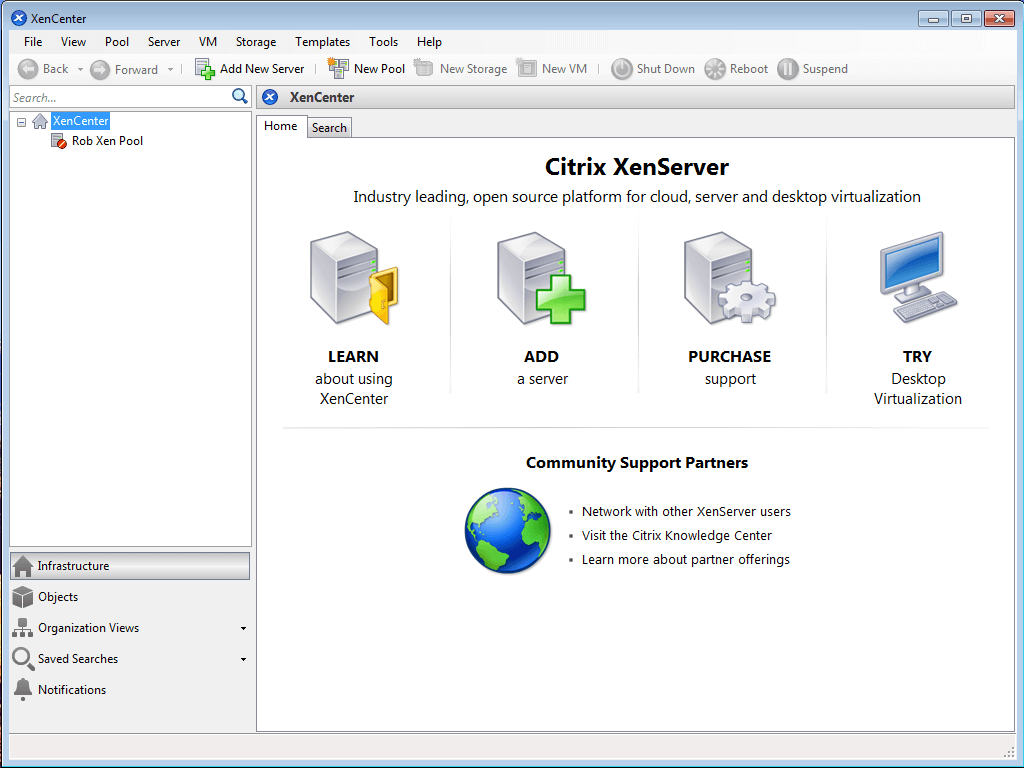
Launch XenCenter
The next step in starting to manage XenServers with XenCenter is to add them to the panel by clicking ‘Add New Server‘.
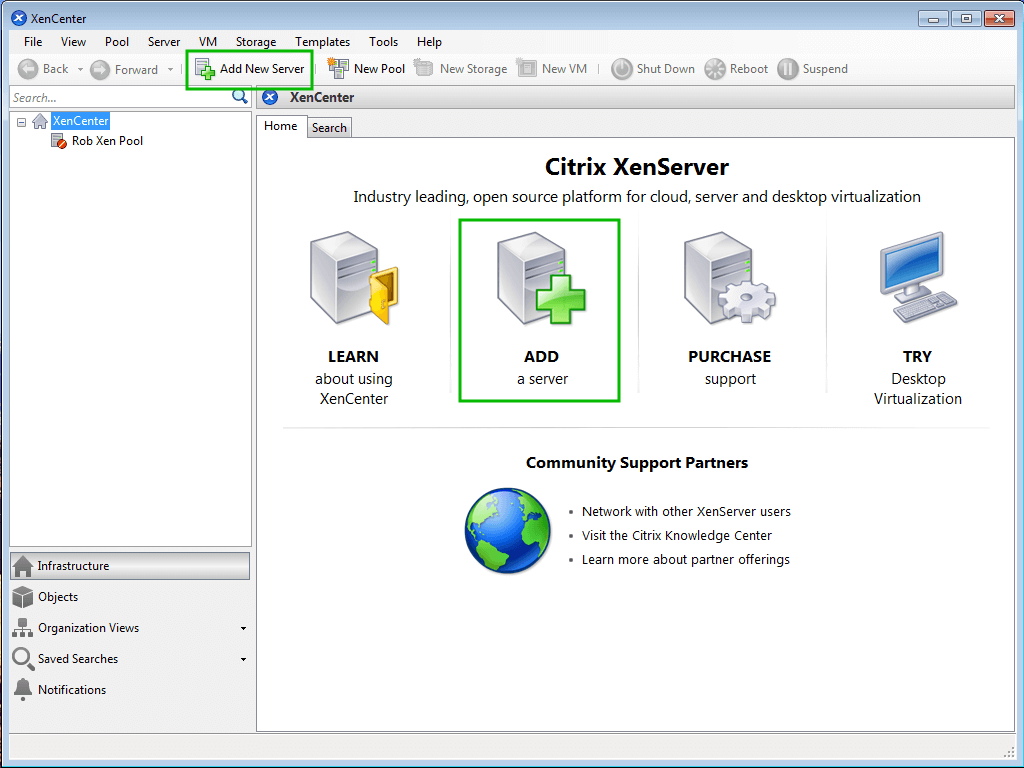
Add New Server in XenCenter
Clicking the ‘Add New Server‘ button will prompt for the IP address or hostname of the XenServer that should be added to XenCenter. The prompt will also request a username/password combo for a user to log into the host as well.
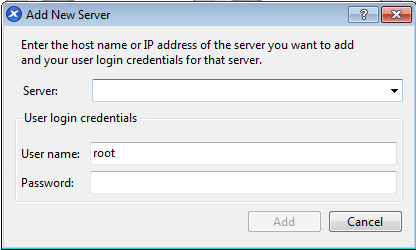
Add Hostname of XenServer
Upon successful authentication, the Xen server(s) should appear in the left panel of XenCenter showing that proper authentication has occurred and that the systems can now be managed through the interface.
The particular output here shows two Xen hosts as they were pooled together (more on this in future articles).
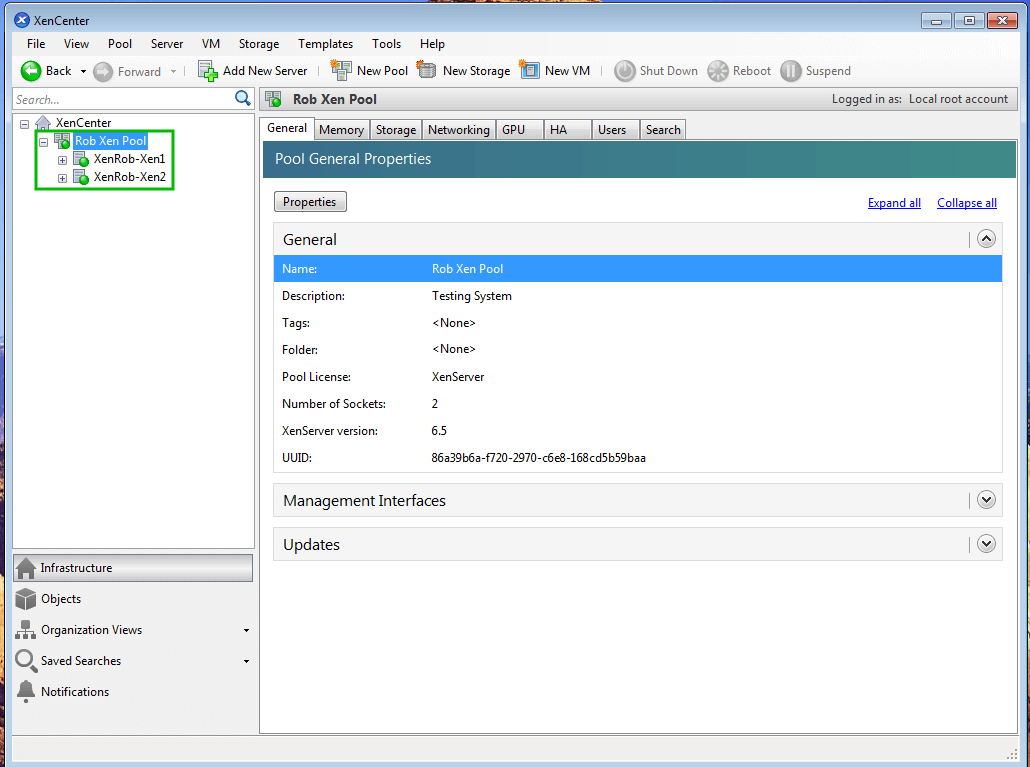
XenCenter XenServer Management
Once a successful connection has been established, configuration of the host(s) can begin. To view the details of a specific host, simply highlight the host by clicking on it and ensuring the ‘General‘ tab is selected in the center panel.
The ‘General‘ tab can be used to gain quick insight into the current configuration of this particular host including current status, patches applied, uptime, license information (if applicable), and more.
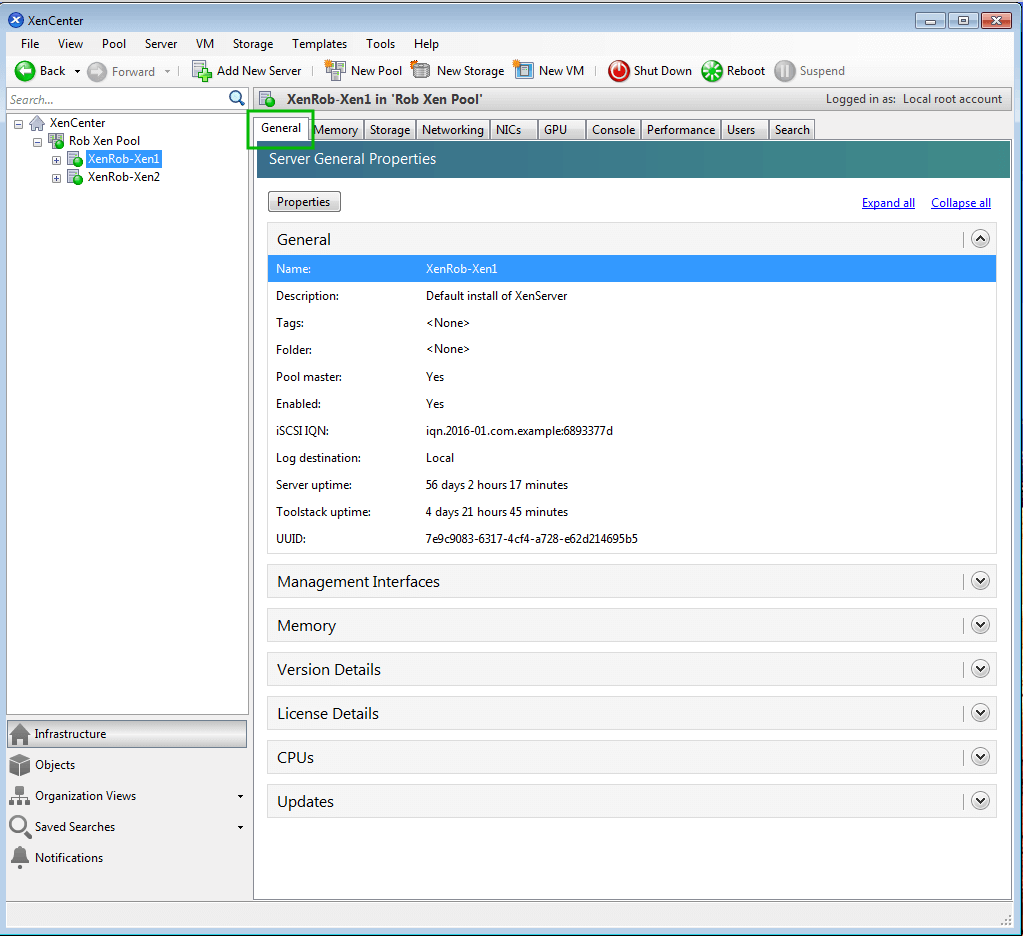
View XenServer Properties
The tab names at the top of the host control panel are very self explanatory as to the purpose of that particular tab. Taking a closer look at some of them, many aspects from this series of articles can be confirmed.
For instance in part 3 “XenServer Network Configuration”, a network for Tecmint guests was created from the command line.
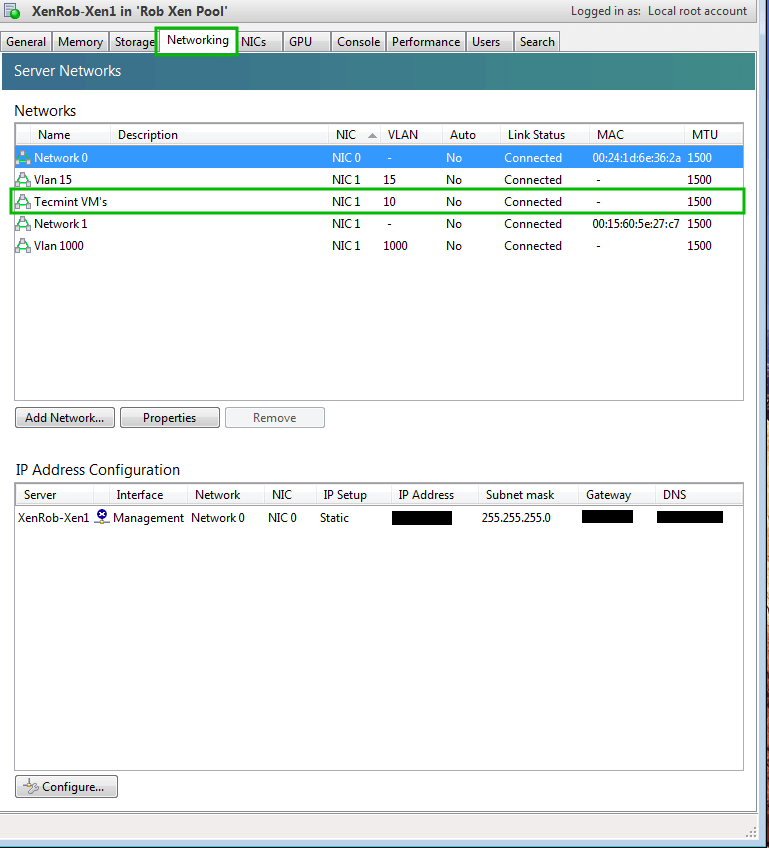
View XenServer Network Configuration
Arguably the most valuable tab within XenCenter is the ‘Console‘ tab. This tab allows the administrator to have console access to the XenServer host’s and virtual guest’s desktop interface.
This screen can also be used to manage the virtual guest operating system in the event that remote administration techniques are unavailable.
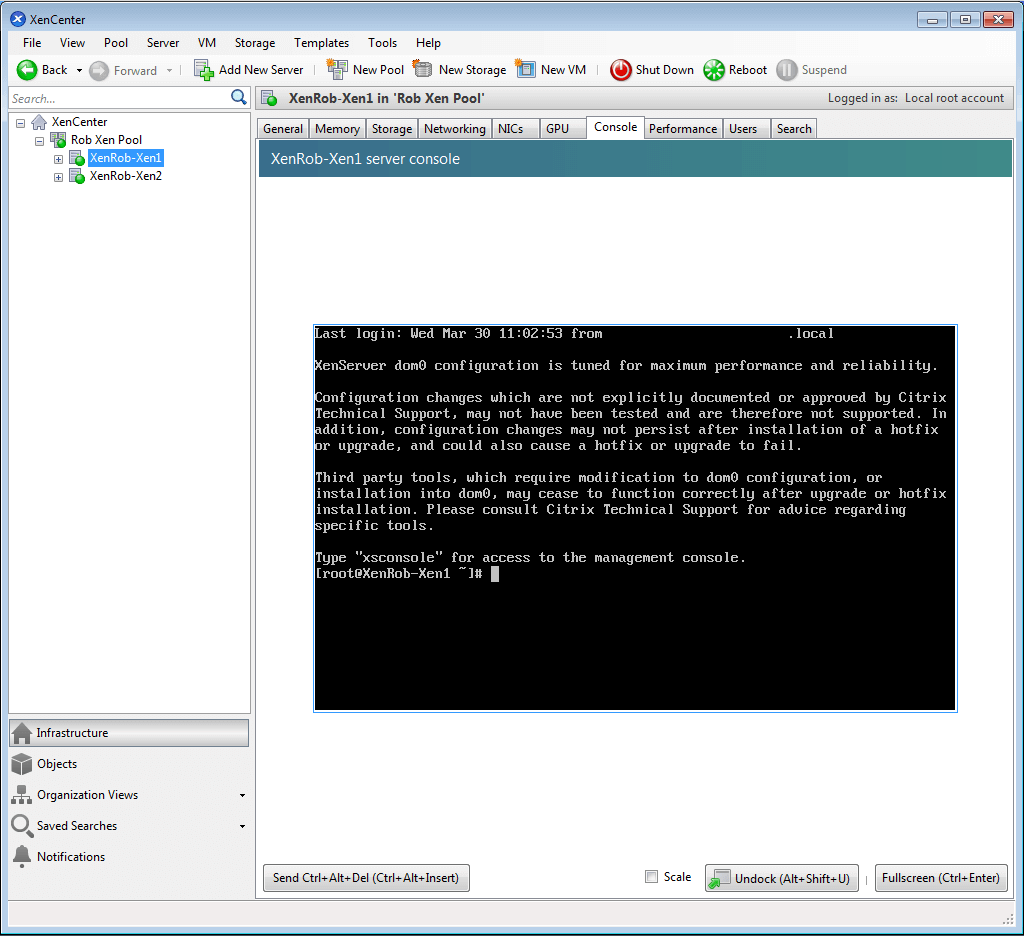
Manage and Access XenServer VM’s Console
As can be seen from the interface, the XenCenter tool is a very versatile tool but does have the major drawback of only being available for administrators who use Windows or have a Windows virtual machine running somewhere.
For those who chose XenServer for its open source nature, it is frustrating that Windows is required in order to manage the system however there are still options.
Installation of Xen Orchestra
Xen Orchestra, as mentioned earlier, is a web based method for managing XenServer infrastructures. The officially supported and suggested product to use in a production environment is the Xen Orchestra Appliance, or often called XOA.
This appliance is a pre-built and highly stable Debian virtual guest that can be installed to a XenServer host or run through VirtualBox.
Once XOA is up and running, the Xen Orchestra web interface is available and can be used to manage XenServers.
There are many benefits to using the official XO appliance but there is also the ability to install Xen Orchestrafrom sources as well. Installing from sources provides all of the latest and greatest bug fixes and feature enhancements directly from the Xen Orchestra development team.
The next few paragraphs will walk through the process of manually installing Xen Orchestra on a Debian 8 Jessie install. It is assumed that a Debian 8 system is already running and fully updated from the official Debian repositories.
To see how to install Debian 8 please see the walk through found here Installation of Debian 8 Jessie.
The official guide to building XO from source can be found here. The following are modified steps to accomplish the same task on a host running Debian 8 Jessie.
The first step to building Xen Orchestra (XO) from sources is to install the necessary dependencies. According to the XO documentation the dependencies can be installed with the following command.
# apt-get install wget build-essential redis-server libpng-dev git python-minimal
Next node.js needs to be installed as it is required by XO. The installation of node.js can be accomplish by following the next few steps.
# wget -c https://raw.githubusercontent.com/visionmedia/n/master/bin/n
# chmod u+x n
# ./n lts
# npm i -g npm
Be sure to check that the proper versions of both 'node' and 'npm' are installed with the following commands.
# node -v
# npm -v
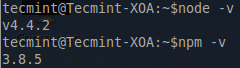
Check Nodejs and NPM Version
After the successful completion of these commands, all the necessary dependencies are installed and the system is ready to begin the installation of the XO server and XO web components.
# git clone -b stable http://github.com/vatesfr/xo-server
# git clone -b stable http://github.com/vatesfr/xo-web
# ls -l
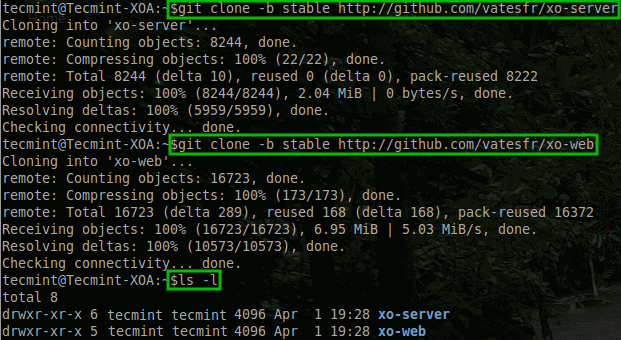
Installation of Xen Orchestra
The first step is to prepare the XO-Server. All of the commands to prepare the XO server must be issued from within the 'xo-server' directory.
# cd xo-server
# npm install && npm run build
This process will take some time (circa 5 minutes) and does require an active Internet connection. Once complete the server configuration file needs to be created and modified to point to the web information that will be built in the next paragraphs.
The 'xo-server' and 'xo-web' folders are assumed to be in the same parent directory according to the installation instructions; modify to fit the environment as needed.
To accomplish the server’s configuration issue the following commands.
# cp sample.config.yaml .xo-server.yaml
# nano .xo-server.yaml
Once the '.xo-server.yaml' file is opened, navigate toward the bottom of the file and locate the line ‘# List of files/directories which will be served.’. Below this line there is a line that will be commented out with a ‘#’and the comment needs to be removed.
If xo-server and xo-web directories are in the same parent folder, change the line to: '/':'../xo-web/dist' (single quotes are needed in the preceding code).
Otherwise, make the appropriate changes to the path for the 'xo-web/dist/' folder. (NOTE: A privileged user is required to bind to port 80).
If a non-privileged user is to be used, locate the line 'port: 80' in the '.xo-server.yaml' file and change the port value to a port number above 1024. This guide will use port 8080 by setting the port directive as such 'port: 8080'.
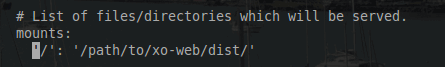
Configure Xen Orchestra
Save the changes to this file and exit the text editor. At this point the server should be able to be started successfully. Test this before continuing by issuing the following command (To stop the server, hit 'ctrl' + 'c' keys).
$ su -c 'npm start'
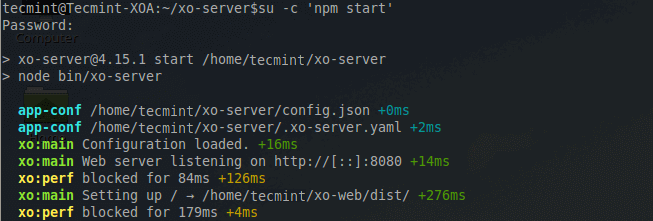
Start NPM Service
Now the web files for the XO server need to be prepared. This is a simple process that must be done from within the 'xo-web' directory.
$ cd ../xo-web
$ npm install
$ npm run build
The build process for the web files will take time and requires an active Internet connection as well. Once the process is complete, the server can be started again and will deliver the newly created web files.
$ cd ../xo-server
$ su -c 'npm start'
At this point open a web browser and navigate to the XO-Server's IP address and port number. In the configuration above, the server was opened on port 8080 so to connect to Xen Orchestra, the following url will be needed:
http://:8080
Once successfully connected, the default user-name and password are as follows:
User-name: admin@admin.net
Password: admin
A successful login should result in the following web page loading.
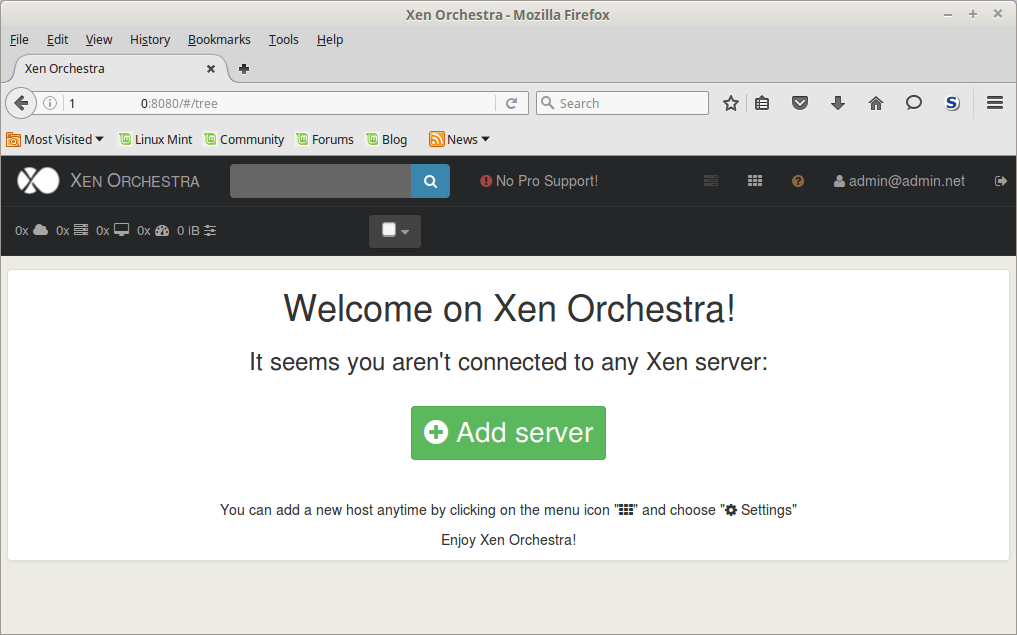
Xen Orchestra Web Interface
At this point Xen Orchestra is working and ready to be used to manage XenServer hosts.
NOTE: As mentioned earlier, it is strongly recommended that the official Xen Orchestra appliance be used to manage production XenServer hosts! These instructions walked the reader through installing the absolute newest feature set of Xen Orchestra from sources.
Using Xen Orchestra
With all of the building out of the way, it’s time to learn how to use Xen Orchestra. The first step to managing XenServer hosts in XO is to add the server. Clicking the ‘Add server‘ button on the home page will launch the add server prompt.
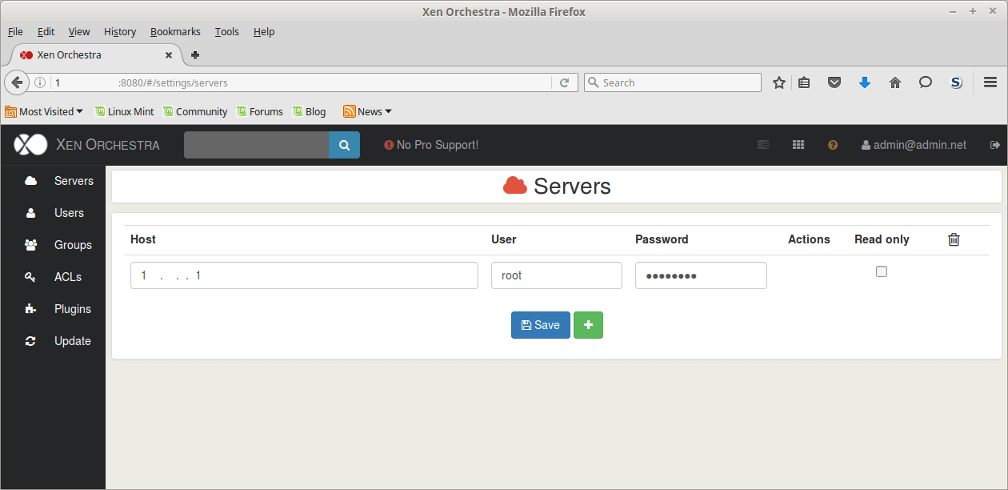
Add New Server Under Xen Orchestra
Provide the prompt with the proper credentials and hostname/IP address for the XenServer to connect to and upon successful authentication, XO will display the XenServer host information.
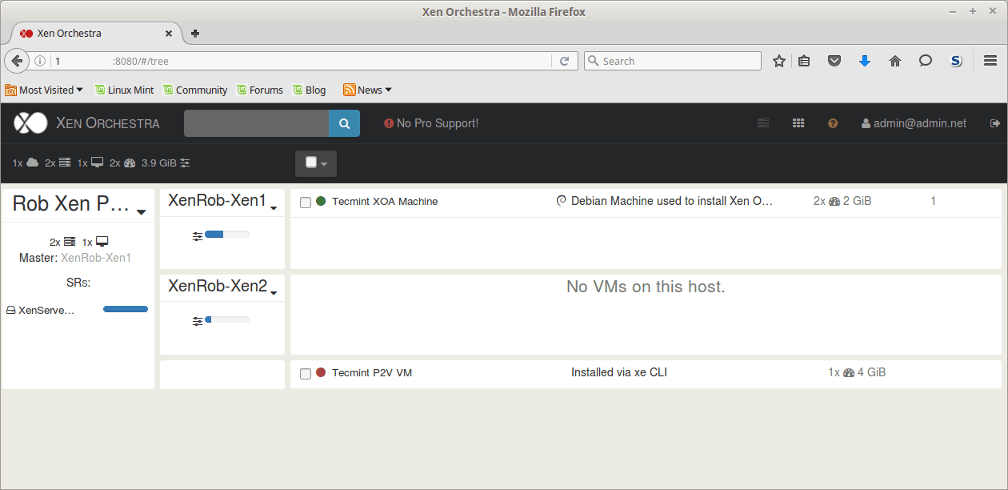
View XenServer Host Information in Xen Orchestra
Much of the functionality from XenCenter has been built into Xen Orchestra as well but some of the options may be a little more obscure to find at first. Let’s walk through some of the commonly needed tools within Xen Orchestra.
Managing the XenServer hosts themselves can be accomplished by clicking the drop down arrow next to the name of each host or by clicking on the actual name a more detailed information page about the host can be obtained.
The first image is the drop down menu and the second image is the XenServer host specific page obtained by clicking on the name of the XenServer rather than the drop down menu.
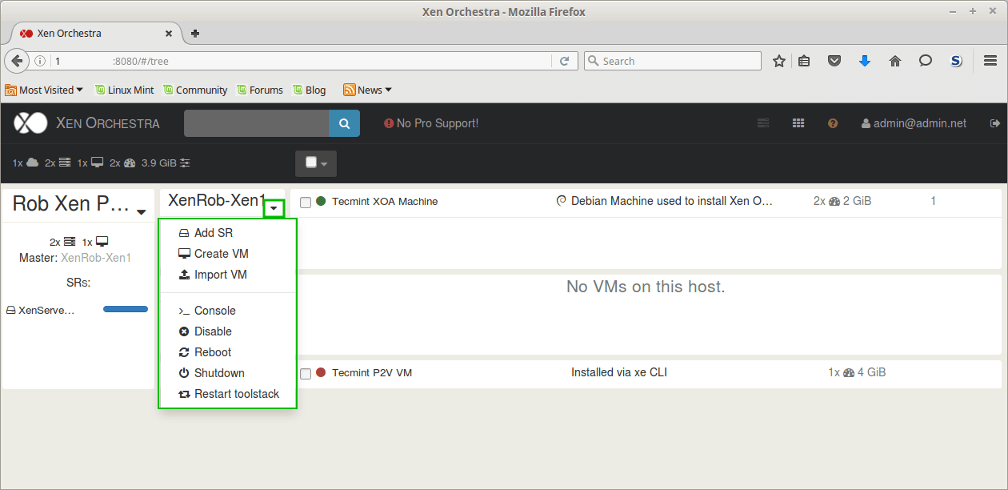
Manage XenServer Hosts in Xen Orchestra
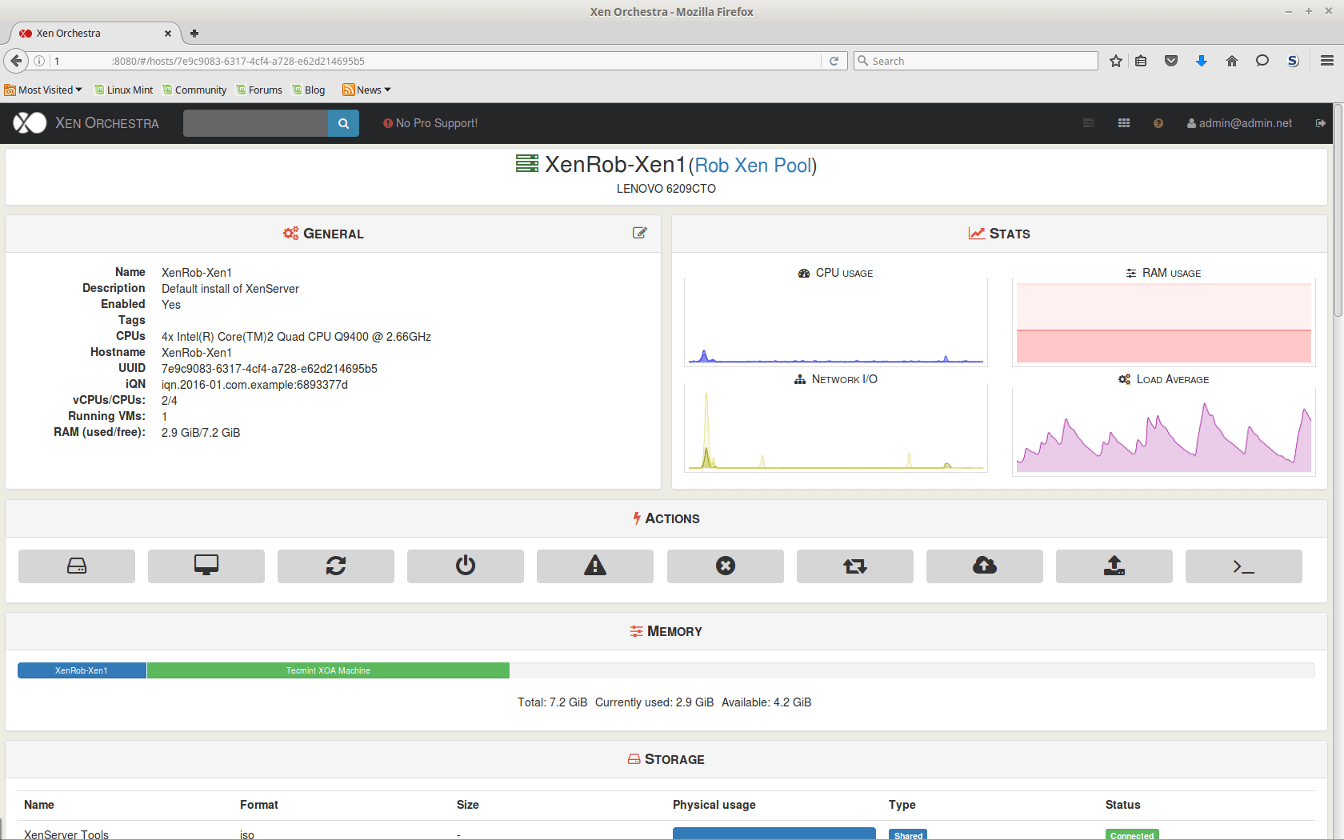
Monitor XenServer Host in Xen Orchestra
From both of these options, several XenServer specific actions can be accomplished such as adding storage repositories, creating virtual guests, and even console access to the XenServer host itself.
Working with the guests themselves is also very easy within Xen Orchestra. By clicking the XO button in the top left of the page and then clicking on the virtual guest from the main screen, an administrator can control the many configuration options of virtual guests.
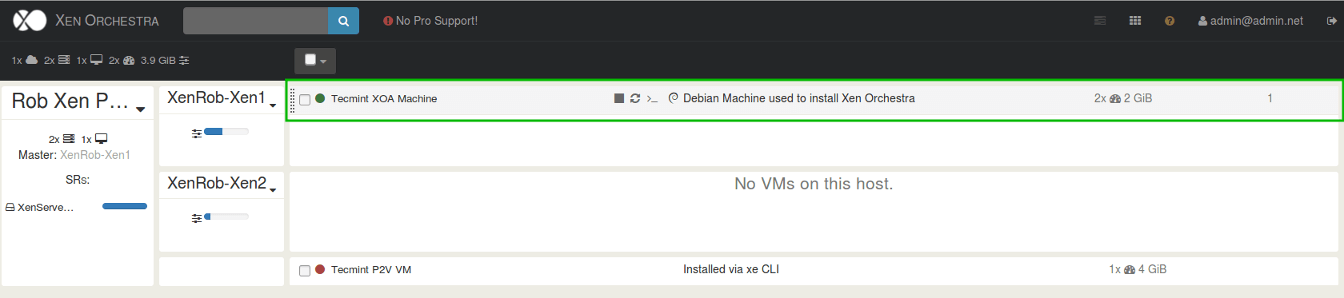
Configure XenServer Host Settings in Xen Orchestra
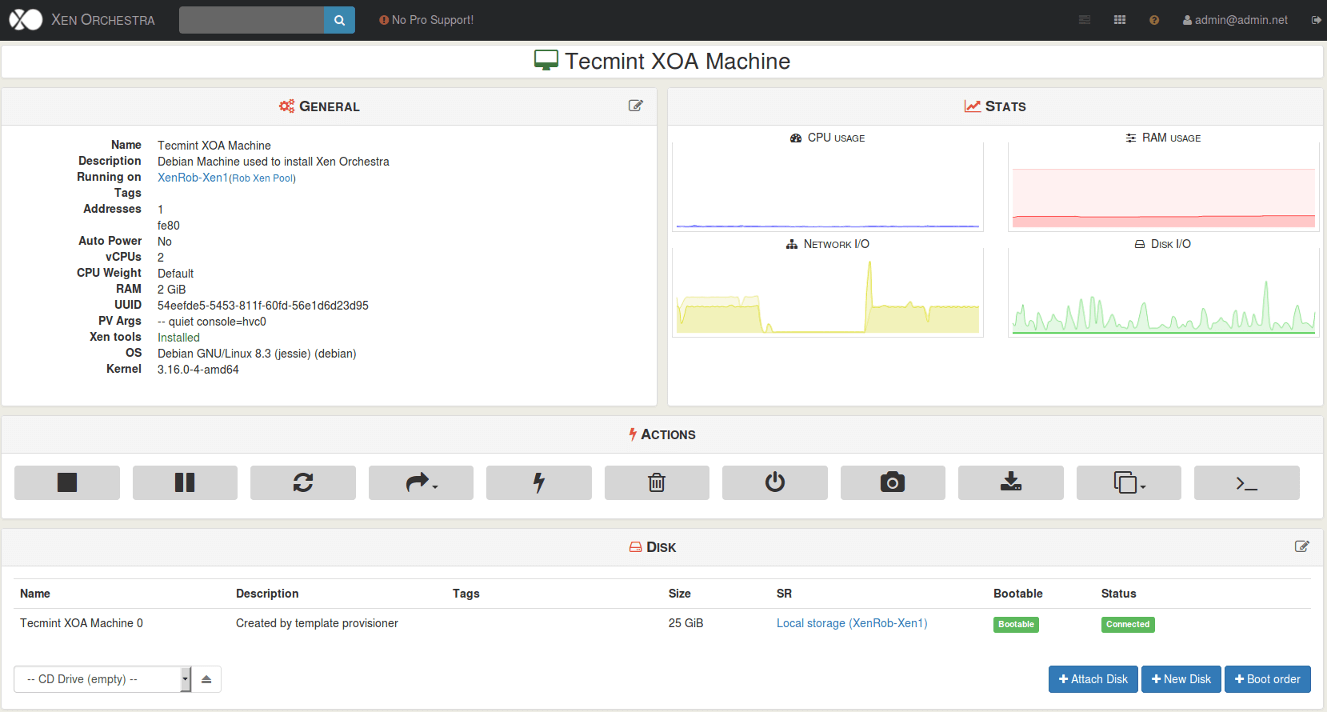
XenServer Host Machine Details
From the virtual guests page, many of the aspects of the virtual guest can be managed including rebooting, snapshots, copying, and console sessions.
One of the other administrative functions that Xen Orchestra provides is the ability to quickly migrate virtual guests to another server through a drag and drop interface.
To accomplish this, a pool of XenServers must be created with shared resources and added within the Xen Orchestra interface. Once the pool is added, the administrator simply has to navigate to the main page of XO and drag the virtual guest to the XenServer host in which it should be migrated.
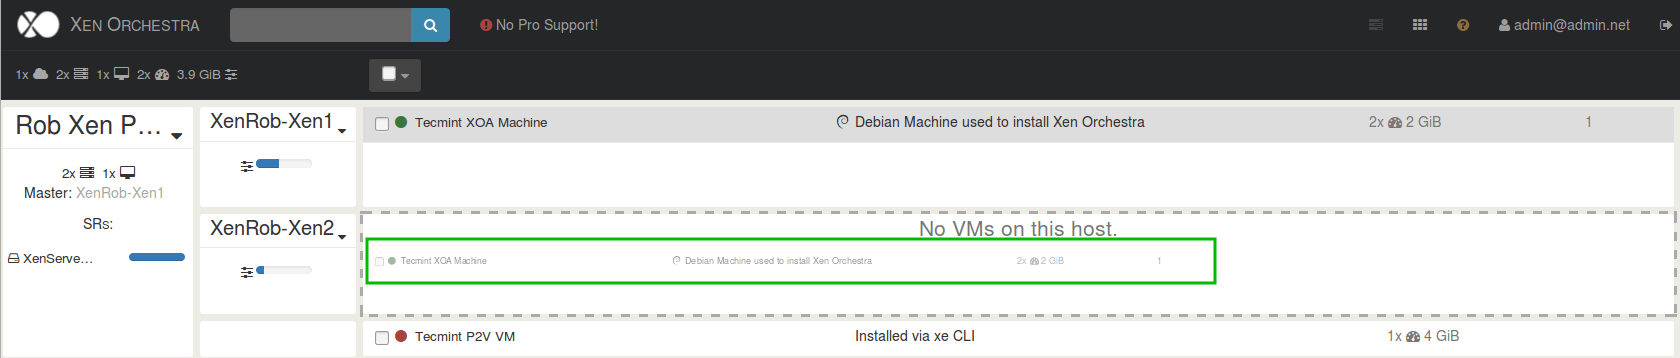
Migrate XenServer VM’s in Xen Orchestra
Xen Orchestra provides a respectable amount of functionality and flexibility with the added bonus that it allows administrators to manage XenServer hosts from any machine with a web browser thus making it an ideal choice for administrators who also use Linux.
To read about more of the benefits and abilities of Xen Orchestra, please visit the administration manual located here.
Other Alternatives for XenServer Management
XenServer is very easily managed through graphical applications as well as the command line. Management of hosts is even easier once the hosts are pooled as the pool master will manage many of the configurations of the other pool members for the administrator.
For those administrators who use Linux systems, sometimes booting a Windows machine is excessive for the purposes of connecting to a running guest.
As mentioned in the XenServer guest creation article, XenServer does have the ability for administrators to connect to the running guests via an SSH tunnel.
The author takes advantage of this functionality quite often and has written a script to help automate this process so there is no need for a Windows virtual machine for XenCenter.
This script allows an administrator to connect to a XenServer host, obtain a list of guests on the host, and then sets up a SSH tunnel and VNC connection to that running guest.
The script helps to alleviate any issue that may occur should the guest loose network connectivity and thus the ability to be managed remotely. Since the VNC session is done through the XenServer host itself, as long as the administrator’s machine can reach the XenServer, a console session to the guest will be available.
The script has been tested for a couple of months but any suggestions, optimizations, or issue reports would be greatly appreciated should a reader locate any issues.
The administrator can launch this BASH script in one of two ways (the following instructions assume that the script is in the current directory).
$ wget https://www.tecmint.com/wp-content/scripts/XenVNC - BASH script download
$ chmod u+x XenVNC;  ./XenVNC – Method 1
$ bash XenVNC – Method 2
Upon launching the script, the script will prompt for the necessary information for the XenServer(s) to connect to in order to obtain a list of virtual guests.
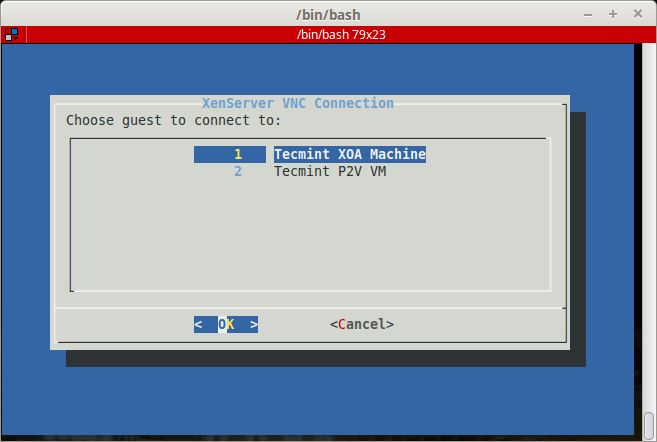
XenServer VNC Connection
Once a guest is selected, a SSH tunnel will be created to the proper XenServer host and a console session to the guest will be created through xvncviewer.
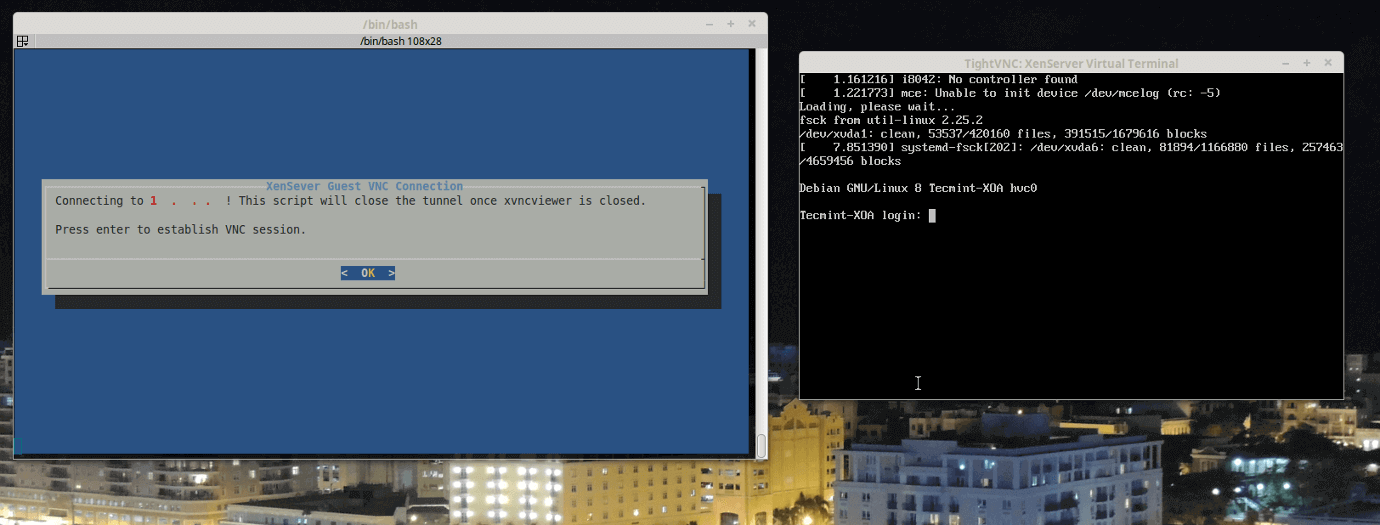
XenServer Host Console Over VNC
The management of XenServer hosts and virtual guests is made much easier through the use of available tools. The Citrix approved XenCenter utility works wonderfully but for those administrators not running Windows, Xen Orchestra provides a clean web based method for managing XenServer hosts and XenServer guests.
For those simply looking to quickly connect to the console session of a running guest, the included BASH script will quickly setup a connection to the guest through an SSH tunnel to the XenServer host actually running the virtual guest.
Fresh Installation of XenServer 7
In earlier articles, XenServer 6.5 configuration and usage was discussed. In May 2016, Citrix released the new version of the XenServer platform. Plenty has remained the same but there are also some useful new additions to this latest release.
One of the biggest changes is the upgrade to the underlying Dom0 environment. XenServer 6.5 was using CentOS 5.10 and the new release of XenServer 7 Dom0 has been updated to CentOS 7.2. This has brought about a newer Linux kernel in Dom0 as well as ease of future upgrade abilities within CentOS 7.
Another big change occurred to the partitioning done for Dom0. Older releases of XenServer relied upon MBRand a rather small root partition (4GB). Subsequently, many users likely experienced issues where logs would routinely fill up the root partition if not monitored or exported to an external log mechanism.
With the new release, the partitioning scheme has changed to GPT as well as a more logical partitioning has been performed. The chart below is fully credited to the official Citrix release information:
- 18GB XenServer host control domain (dom0) partition
- 18GB backup partition
- 4GB logs partition
- 1GB swap partition
- 5GB UEFI boot partition
These changes do require larger hard drive requirements for Dom0 compared to older versions of XenServer but the scheme does alleviate several issues experienced in older versions.
The next notable upgrade in XenServer 7 is the actual upgrade from Xen 4.4 to Xen 4.6. Xen is the actual hypervisor portion of XenServer.
The list of fixes and enhancements is quite large but some of the highly noted enhancements from Citrix include agentless anti-malware introspection for guests as well as frameworks that can allow guests to be migrated between CPU’s of different generations.
There are many other enhancements seen in this upgrade and the author strongly encourages viewing the lists and associated documents on Citrix’s website:
- https://www.citrix.com/products/xenserver/whats-new.html
DISCLAIMER
The purpose of this article is to walk through a fresh install as well as assist administrators with the process of upgrading older XenServer installs to the newer XenServer 7 and applying critical patches.
- Fresh Install of XenServer 7
- Upgrading XenServer 6.5 to XenServer 7
- Applying XenServer 7 Critical Patch
There are several ways to do the upgrading process and the ‘right’ solution for any particular install will be highly dependent on the organization. Please be sure to understand the implications and processes required for a successful upgrade.
Citrix has released a very detailed document that should be reviewed before the upgrade process is started: xenserver-7-0-installation-guide.pdf
XenServer System Requirements
- XenServer 7 ISO : XenServer-7.0.0-main.iso
- Server capable of virtualization
- Hardware Compatibility List is here: http://hcl.xenserver.org/
- Many systems will work even if not listed but results may vary, use at your own risk.
- Minimum 2GB ram; 4GB or more recommended to run virtual machines
- Mimimum 1 64-bit x86 1.5GHz cpu; 2GHz or more and multiple CPUs are suggested
- Harddrive space of at least 46GB; more required if virtual machines will be saved locally
- At least a 100mbps network card; multiple gigabit suggested
Author Suggested Additions
In order to save some potential headaches for readers, the author recommends the following items before beginning this process:
- Update the firmware on the XenServer system (especially NIC firmware) – more later
- Stop all non-essential guests to prevent issues
- Read through Citrix’s documentation as well as this article before beginning
- Make sure to back up pool information in order to make a revert easier if needed
- Restart all the XenServer hosts one more time after all steps have been completed if the environment can afford the reboot time
Single Host Upgrade and Fresh Install of XenServer 7
This first process will walk through a completely new install of XenServer 7. Be sure to check the minimum hardware requirements to ensure that the machine can support XenServer 7.
1. The first step in the installation is to download the XenServer ISO file. Using the link above, the file can easily be downloaded from the Internet using the ‘wget’ command.
# wget -c http://downloadns.citrix.com.edgesuite.net/11616/XenServer-7.0.0-main.iso
Once the ISO has downloaded, copy it to a USB drive with the ‘dd’ utility. CAUTION – The following command will replace EVERYTHING on the flash drive with the contents of the XenServer ISO. This process will also create a bootable USB drive for the installation process.
# dd if=XenServer-7.0.0-main.iso of=</path/to/usb/drive>
2. Now place the bootable media into the system that XenServer should be installed. If the bootable media creation step was successful, the system should display the XenServer splash screen.
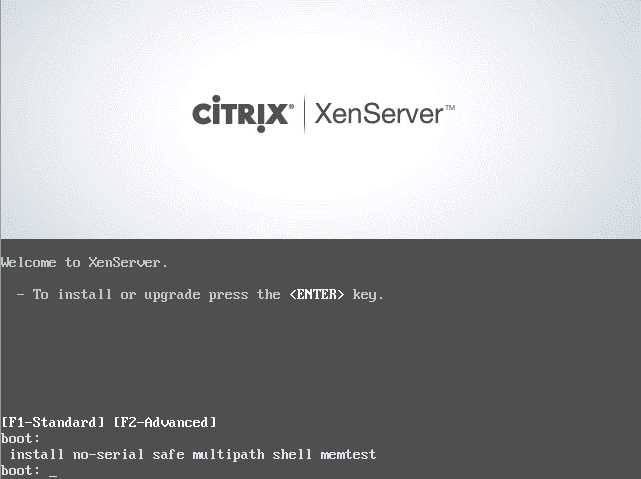
XenServer 7 Boot Screen
3. From this screen, simply hit enter to boot into the installer. The first screen, once the installer has started successfully, will ask the user to select their language.
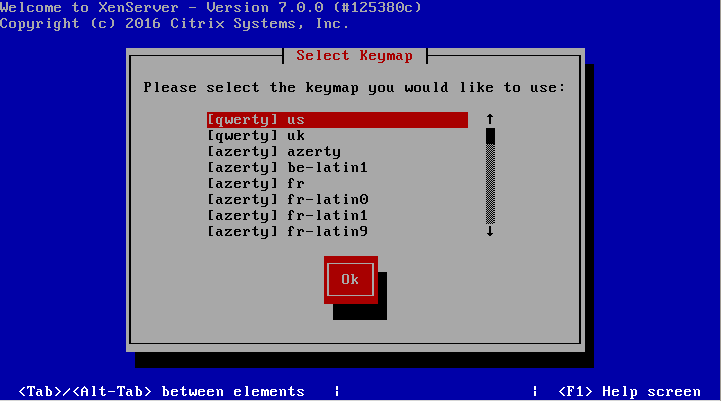
Select XenServer-7 Installation Language
4. The next screen will ask the user to confirm that an upgrade or install should be done as well as ask for any other special drivers that may need to be loaded in order to install XenServer.
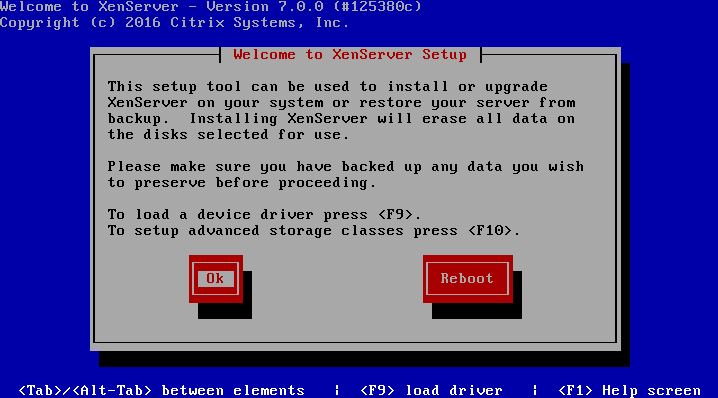
XenServer 7 Install or Upgrade Setup
5. The next screen is the obligatory EULA (End User License Agreement). Use the keyboard arrows to move the cursor to the ‘Accept EULA‘ button.
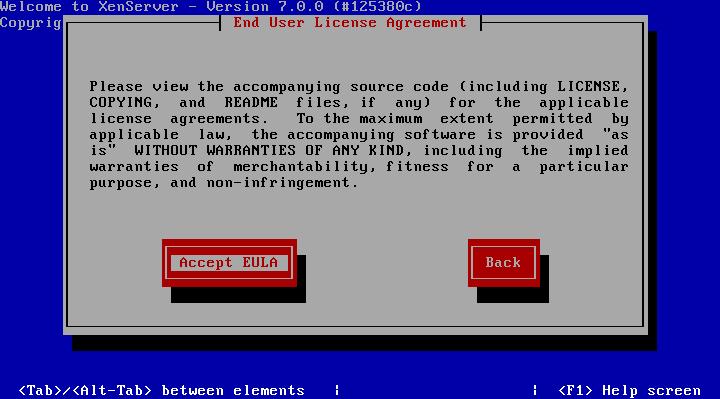
XenServer 7 Accept License
6. This is where the installation can take one of two paths if the installer detects a prior install. The next screen will prompt the user for a clean install or an upgrade to an existing XenServer install. The first set of instructions here will walk through a clean install. If an upgrade is needed skip ahead to step 15.
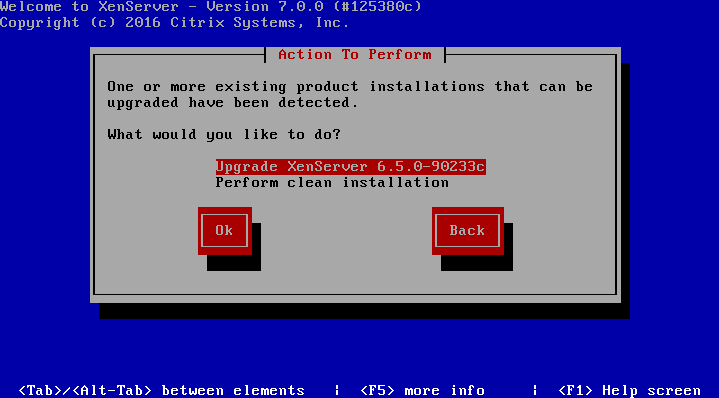
XenServer 7 Install or Upgrade Selection
7. The next screen will prompt for the installation device. In this case it will be ‘sda’.
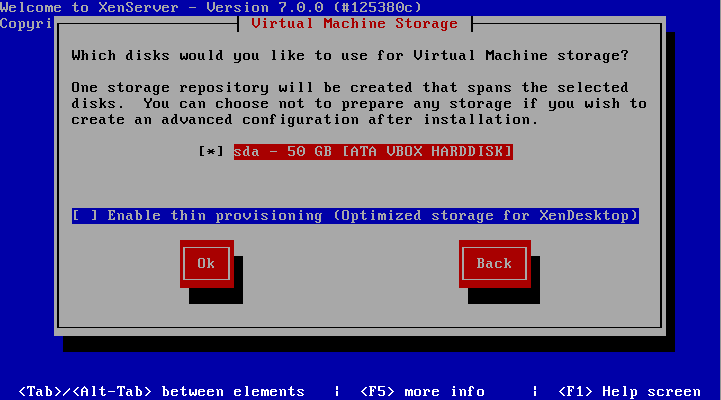
Select XenServer 7 Installation Drive
8. Once the installation path has been chosen, XenServer will need to know where the installation files reside. In this case, the installer was booted from local media and that is the option that should be chosen.
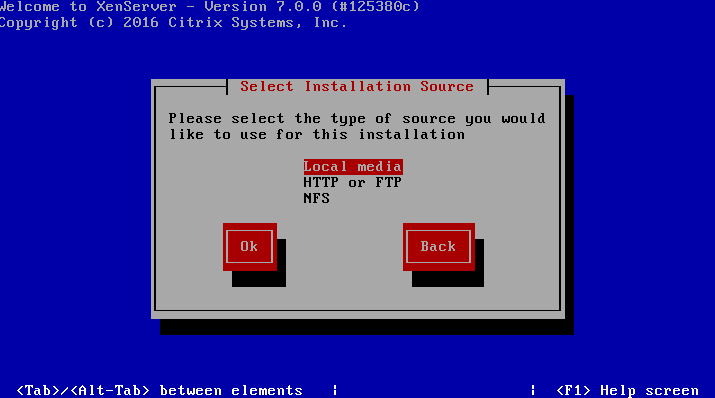
Select XenServer 7 Installation Source
9. The next step will allow the user to install supplemental packs at the same time as this installer. At the time of this writing, there aren’t any supplemental packs for XenServer 7 so ‘no’ can be selected here.
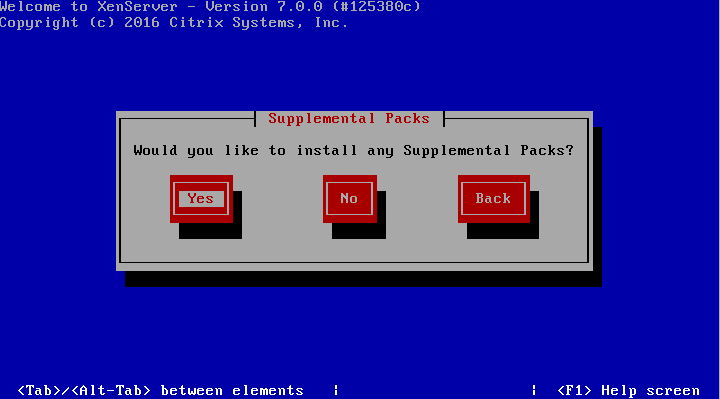
Select XenServer 7 Supplemental Packs
10. The next screen will allow the user to confirm the integrity of the source files before installing. Running this test is not required but can help detect installation issues before trying to write files.
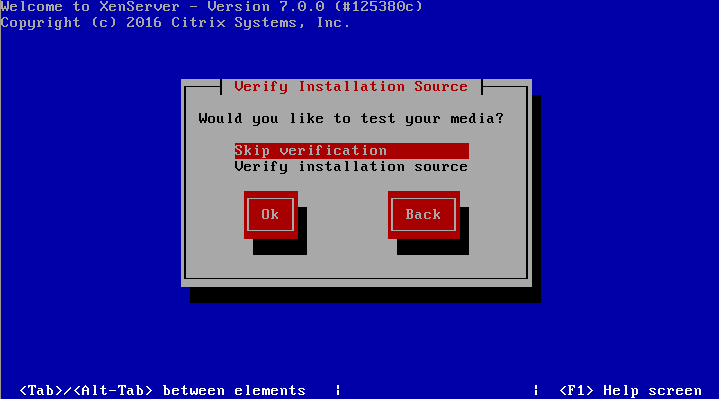
Verify XenServer 7 Installation Source
11. Once the verification is completed, if selected during install, the XenServer installer will ask the user to setup some system information.
The first prompt will be to set the root user’s password. Now, since XenServer will be the underlying system to potentially several important virtualized servers, it is imperative that the password be secured as well as sufficiently complex!
Important: Do not forget this password either as there will not be any other users on the system once the installer finishes!
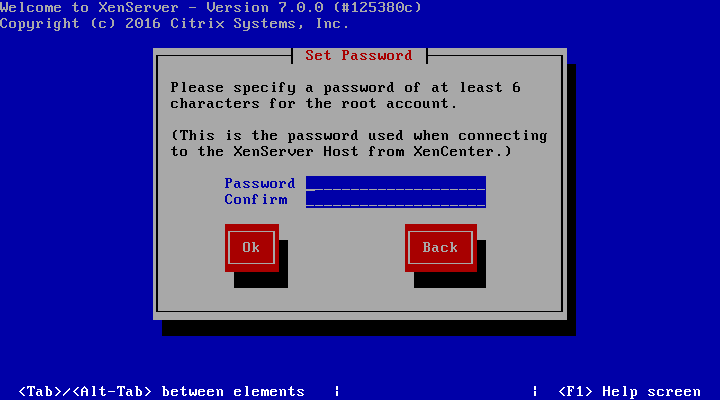
Set XenServer 7 Root Password
12. The next couple of steps will ask how the management network interface should be configured (Staticaddress or DHCP) as well as hostname and DNS information. This will be dependent on the environment.
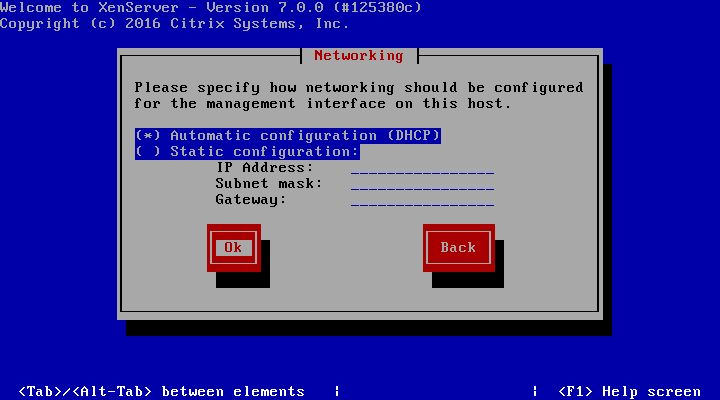
Select XenServer 7 Networking
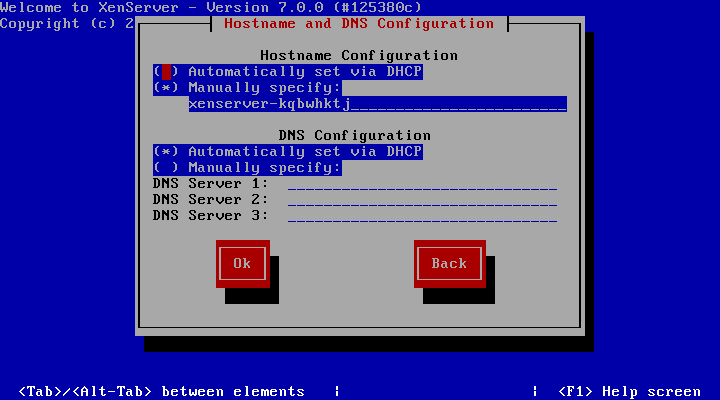
Set XenServer 7 Hostname and DNS
13. This step covers several screens for setting time zone information and NTP (Network Time Protocol).
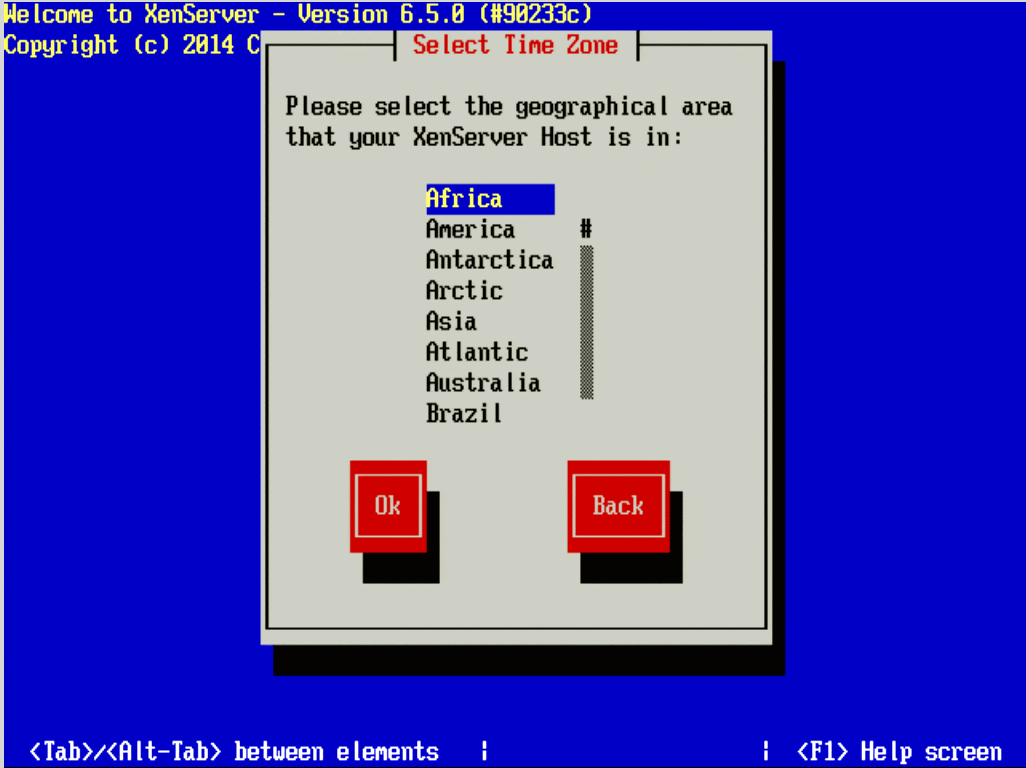
Select XenServer 7 Timezone
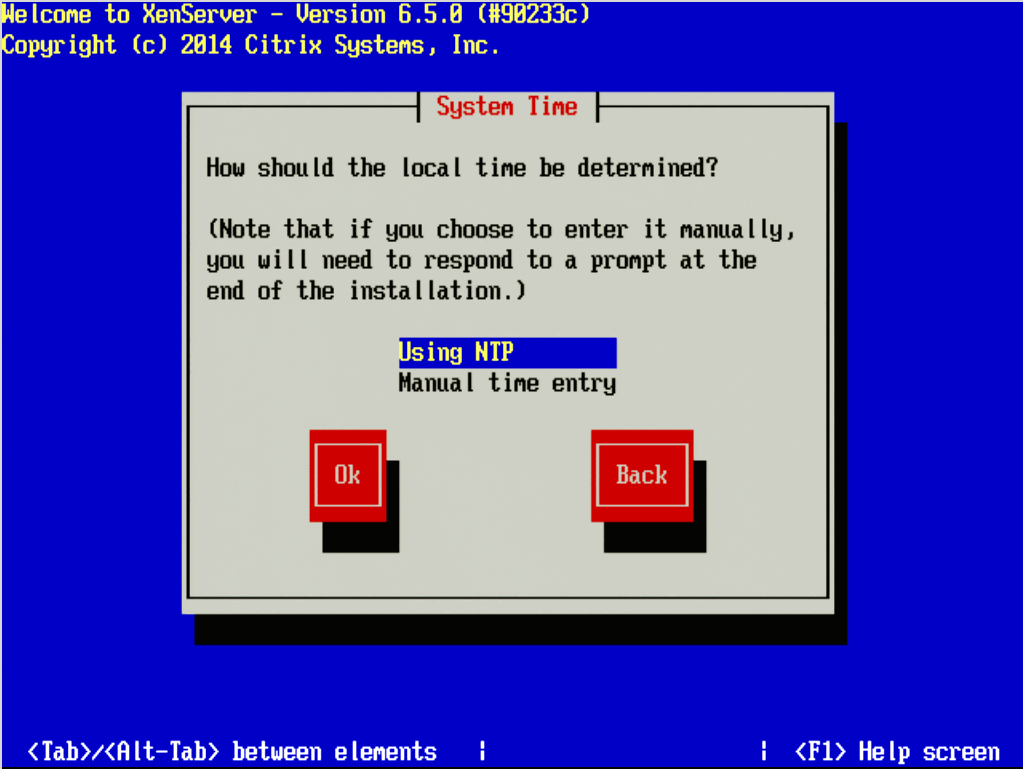
Set XenServer System Time
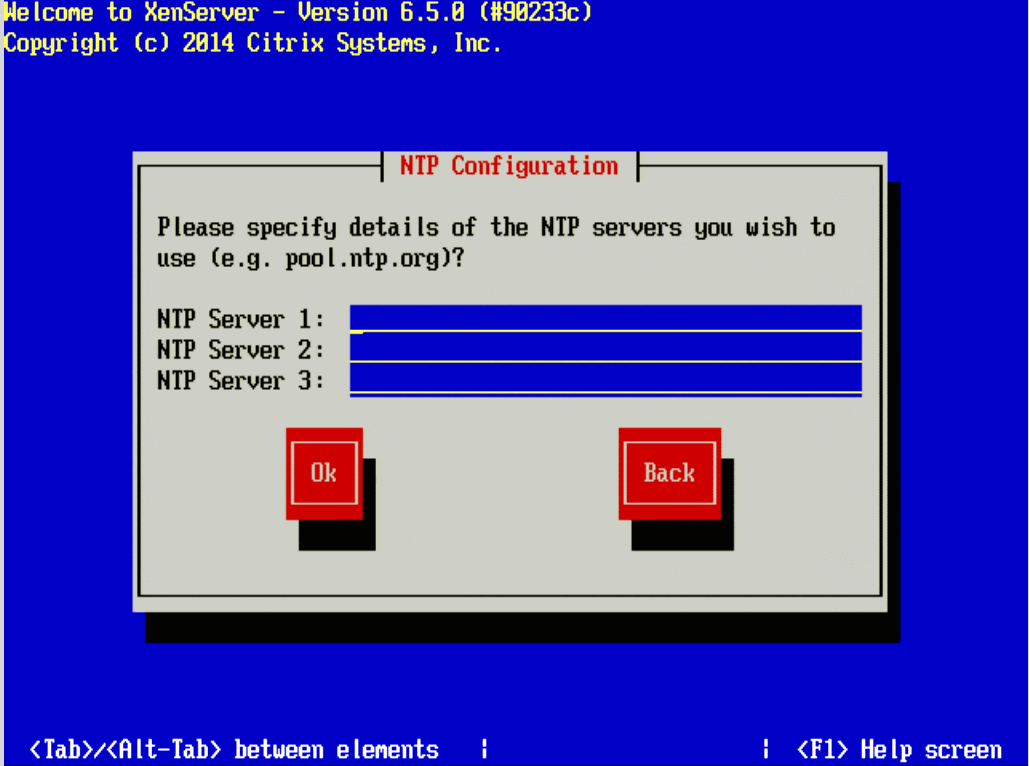
Configure NTP for XenServer 7
14. At this point in the installer, all of the initial configuration information for a clean install has been provided and the installer is ready to install all the necessary files.
WARNING – Continuing at this point WILL ERASE ALL DATA on the target disks!
Continue to step 19 after selecting ‘Install XenServer‘.
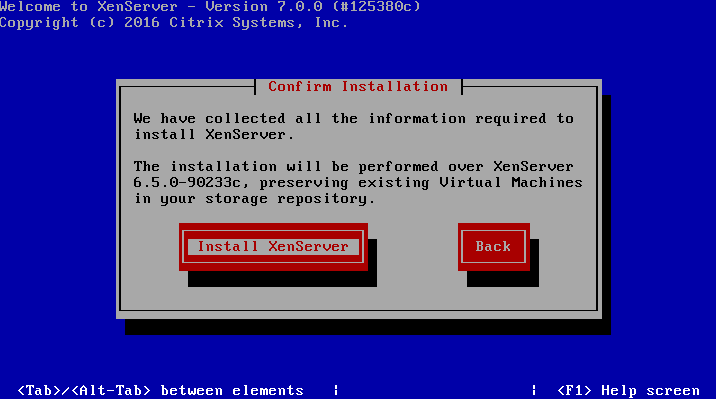
Confirm XenServer 7 Installation
Upgrading XenServer 6.5 to XenServer 7
15. These steps are only used if performing an upgrade to an older version of XenServer. The installation media will locate older versions of XenServer if the user wishes. When doing an upgrade, the installer will create a backup of the current system automatically.
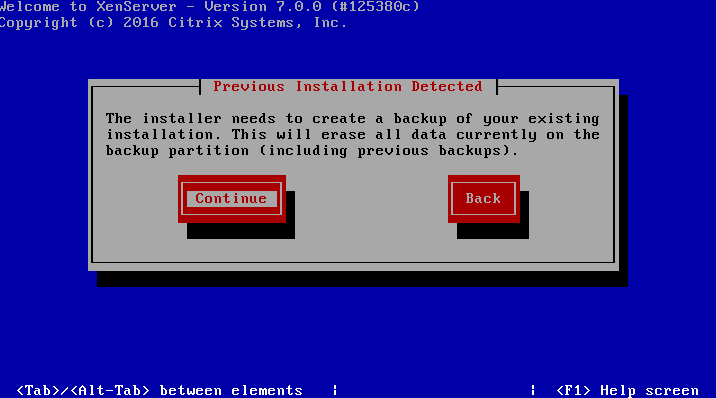
Previous XenServer Installation Detected
16. Once the back up is created, the installer will prompt for supplemental packs. At the time of this writing, there aren’t any supplemental packs for XenServer 7.
Select XenServer 7 Supplemental Packs
17. The next screen will allow the user to confirm the integrity of the source files before installing. Running this test is not required but can help detect installation issues before trying to write files.
Verify XenServer 7 Installation Source
18. Finally the upgrade can begin! At this point the installer will backup the older 6.x system and make the appropriate changes to setup XenServer 7.
Confirm XenServer 7 Installation
Continuing XenSever 7 Installation
19. One of the most obvious changes the author noted with the newer XenServer 7 is that boot times seemed to have been drastically reduced. Most of the XenServer 7 Systems tested so far have booted approximately 35-60% faster than they did when running XenServer 6.5. If the installation was successful, the system should boot to the XenServer console.
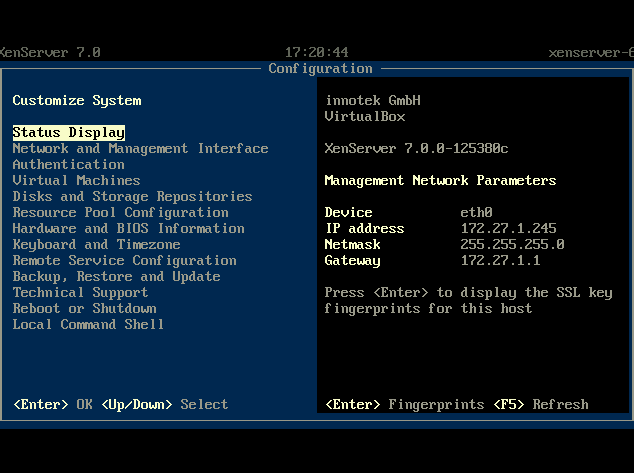
XenServer 7 Configuration Console
Congratulations, the installation/upgrade of XenServer was successful! Now it is time to create virtual guests, networking, and storage repositories!
Applying XenServer 7 Critical Patch XS70E004
20. To apply this patch through XenCenter, simply go to the ‘Tools’ menu and select ‘Install Update’.
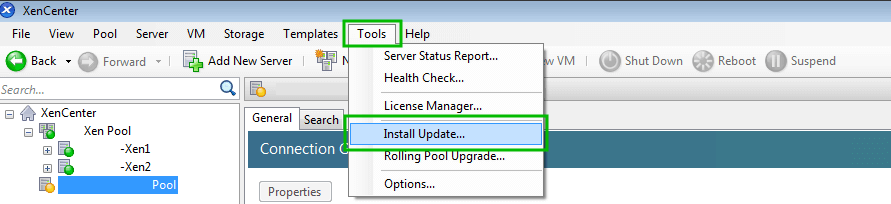
Install XenCenter Patch
21. The next screen will provide some information about the patch installation process. Just click next to continue after reading the precautions.
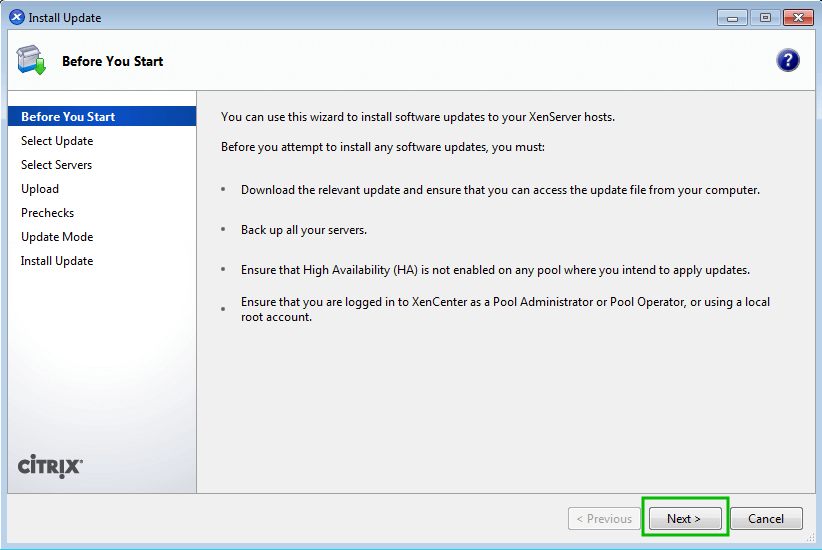
XenCenter Patch Information
22. XenCenter, if connected to the Internet, will be able to locate any missing patches for the environment on this screen. At the time of this article the only patch available is ‘XS70E004’. This patch should be applied IMMEDIATELY following the upgrade or installation of XenServer 7.
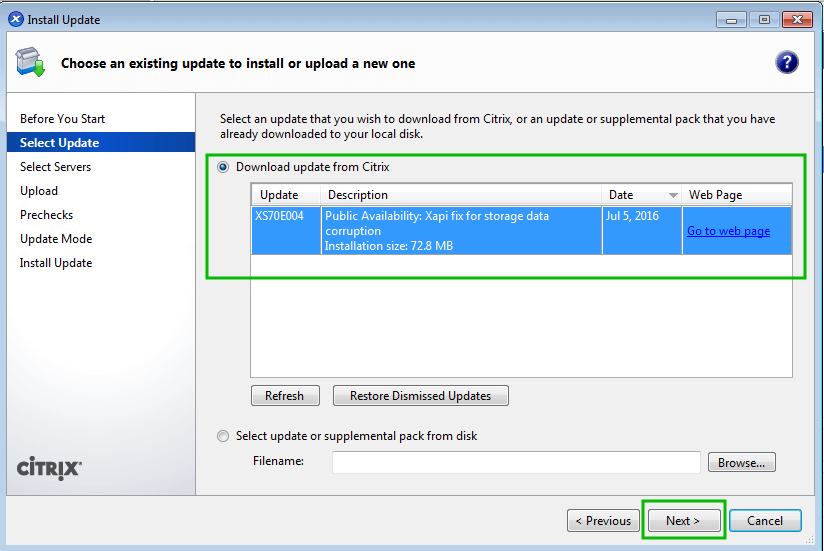
XenCenter Patch Update
23. The next screen will prompt for the XenServer hosts to apply the patch to.
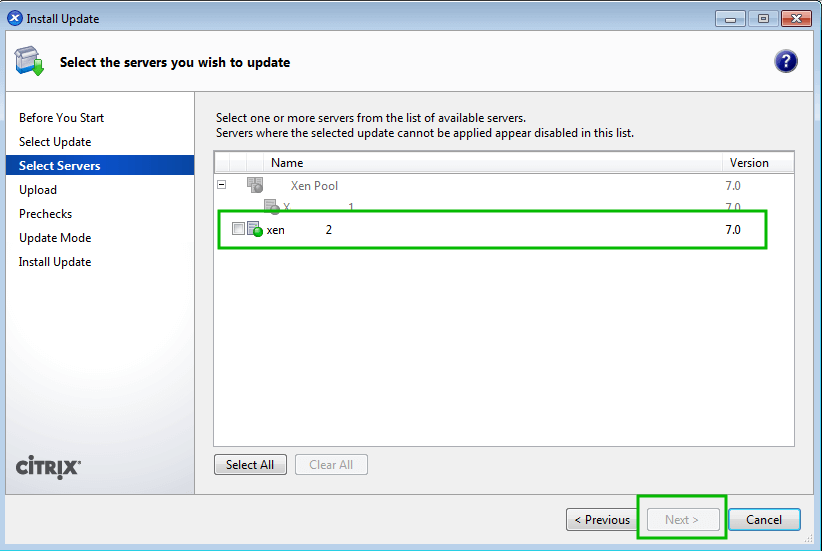
Apply XenCenter Patch
24. After clicking ‘next’ XenCenter will download the patches and push them to the selected servers. Simply wait for this process to complete and select ‘next’ when applicable.
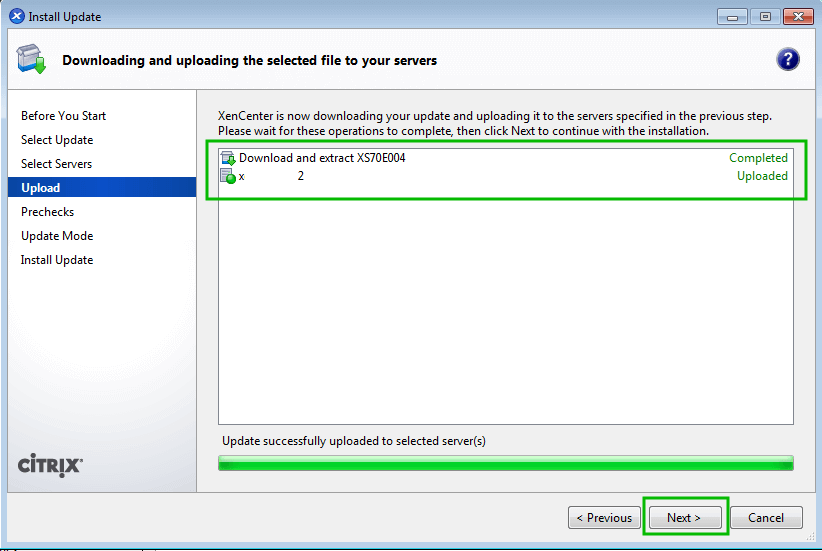
Download XenCenter Patch
25. With the patch files uploaded, XenCenter will run a series of checks to ensure that certain conditions are met before the installation of the patches and the rebooting of hosts.
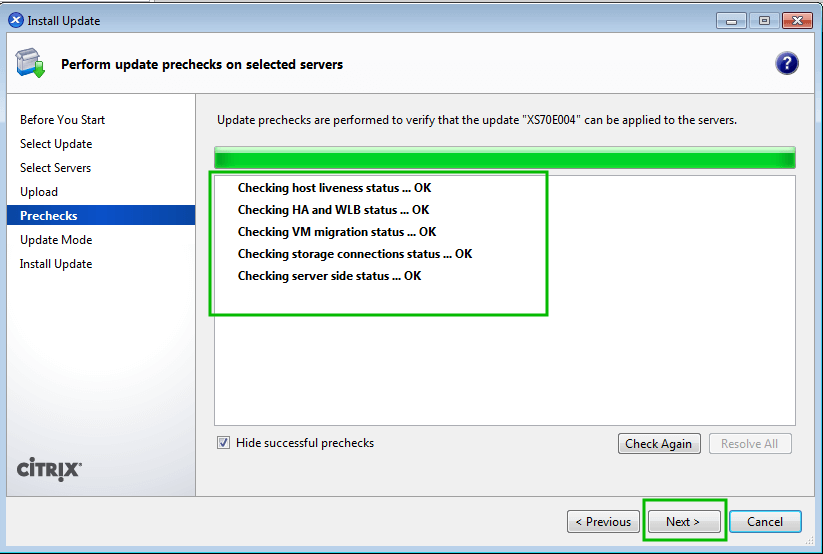
Checking XenCenter Patch
25. Once all of the pre-checks are completed, XenCenter will prompt the administrator as to how post install tasks should be handled. Unless there is a compelling reason not to, allowing XenCenter to carry out these tasks is usually the best answer.
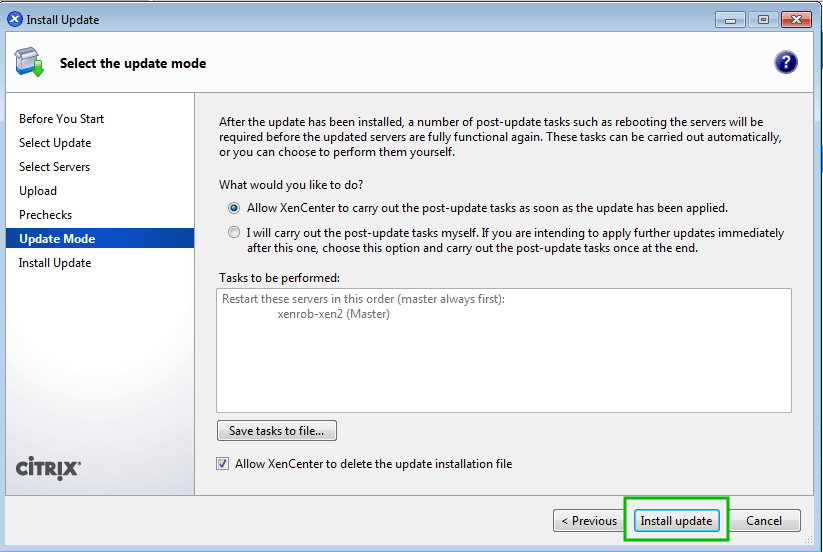
Apply XenCenter Patch Updates
26. The next screen will display the progress of the patch installation and alert the administrator of any errors experienced.
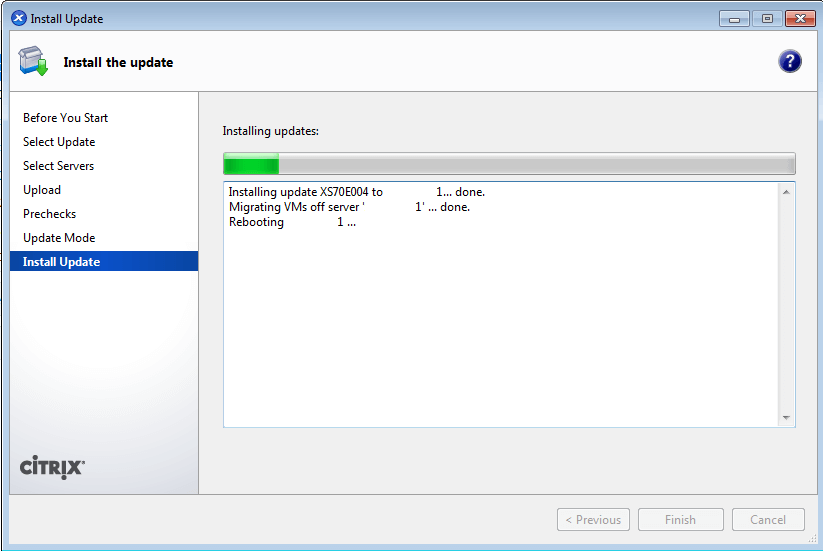
Installing XenCenter Patch Updates
This concludes the process of patching XenServer 7 hosts. The next step is to start creating virtual guests! Thank you for reading this XenServer 7 install article.
Don’t Miss: XenServer 7 – Pool Upgrade via CLI and XenCenter Web Interface
XenServer 7 – Pool Upgrade via CLI and XenCenter Web Interface
The first article in this XenServer 7 Series covered how to install/upgrade a single XenServer host. Most XenServer installs are likely to be in a pool of many XenServer hosts.
This article will cover the process of an entire XenServer pool upgrade. The final component will cover some house keeping with the guests running on the XenServer hosts.
System Requirements
- XenServer 7 ISO : XenServer-7.0.0-main.iso
Before moving further, I suggest you to check out these two sections System Requirements and Author Suggested Additions in our first article of Xen Server 7 at:
- Fresh Installation of XenServer 7
DISCLAIMER
The purpose of this article is to walk through a XenServer pool upgrade. There are number ways to do the upgrading process and the ‘correct’ solution for any specific install will be strongly dependent on the organization.
Citrix has a very detailed document that should be reviewed before the upgrade process is started: xenserver-7-0-installation-guide.pdf
XenServer Pool Upgrade
Undoubtedly most XenServer installs are likely part of a pool of XenServers. This complicates the upgrade process a little bit. While the option to manually go to each server and upgrade each one is an option, Citrix has a much easier way to do this through the use of a Rolling Pool upgrade through the newest version of XenCenter or through the 'xe' command line tool.
According to Citrix’s documentation a pool upgrade can be performed on any version of XenServer 6.x or higher to version 7. If a XenServer host is running a version older than 6.x, then the host needs to follow the appropriate upgrade path to XenServer 6.2 and then can be upgraded to XenServer 7.0.
In order to do the Rolling Pool upgrade, the newest version of XenCenter needs to be downloaded from Citrix. The download can be located here: XenServer-7.0.1-XenCenterSetup.exe
As mentioned in the XenServer 6.5 series, XenCenter is still a Windows only utility. The pool upgrade can be done via the CLI as well for those who may not have access to a Windows machine to run XenCenter.
This article will detail out both methods (XenCenter and CLI with the xe utility).
NOTE – Before doing a pool upgrade, two things should be noted. The rolling pool upgrade should not be done with boot from SAN setups and Integrated StorageLink has been removed from XenServer versions 6.5 and higher.
Regardless of which method is used, XenCenter or CLI, the first step is to disable pool high availability, stop all non-essential guest virtual machines, ensure that XenServer hosts have enough memory to support the guests that need to continue running during the upgrade (ie. not over-provisioned), hosts also need enough hard drive space for XenServer 7, ensure that the cd/dvd drives for all guests are empty, and it is strongly encouraged that a backup of the current pool state be done.
Let’s begin the process.
Pool Upgrade from the CLI
1. Make sure that you have read the prior 5 paragraphs as they outline some very important information to the upgrade process! It is also highly recommended that users read the installation guide located here: xenserver-7-0-installation-guide.pdf, The instructions and warnings for upgrading start on page 24.
2. The actual first technological step is to back up the pool status with the 'xe' tool. Using a SSH connection to the Xen pool master host, the following ‘xe’ command can be run.
# xe pool-dump-database file-name="Xen Pool.db"
With the database backed up copy the file off the master host to ensure a copy is available in the event that the upgrade fails. The following command will copy the file Xen Pool.db from the remote XenServer identified by <XenServer_ip> and place the file in the current user’s Downloads folder.
# scp 'root@<XenServer_ip>:~/”Xen pool.db”' ~/Downloads/
3. Once the pool database has been backed up, the master needs to have all guests migrated to other hosts in the pool and then the master needs to be disabled with the following ‘xe’ commands:
# xe host-evacuate host=<hostname of master>
# xe host-disable host=<hostname of master>
Now the host needs to be rebooted from the XenServer 7 installation media locally. At this point the upgrade follows many of the same parts as single host upgrade earlier in this article.
Make absolutely certain that UPGRADE is chosen when moving through the installer steps! For clarity’s sake, at this point, steps 1-6 and then 15-19 in the “XenServer 7 – Fresh Install” article should be accomplished at this stage.
The installation process takes about 12 minutes so navigate to https://www.tecmint.com to read another article while waiting for the install to finish. Once the install is complete, reboot the master and remove the installation media.
4. As the master is rebooting make sure that it doesn’t display any errors and that it boots up to the XenServer console screen. This is a good indication of a successful upgrade but things aren’t done yet. SSH back into the master system and verify that it is indeed running the new version of XenServer with either of the following commands:
# cat /etc/redhat-release
# uname -a
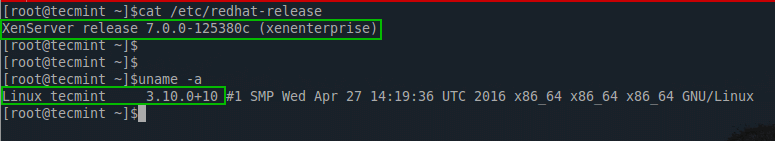
Check XenServer Version
5. Success! This pool master has now been upgraded. At this point, move any guests to this host as needed and proceed to the next XenServer host by repeating step three except replacing the hostname of the next host to upgrade.
# xe host-evacute host=<hostname of pool slave>
# xe host-disable host=<hostname of pool slave>
6. Continue steps 3 through 5 for the remaining slaves in the pool.
7. At this point it is CRUCIAL to apply one more update. Citrix released a patch to address issues were data loss and corruption were possible under certain circumstances.
PLEASE APPLY THIS PATCH NOW! This patch requires the XenServer hosts to be rebooted as well. Instructions for accomplishing this through XenCenter are located later in this article.
To accomplish this through the CLI of a XenServer host, download the patch and issue the following ‘xe’commands:
# wget -c http://support.citrix.com/supportkc/filedownload?uri=/filedownload/CTX214305/XS70E004.zip
# unzip XS70E004.zip
# xe patch-upload file-name=XS70E004.xsupdate
# xe patch-apply uuid=<UUID_from_above_command>
# xe patch-pool-apply uuid=<UUID_from_above_command> - only applies to a XenServer pool and must be run from the pool master
8. Once all of the hosts in the pool have been updated, the guests will need to have XenServer Guest Tools updated. Steps to accomplish this are at the end of this article.
Pool Upgrade from XenCenter
For those who have access to a Windows machine to run XenCenter, a Rolling Pool upgrade can be accomplished through the XenCenter application.
The benefit of using XenCenter is many of the tasks and checks that needed to be done manually in the prior instructions, will now be handled automatically by XenCenter.
The rolling pool upgrade wizard in XenCenter has two modes; manual and automatic. In manual mode, the installer for XenServer 7 must be placed into each individual XenServer host at the time it is being upgraded (ie. a bootable usb or cd).
When using the automatic mode, the wizard will use files located on some sort of a network file share such as HTTP, NFS, or FTP server. To use this method, the installation files from the XenServer install iso must be unpacked on the appropriate networked file server and made accessible to the XenServer hosts.
This guide won’t detail out the process of setting up an HTTP server but it will walk through the process of extracting the ISO contents to allow for an automatic upgrade.
Extracting XenServer Install Files to HTTP Server
This section will assume that the user has a functioning HTTP server with a web root set to ‘/var/www/html‘. This section will also assume that the XenServer 7 iso file has been downloaded and resides in the web root folder.
The first step to setting up the install files for this article is to mount the iso, so the installer files can be placed into the webroot. The second step is to create a folder for the installer files and then copy the files into that folder.
All of the steps can be accomplished as follows:
# mount XenServer-7.0.0-main.iso /mnt
# mkdir /var/www/html/xenserver
# cp -a /mnt/. /var/www/html/xenserver
At this point, navigating to the server’s IP address and the xenserver folder, the installation materials should display in browser.
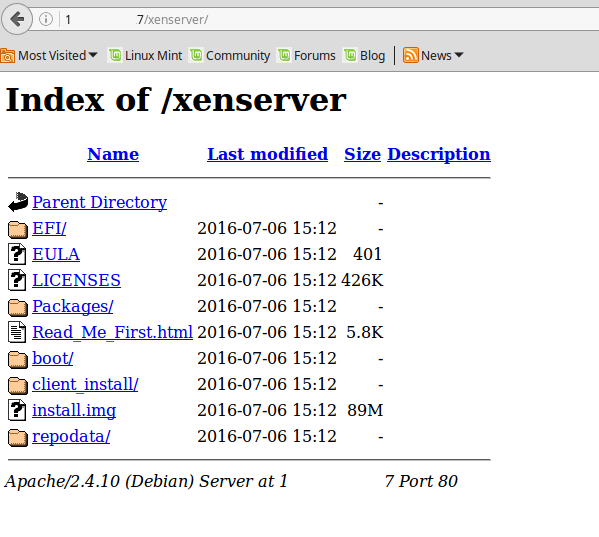
XenServer Installation Files
Rolling Pool Upgrade with XenCenter
1. The first step is to re-read the paragraphs underneath the XenServer Pool Upgrade heading earlier in this document! This is extremely important as those paragraphs will detail out specifics about the upgrade to help the transition from older versions of XenServer.
2. The first technological step is to back up the current state of the pool by using an ‘xe’ command from the pool master. Using a SSH connection or XenCenter console to the Xen pool master host, the following ‘xe’ command can be run.
# xe pool-dump-database file-name="Xen Pool.db"
With the database backed up, it is strongly suggested that a copy be made off of the master so in the event of a failed upgrade, the master/pool can be reverted back to the original state.
3. Ensure that the newest version of XenCenter is installed. The download link is as follows: XenServer-7.0.1-XenCenterSetup.exe.
4. Once the pool database has been saved and the newest version of XenCenter installed, the pool upgrade can begin. Open up XenCenter and connect to the pool that needs the new version of XenServer. Once connected connected to the pool master, navigate to the ‘Tools’ menu and select ‘Rolling Pool Upgrade…’.
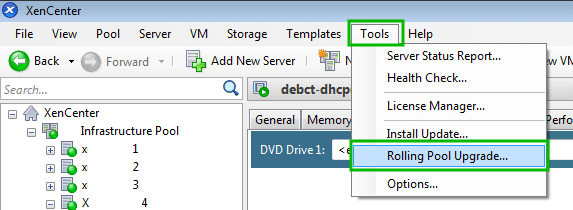
XenServer Rolling Pool Upgrade
5. Be sure to read the warnings on the first prompt. The step that is mentioned here is the pool database back up that was accomplished in step one of the “Rolling Pool Upgrade with XenCenter” section of this article.
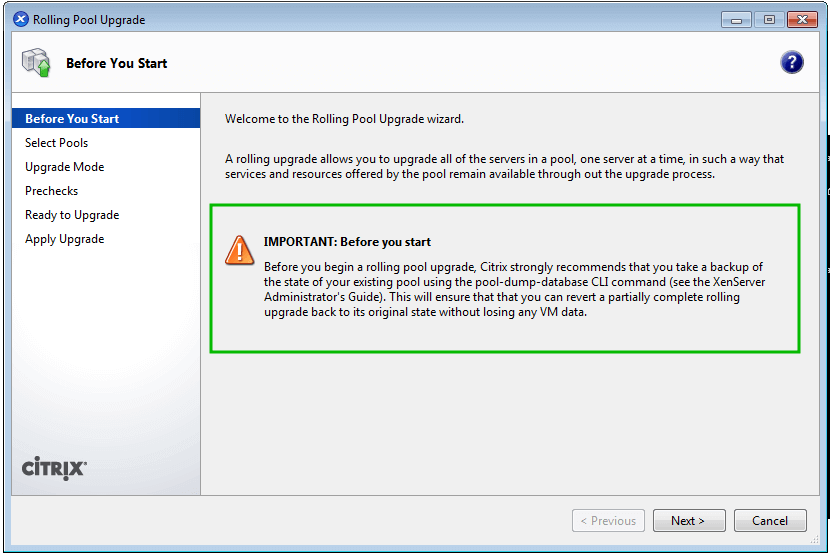
Rolling Pool Upgrade Warning
6. The next screen will prompt the user to select the pools that they wish to upgrade. Every pool that XenCenter is connected to can be selected. For simplicity’s sake, a small test pool has been used in this documentation.
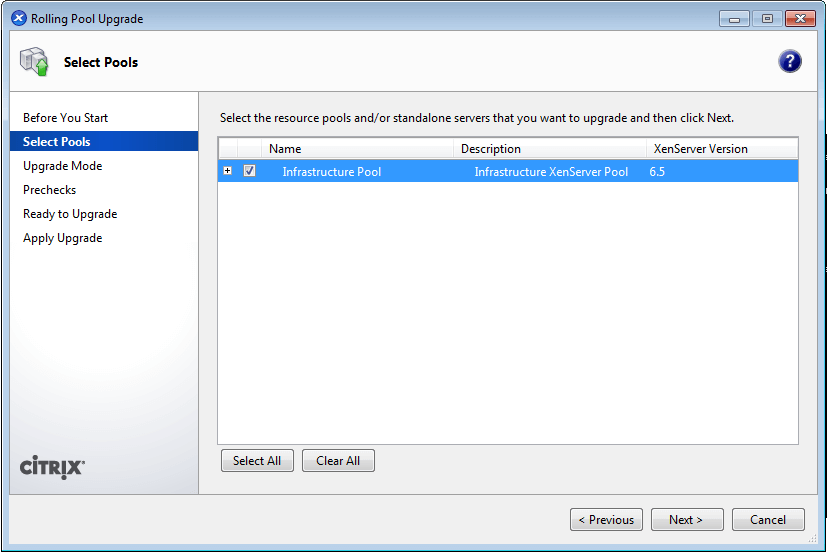
Select XenServer Pool Upgrade
7. The next step allows the user to select either ‘Automatic‘ or ‘Manual‘ modes. Again this article is walking through the automatic method and assumes an HTTP server is available and has the XenServer ISO contents extracted in a folder called ‘xenserver’ on that HTTP server.
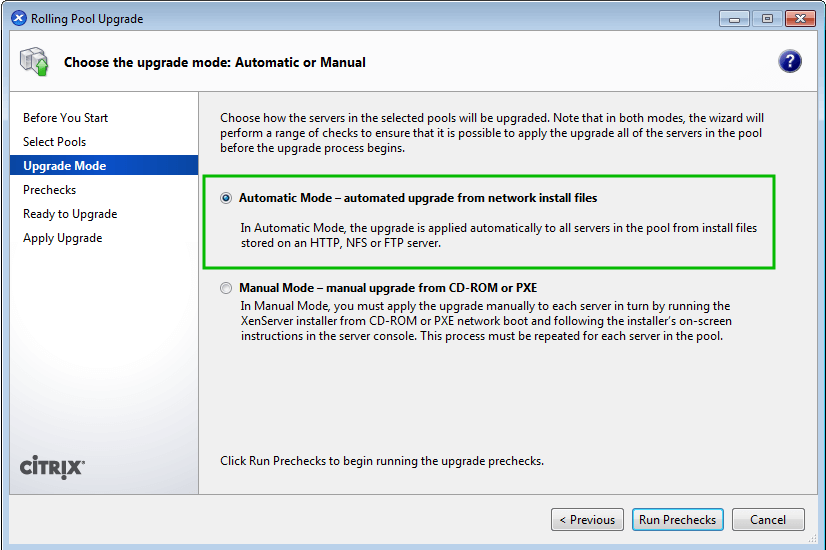
Select Automatic Pool Upgrade
8. At this point XenCenter will run through a series of checks to ensure that all hosts have the appropriate patches/hotfixes and will check to ensure that the upgrade is likely to succeed.
Depending on the environment this is likely to be the step in which problems are experienced. Two issues were encountered but the author at this point. Resolutions were found and hopefully these will help others.
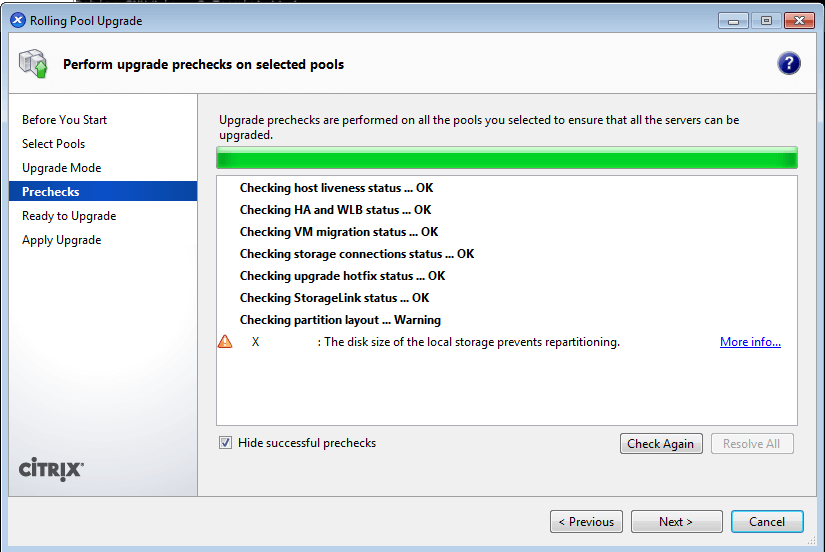
Perform Rolling Pool Upgrade Checks
The first issue experienced was the need for two patches to be applied to the XenServer hosts. XenCenter will accomplish this if the user decides to do so however as the author and others have experienced, this step doesn’t always complete properly and may prevent the next step from working properly.
If XenCenter claims that all patches are applied but the user receives “Invalid URL to Installer Files” on the next screen, the author was able to successfully get the error to go away by rebooting the master XenServer.
To read more about the issue, view the Citrix discussion at the following URL: XenServer 7 Invalid URL to Installer Files.
The other issue experienced at this point was a warning from XenCenter about a local VM being stored on the master XenServer host. This local VM would prevent the XenServer installer from re-partitioning the hosts with the new GPT partition scheme.
After much searching, it was noticed that a pool meta data backup was being stored on the master host’s local storage. Once this was moved to another location, the installer ceased to see any issues.
9. Once the pre-checks were out of the way, the installer will prompt for the location of the installation files. This article is utilizing an HTTP server to serve out the installation files to the XenServer hosts and as such the installer needs to be informed about the location of these files.
In the boxes, provide the necessary server path information as well as the credentials necessary to connect and then press the ‘Test’ button to make sure XenCenter can access the files. If the green check mark is displayed, then the installation media has been located and is usable.
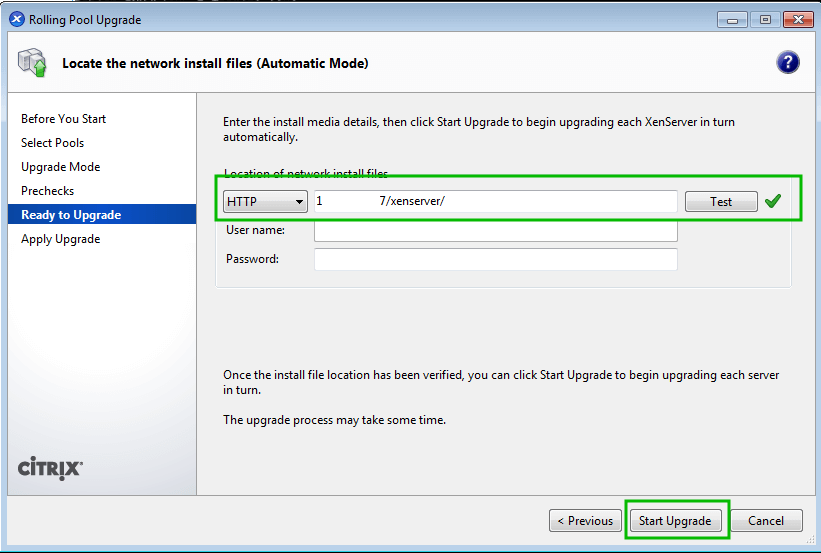
XenServer Rolling Pool Upgrade via HTTP
10. Once everything is ready to go, click the ‘Start Upgrade‘ button. This will begin the process starting with the pool master.
NOTE – Make sure that the management network for the XenServer hosts has DHCP. When the installer reboots the hosts, it will attempt to obtain an IP address via DHCP.
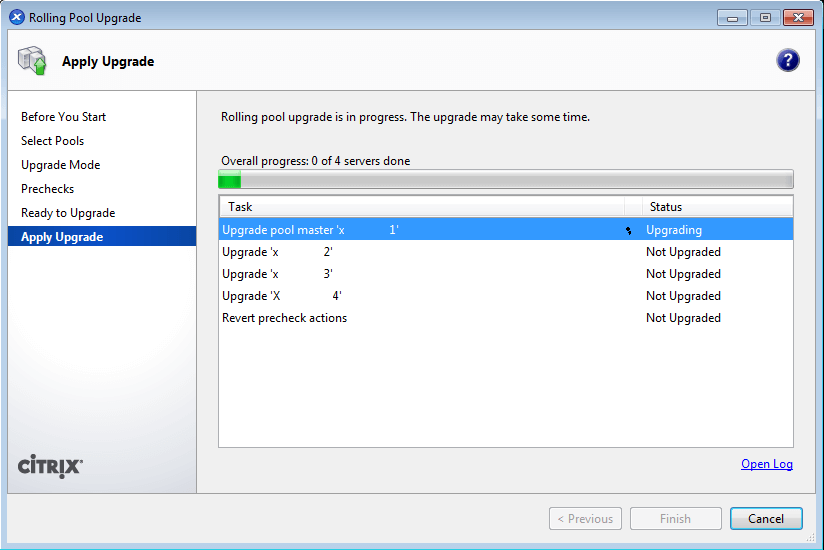
Rolling Pool Upgrade in Process
11. At this point, it would be wise to start eating lunch or follow up on other tasks. This process will take a while. If access to a local monitor or KVM system is available on the XenServer hosts, the administrator can watch the installation process and see if everything is moving along as it should.
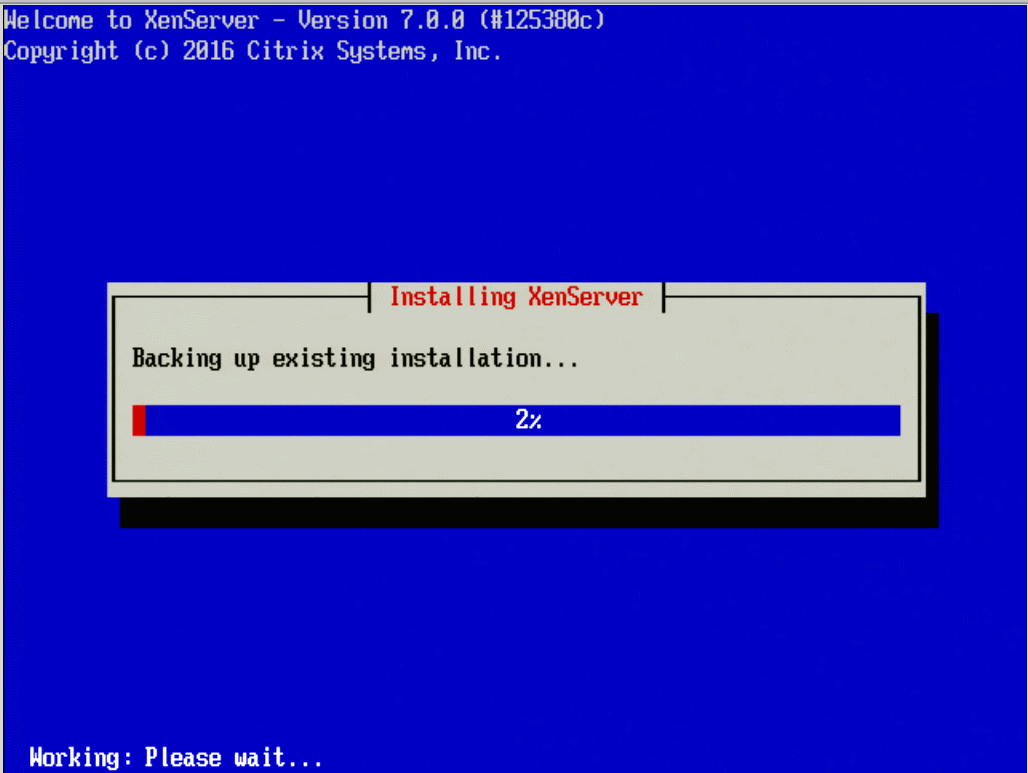
Installing XenServer Rolling Pool Upgrades
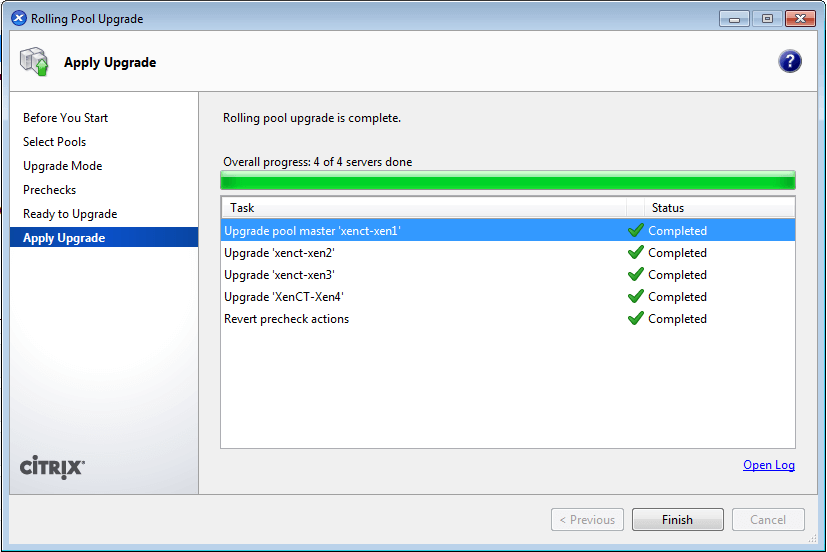
Apply XenServer Rolling Pool Upgrades
12. The installation process on this four host test cluster took approximately two hours to complete. Once the installation is complete, be sure to upgrade guest tools on all of the guests in the pool.
Also be sure to verify that the pool has been completely upgraded by looking at the pool’s ‘General‘ tab in XenCenter or by manually connecting to each XenServer host.
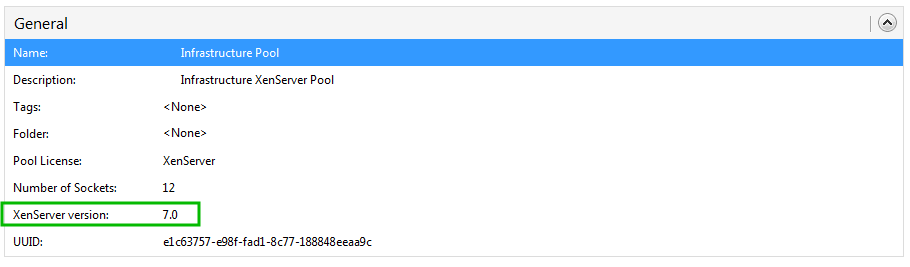
Confirm Rolling Pool Upgrades
Some follow up tasks may be necessary at this point as well. The author experienced a few issues with the virtual interfaces on some of the guests when trying to start the guests after the pool upgrade.
As it turned out some of the network configurations for the pool didn’t translate through the install process. The servers all had 4 physical interfaces (PIFs) and on two of the servers one pair of the PIFs ceased to activate upon boot-up.
This caused a substantial amount of grief but thankfully other’s had experienced similar issues and a solution was easy to come by. The servers in question were Dell Power Edge 2950’s with integrated Broadcom BCM5708 NICs.
All that was needed was to revert the systems back to XenServer 6.5 and then apply the update from Dell’s website. The author strongly suggests ensuring that all firmware updates have been applied to any systems that will be upgraded to the newer XenServer release to help prevent issues.
To read more about this topic, please review the topic on Citrix’s discussion page: XenServer 7 Upgrade No Onboard Network.
The original issue before upgrading firmware on the BCM5708 NICs
Note the firmware version as well as the out of order PIF assignment.
# interface-rename -l
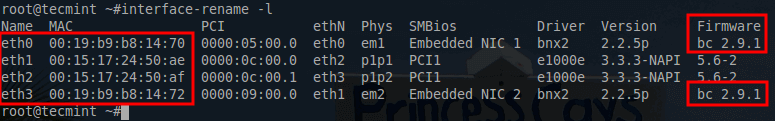
Check Network Firmware
The corrected firmware and PIF re-assignment using interface-rename utility
Note the firmware has been updated and the PIF order is correct as well.
# interface-rename -l
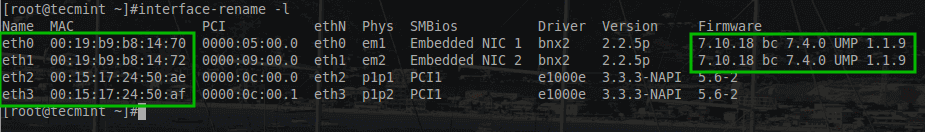
Updated Network Firmware
13. At this point, all the XenServer hosts should be available and back in the proper pool configuration. At this point it is CRUCIAL to apply one more update. Citrix released a patch to address issues were data loss and corruption were possible under certain circumstances. PLEASE APPLY THIS PATCH NOW!
Applying XenServer 7 Critical Patch XS70E004
Just as required in the fresh install article, a pool upgrade is also going to require this critical XenServer 7 patch to be applied to the pool to ensure data integrity.
For applying patch follow step 20 to step 26 in fresh XenServer 7 this guide here: Applying XenServer 7 Critical Patch.
This concludes the process of updating/installing XenServer to hosts. At this point, storage repositories and virtual machines should be re-imported, configured, and tested.
The next section will cover the final task of updating XenServer guest tools on the virtual guests.
Updating XenServer Guest-Tools
1. The final follow up task is to ensure that guests can be restarted as well as ensure that they have the newest guest utilities installed. This can be easily accomplished by following the next couple of steps.
2. The first step is to attach the guest-tools ISO to the DVD drive of one of the virtual guests.
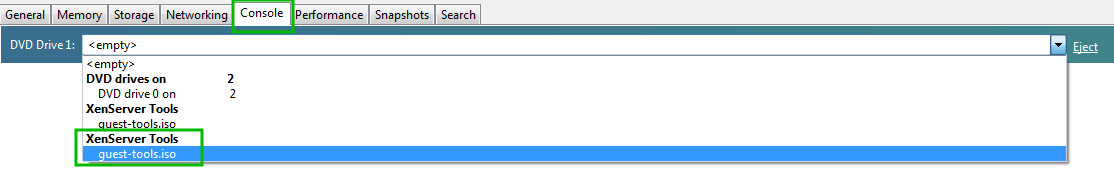
Adding XenServer Guest-Tools
3. Once XenServer attaches the guest-tools.iso to the guest, ensure that the guest recognizes the new disk. This example will walk through a Debian guest and the installation of the tools.
In the output below, the guest utilities disk was mapped as ‘xvdd’.
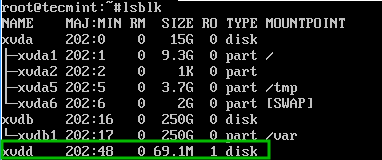
Guest Utilities Disk
4. This device can be quickly mounted using the mount utility as follows:
# mount /dev/xvdd /mnt

Mount Guest Utilities Disk
5. Once the device has been mounted, dpkg can be used to install the new guest-tools as follows:
# dpkg -i /mnt/Linux/xe-guest-utilities_7.0.0-24_all.deb
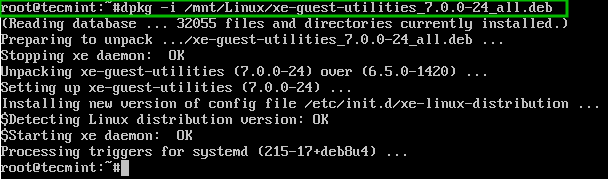
Install New Guest Tools
6. During the installation, the proper files will be installed and the xe daemon will be restarted on the systems behalf.
To confirm through XenCenter that the update was successful, go to the ‘General‘ tab for the guest machine and look for the property labeled ‘Virtualization State:’.
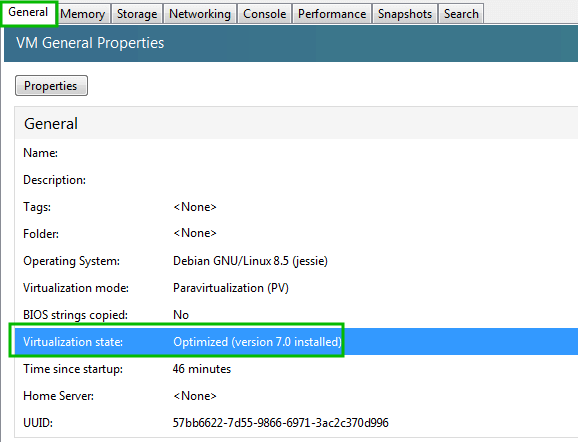
Confirm VM General Properties
Whoo… If you’ve survived this long, hopefully XenServer 7 is installed, patched, and guests are updated as well! If you have any questions or issues, please post in the comments below and we’ll provide help as soon as possible.
Source