How to Install Cacti with Cacti-Spine in Debian and Ubuntu

In this tutorial we’ll learn how to install and configure Cacti network monitoring tool in the latest version of Debian and Ubuntu 16.04 LTS. Cacti will be build and installed from source files during this guide.

Cacti is an open source monitoring tool created for monitoring networks, especially network devices, such as switches, routers, servers via SNMP protocol. Cacti interacts with end-users and can be administered via a web tool interface.

Requirements

  1. LAMP Stack Installed in Debian 9
  2. LAMP Stack Installed in Ubuntu 16.04 LTS

Step 1: Install and Configure Prerequisites for Cacti

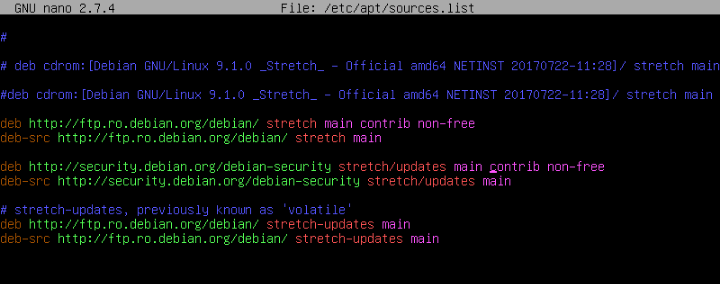
1. In Debian 9, open sources list file for editing and add the contrib and non-free repositories to the file by changing the following lines:

# nano /etc/apt/sources.list

Add following lines to sources.list file.

deb http://ftp.ro.debian.org/debian/ stretch main contrib non-free
deb-src http://ftp.ro.debian.org/debian/ stretch main

deb http://security.debian.org/debian-security stretch/updates main contrib non-free
deb-src http://security.debian.org/debian-security stretch/updates main

Add Repositories to Debian

Add Repositories to Debian

2. Afterwards, make sure to update the system by issuing the below command.

# apt update
# apt upgrade

3. In your LAMP stack make sure the following PHP extensions are present in the system.

# apt install php7.0-snmp php7.0-xml php7.0-mbstring php7.0-json php7.0-gd php7.0-gmp php7.0-zip php7.0-ldap php7.0-mcrypt

4. Next, edit PHP configuration file and change the time zone setting to match your server’s physical location, by issuing the below command.

# echo "date.timezone = Europe/Bucharest" >> /etc/php/7.0/apache2/php.ini 

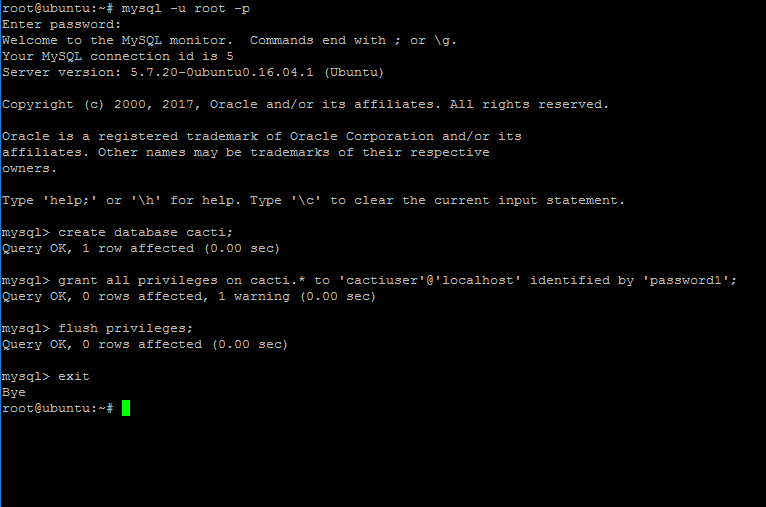
5. Next, log in to MariaDB or MySQL database from your LAMP stack installation and create a database for installing Cacti by issuing the following commands.

Replace cacti database name, user and password to match your own configurations and choose a strong password for cacti database.

# mysql -u root -p
mysql> create database cacti;
mysql> grant all on cacti.* to 'cactiuser'@'localhost' identified by 'password1';
mysql> flush privileges;
mysql> exit

Create Cacti Database

Create Cacti Database

6. Also, issue the below commands to allow cacti user select permissions to MySQL data.timezone setting by issuing the below commands.

# mysql -u root -p mysql < /usr/share/mysql/mysql_test_data_timezone.sql 
# mysql -u root -p -e 'grant select on mysql.time_zone_name to cactiuser@localhost'

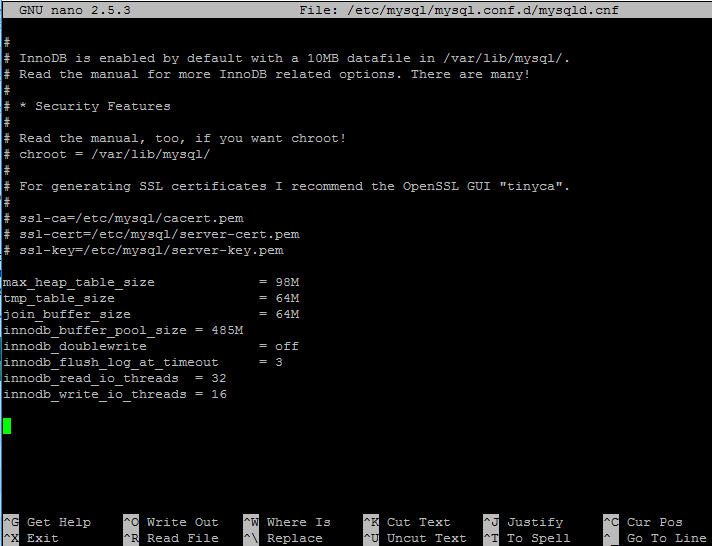
7. Next, open MySQL server configuration file and add the following lines at the end of the file.

# nano /etc/mysql/mariadb.conf.d/50-server.cnf [For MariaDB]
# nano /etc/mysql/mysql.conf.d/mysqld.cnf      [For MySQL] 

Add the following lines to the end of the 50-server.cnf or mysqld.cnf file.

max_heap_table_size		= 98M
tmp_table_size			= 64M
join_buffer_size		= 64M
innodb_buffer_pool_size	= 485M
innodb_doublewrite		= off
innodb_flush_log_at_timeout	= 3
innodb_read_io_threads	= 32
innodb_write_io_threads	= 16

For MariaDB database also add the following line to the end of the 50-server.cnf file:

innodb_additional_mem_pool_size	= 80M

Configure MySQL for Cacti

Configure MySQL for Cacti

8. Finally, restart MySQL and Apache services to apply all settings and verify both services status by issuing the following commands.

# systemctl restart mysql apache2
# systemctl status mysql apache2

Step 2: Download and Prepare Cacti Installation

9. Start install Cacti from sources by downloading and extracting the latest version of Cacti archive and copy all the extract files to Apache web document root, by issuing the following commands.

# wget https://www.cacti.net/downloads/cacti-latest.tar.gz
# tar xfz cacti-latest.tar.gz 
# cp -rf cacti-1.1.27/* /var/www/html/

10. Remove index.html file from /var/www/html directory, create the Cacti log file and grant Apache with write permissions to web root path.

# rm /var/www/html/index.html
# touch /var/www/html/log/cacti.log
# chown -R www-data:www-data /var/www/html/

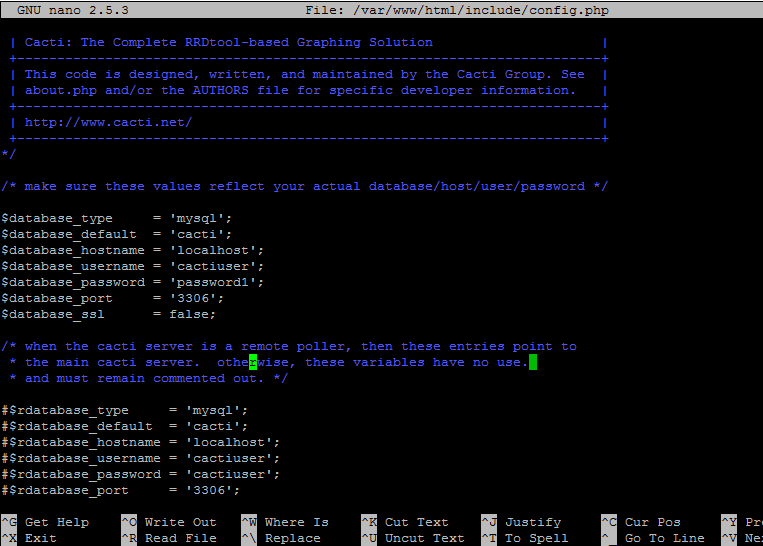
11. Next, edit cacti configuration file and modify the following lines as shown in the below example.

# nano /var/www/html/include/config.php

Cacti config.php file sample. Replace cacti database name, user and password accordingly.

$database_type     = 'mysql';
$database_default  = 'cacti';
$database_hostname = 'localhost';
$database_username = 'cactiuser';
$database_password = 'password1;
$database_port     = '3306';
$database_ssl      = false;
$url_path = '/';

Cacti Configuration Settings

Cacti Configuration Settings

12. Next, populate cacti database with the cacti.sql script from /var/www/html/ directory by issuing the below command.

# mysql -u cactiuser cacti -p < /var/www/html/cacti.sql 

13. Now install some additional resources, as Cacti engine collects devices data via the SNMP protocol and displays graphics by using RRDtool. Install all of them by issuing following command.

# apt install snmp snmpd snmp-mibs-downloader rrdtool

14. Verify if SNMP service is up and running by restarting snmpd daemon by issuing the below command. Also check the snmpd daemon status and its open ports.

# systemctl restart snmpd.service 
# systemctl status snmpd.service
# ss -tulpn| grep snmp

Step 3: Download and Install Cacti-Spine

15. Cacti-Spine is a C written replacement for the default cmd.php poller. Cacti-Spine provides a faster execution time. To compile Cacti-Spine pooler from sources install the below required dependencies in your system.

---------------- On Debian 9 ---------------- 
# apt install build-essential dos2unix dh-autoreconf help2man libssl-dev libmysql++-dev librrds-perl libsnmp-dev libmariadb-dev libmariadbclient-dev

---------------- On Ubuntu ---------------- 
# apt install build-essential dos2unix dh-autoreconf help2man libssl-dev libmysql++-dev  librrds-perl libsnmp-dev libmysqlclient-dev libmysqld-dev  

16. After you’ve installed the above dependencies, download the latest version of Cacti-Spine archive, extract the tarball and compile cacti-spine by issuing the following series of commands.

# wget https://www.cacti.net/downloads/spine/cacti-spine-latest.tar.gz
# tar xfz cacti-spine-latest.tar.gz 
# cd cacti-spine-1.1.27/

17. Compile and install Cacti-Spine from sources by issuing the following commands.

# ./bootstrap 
# ./configure 
# make
# make install

18. Next, make sure spine binary is owned by root account and set the suid bit for the spine utility by running the following commands.

# chown root:root /usr/local/spine/bin/spine 
# chmod +s /usr/local/spine/bin/spine

19. Now, edit Cacti Spine configuration file and add the cacti database name, user and password to the Spine conf file as illustrated in the below example.

# nano /usr/local/spine/etc/spine.conf

Add following configuration to spine.conf file.

DB_Host localhost
DB_Database cacti
DB_User cactiuser
DB_Pass password1
DB_Port 3306
DB_PreG 0

Step 4: Cacti Installation Wizard Setup

20. To install Cacti, open a browser and navigate to your system IP address or domain name at the following URL.

http://your_IP/install

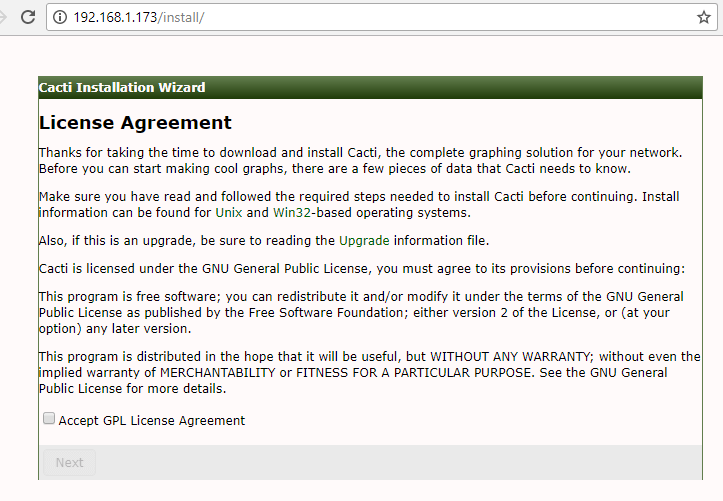
First, check Acept License Agreement and hit on the Next button to continue.

Cacti License Agreement

Cacti License Agreement

21. Next, check if system requirements and hit Next button to continue.

Cacti Pre-Installation Checks

Cacti Pre-Installation Checks

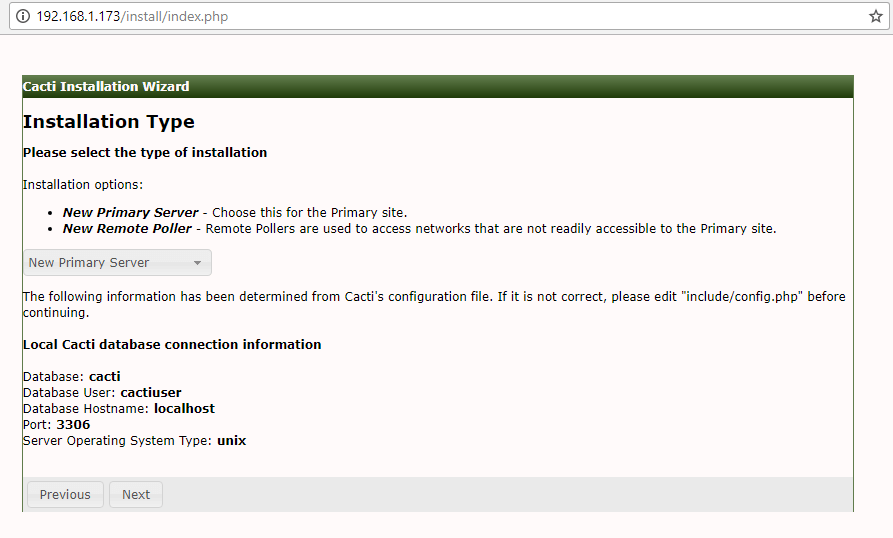
22. In the next window, select New Primary Server and hit on Next button to continue.

Select Cacti Installation Type

Select Cacti Installation Type

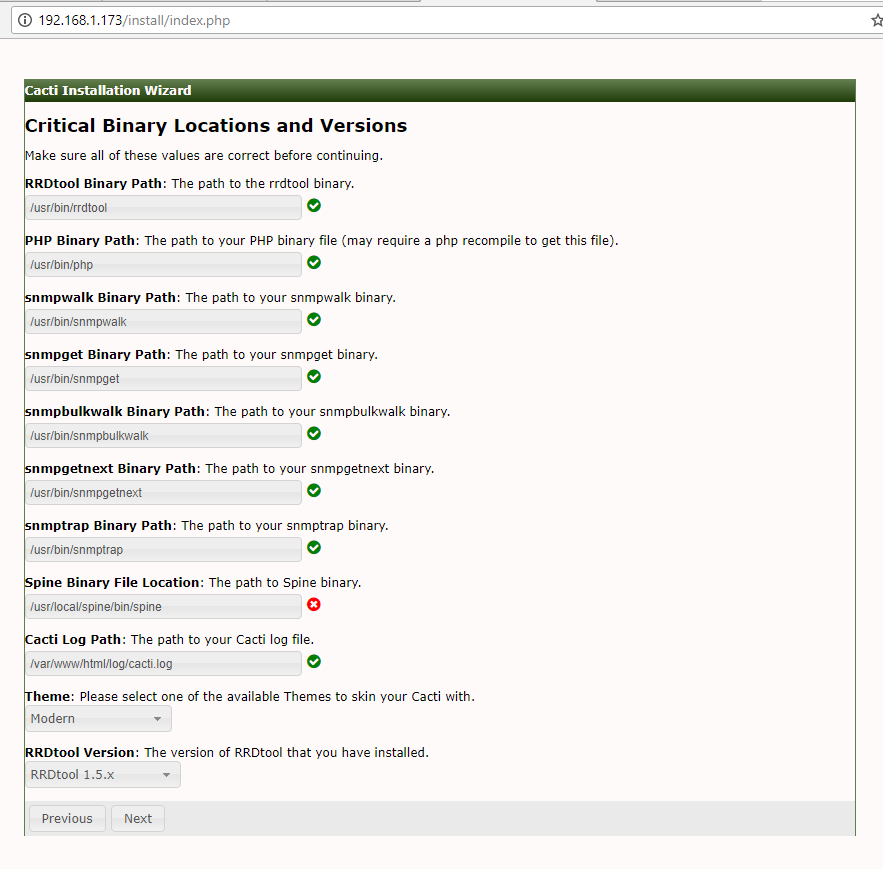
23. Next, verify critical binary locations and versions and change Spine binary path to /usr/local/spine/bin/spine. When you finish, hit Next button to continue.

Verify Cacit Binary Locations

Verify Cacit Binary Locations

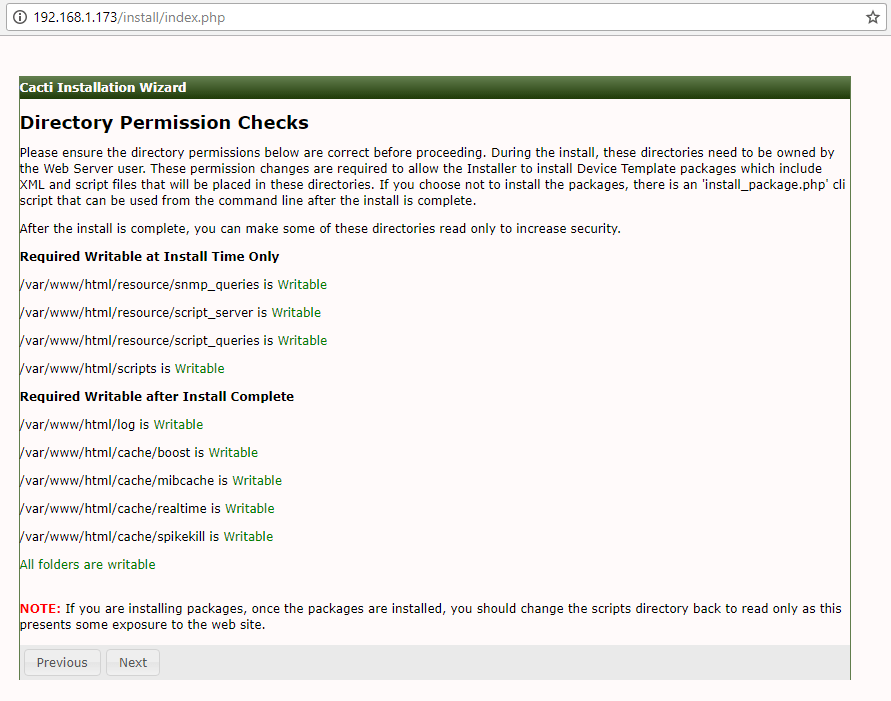
24. Next, check if all web server directory permissions are in place (write permissions are set) and hit on Nextbutton to continue.

Cacti Directory Permission Checks

Cacti Directory Permission Checks

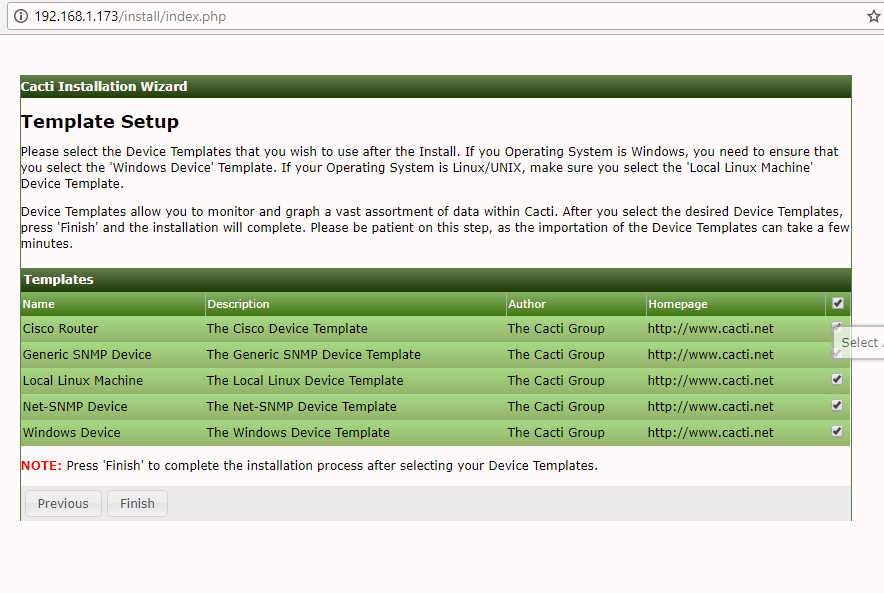
25. On the next step check all the templates and hit on Finish button in order to finish the installation process.

Cacti Template Setup

Cacti Template Setup

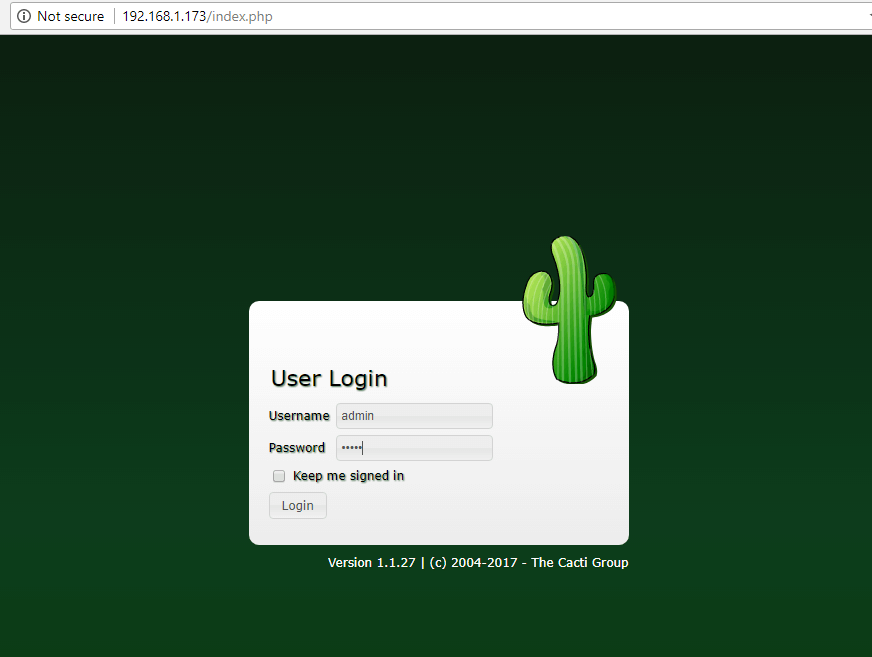
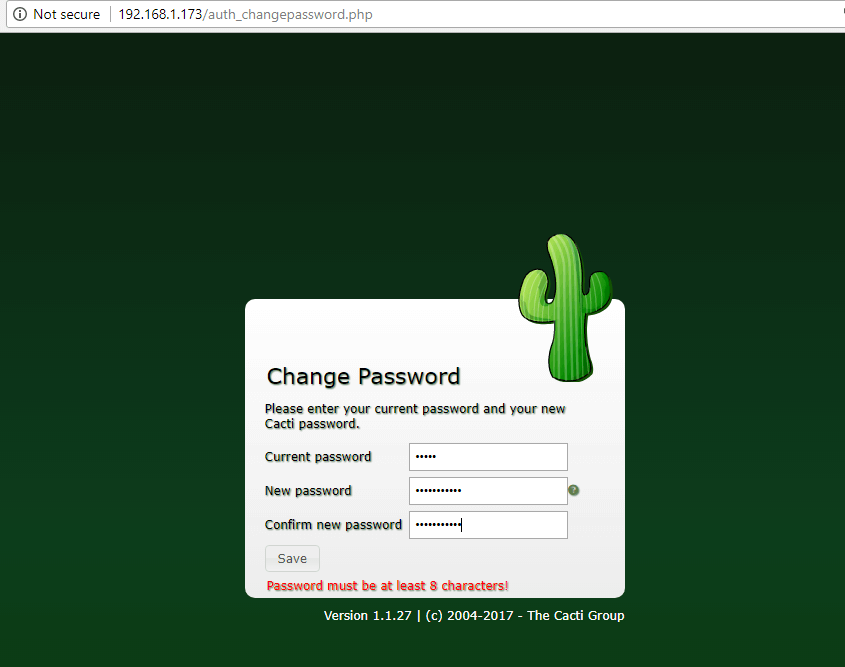
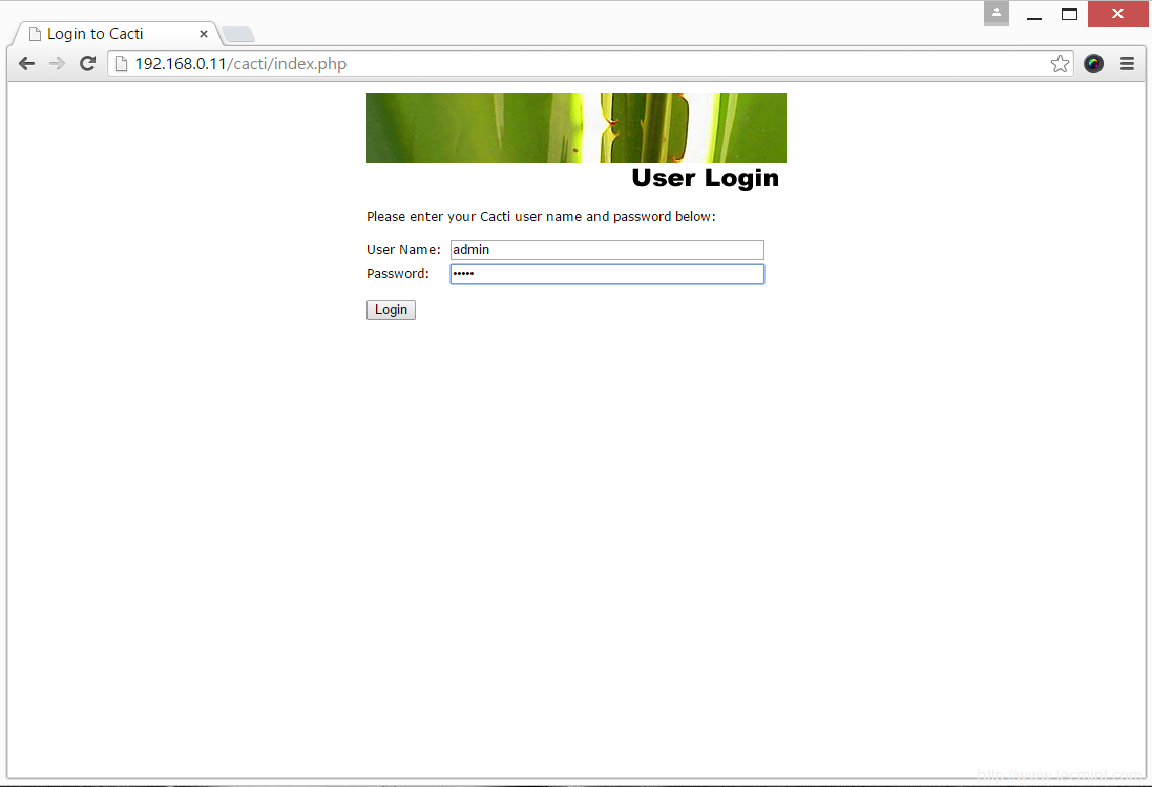
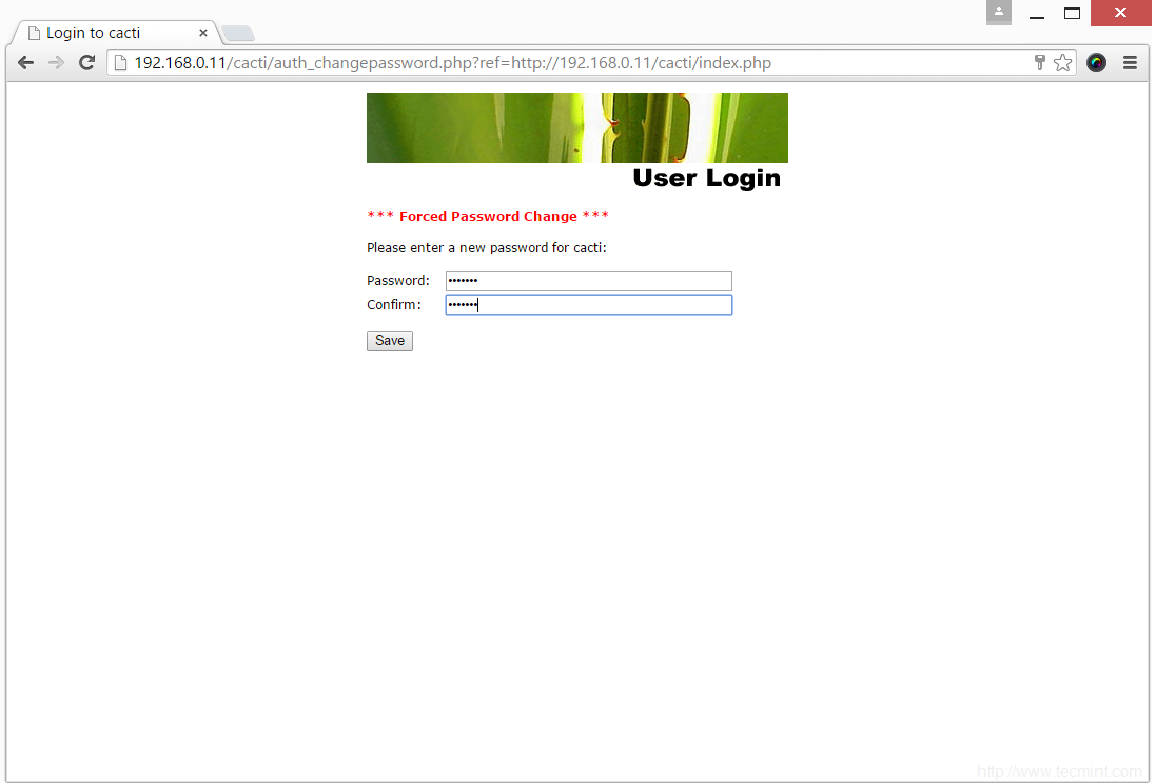
26. Log in to Cacti web interface with the default credentials shown below and change the admin password, as illustrated in the following screenshots.

Username: admin
Password: admin

Cacti Admin Login

Cacti Admin Login

Change Cacti Admin Password

Change Cacti Admin Password

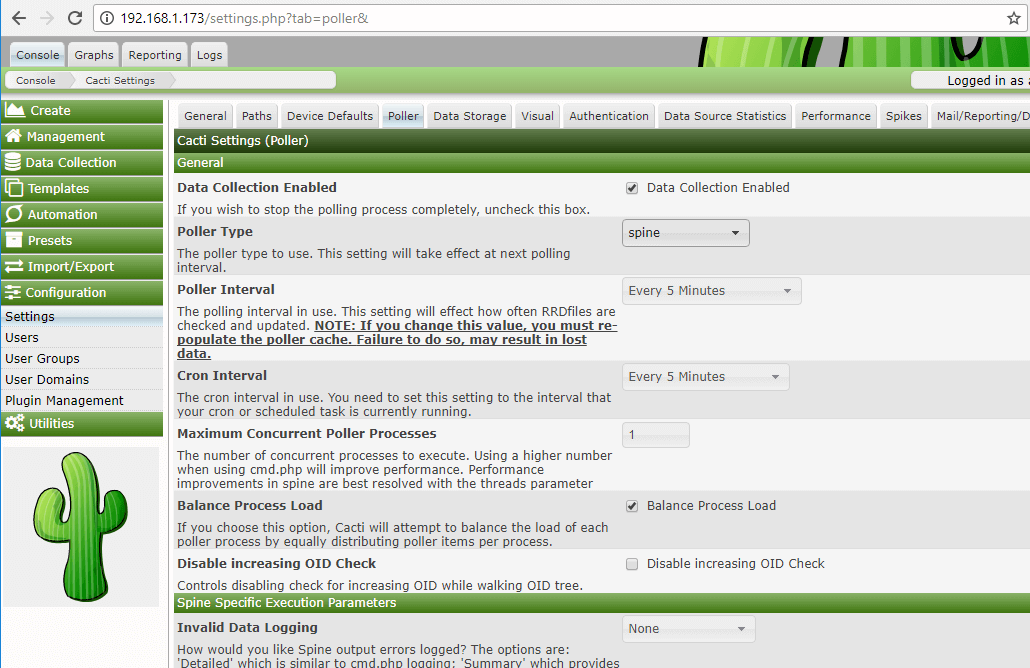
27. Next, go to Console -> Configuration -> Settings -> Poller and change the Poller Type from cmd.php to Spinebinary and scroll down to Save button to save the configuration.

Cacti Poller Settings

Cacti Poller Settings

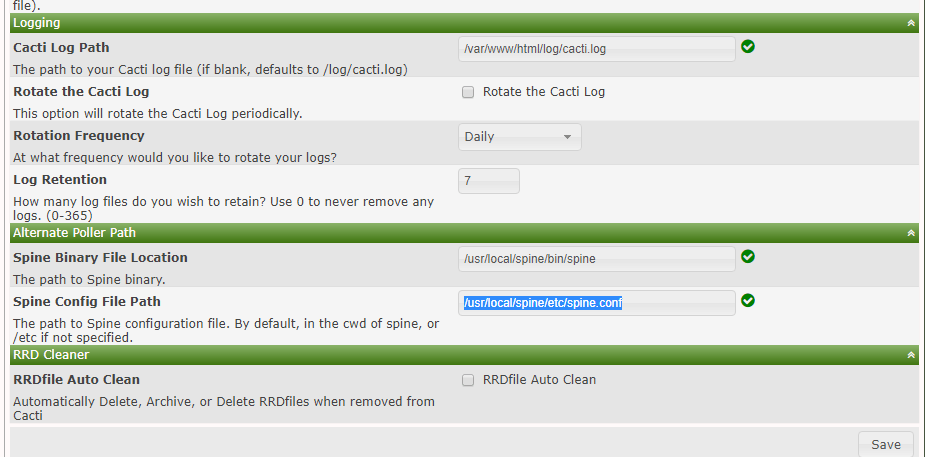
28. Then, go to Console -> Configuration -> Settings -> Paths and add the following path to Cacti-Spineconfiguration file:

/usr/local/spine/etc/spine.conf 

Hit on Save button to apply configuration.

Add Cacti Spine Configuration

Add Cacti Spine Configuration

29. The final setup which enables Cacti poller to start collecting data from monitored devices is to add a new crontab task in order to query each device via SNMP every 5 minutes.

The crontab job must be owned by www-data account.

# crontab -u www-data -e

Add Cron file entry:

*/5 * * * * /usr/bin/php /var/www/html/poller.php

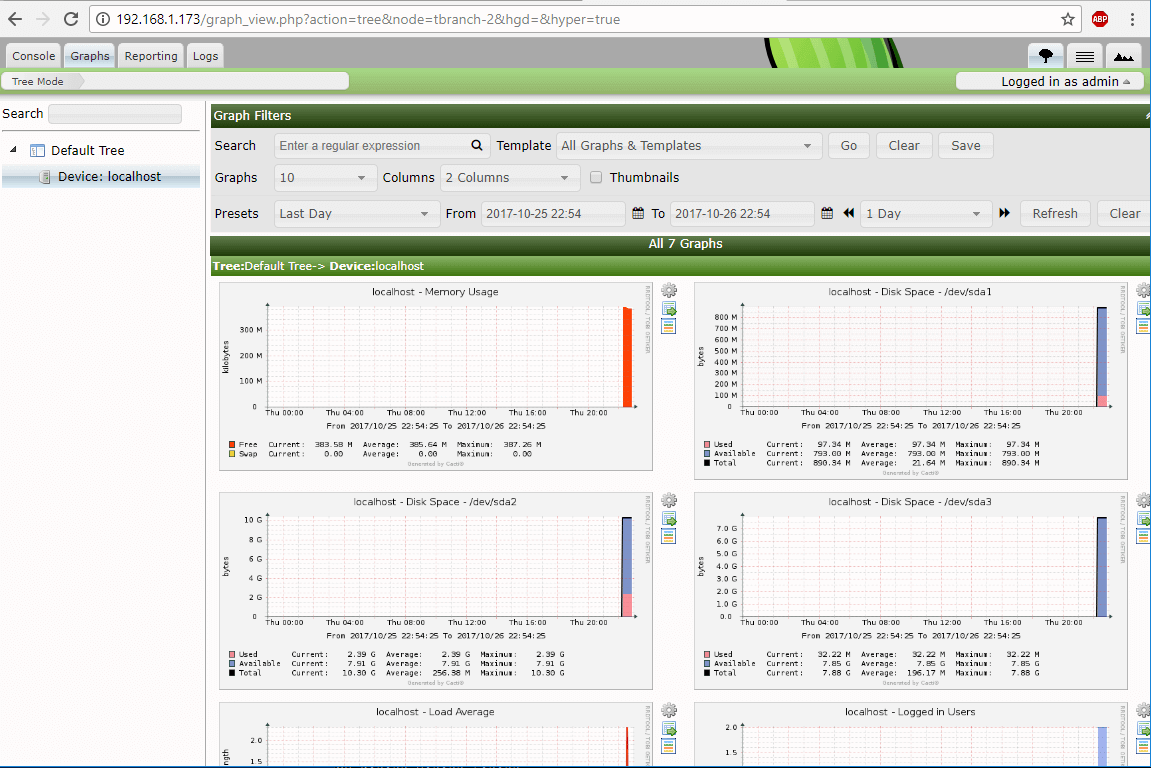
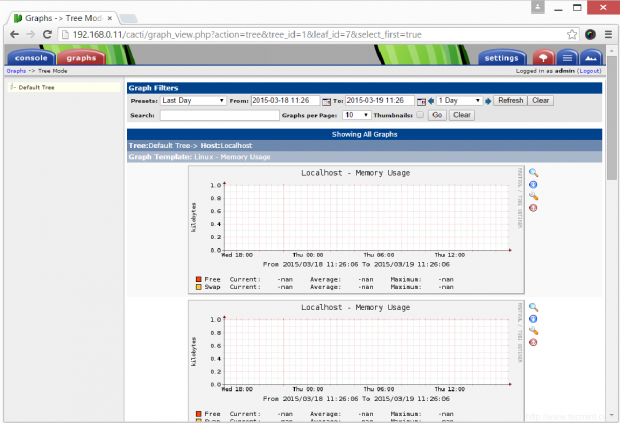
30. Wait a few minutes for Cacti to collect data and go to the Graphs -> Default Tree and you should see the graphs collected for your monitored devices.

Cacti Monitoring Graphs

Cacti Monitoring Graphs

That’s all! You have successfully installed and configured Cacti with Cacti-Spine pooler, from sources, in the latest release of Debian 9 and Ubuntu 16.04 LTS server.

Source

Install Cacti (Network Monitoring) on RHEL/CentOS 7.x/6.x/5.x and Fedora 24-12

Cacti tool is an open source web based network monitoring and system monitoring graphing solution for ITbusiness. Cacti enables a user to poll services at regular intervals to create graphs on resulting data using RRDtool. Generally, it is used to graph time-series data of metrics such as network bandwidth utilizationCPU loadrunning processesdisk space etc.

Install Cacti in Linux

Install Cacti in RHEL / CentOS / Fedora

In this how-to we are going to show you how to install and setup complete network monitoring application called Cacti using Net-SNMP tool on RHEL 7.x/6.x/5.xCentOS 7.x/6.x/5.x and Fedora 24-12 systems using YUM and DNF (Fedora 23 onwards) package manager tool.

Cacti Required Packages

The Cacti required following packages to be installed on your Linux operating systems like RHEL / CentOS / Fedora.

  1. Apache : A Web server to display network graphs created by PHP and RRDTool.
  2. MySQL : A Database server to store cacti information.
  3. PHP : A script module to create graphs using RRDTool.
  4. PHP-SNMP : A PHP extension for SNMP to access data.
  5. NET-SNMP : A SNMP (Simple Network Management Protocol) is used to manage network.
  6. RRDTool : A database tool to manage and retrieve time series data like CPU loadNetwork Bandwidth etc.

Installing Cacti Required Packages on RHEL / CentOS / Fedora

First, we need to install following dependency packages one-by-one using YUM package manager tool.

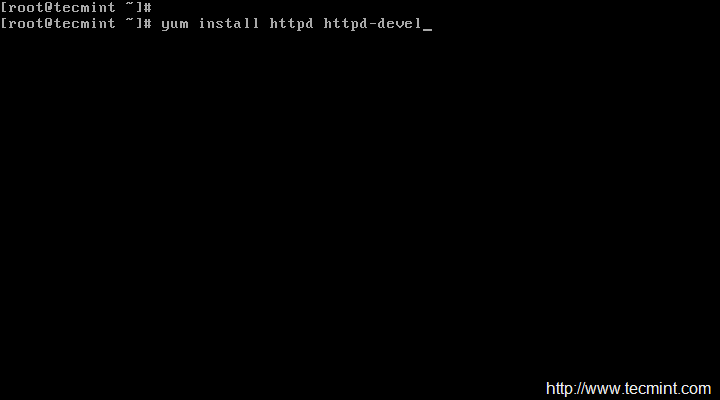
Install Apache

# yum install httpd httpd-devel

--------- On Fedora 22+ releases --------- 
# dnf install httpd httpd-devel

Install Apache in CentOS 6 and 7

Apache Web Server Installation

Install MySQL

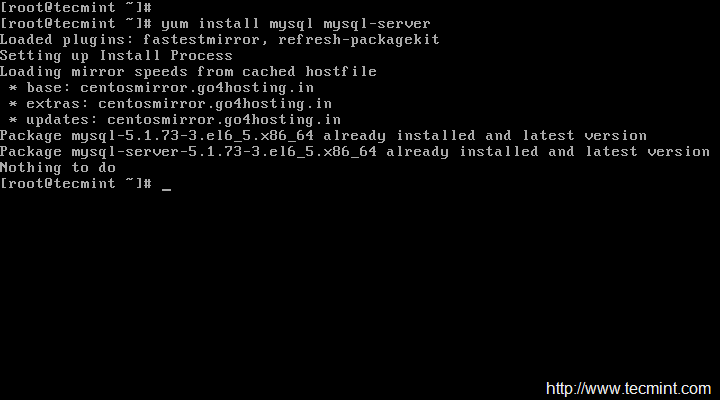
# yum install mysql mysql-server      [On RHEL/CentOS 6/5 and Fedora 12-18]

MySQL Installation in CentOS 6

MySQL Installation

MariaDB is a community-developed fork of the MySQL database project, and provides a replacement for MySQL. Previously the official supported database was MySQl under RHEL/CentOS 6.x/5.x and Fedora.

Recently, RedHat makes a new transaction from MySQl to MariaDB, as MariaDB is the default implementation of MySQL in RHEL/CentOS 7.x and Fedora 19 onwards..

# yum install mariadb-server -y		[On RHEL/CentOS 7.x and Fedora 19 onwards]
# dnf install mariadb-server -y         [On Fedora 22+ onwards]

Install MariaDB in CentOS 7

Installation of MariaDB Database

Install PHP

# yum install php-mysql php-pear php-common php-gd php-devel php php-mbstring php-cli

--------- On Fedora 22+ releases --------- 
# dnf install php-mysql php-pear php-common php-gd php-devel php php-mbstring php-cli

Install PHP in CentOS 6 and 7

PHP Installation with Modules

Install PHP-SNMP

# yum install php-snmp
# dnf install php-snmp         [On Fedora 22+ onwards]

Install SNMP in CentOS

SNMP Installation

Install NET-SNMP

# yum install net-snmp-utils net-snmp-libs
# dnf install net-snmp-utils net-snmp-libs         [On Fedora 22+ onwards]

Install SNMP Utils

Install SNMP Utils

Install RRDTool

# yum install rrdtool
# dnf install rrdtool         [On Fedora 22+ onwards]

Install Rrdtool

Install Rrdtool

Staring Apache, MySQL and SNMP Services

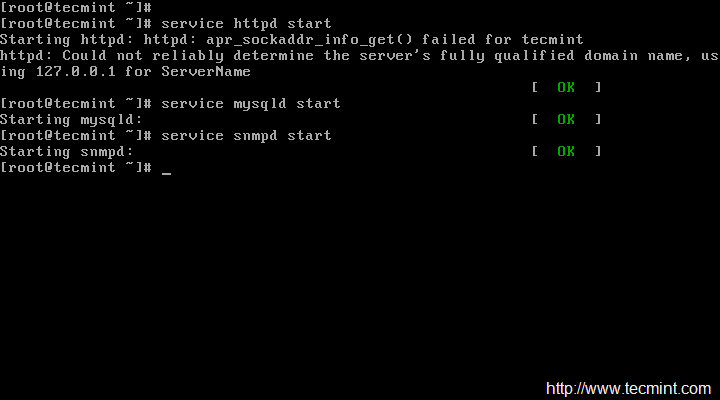
Once you’ve installed all the required software’s for Cacti installation, lets start them one-by-one using following commands.

On RHEL/CentOS 6.x/5.x and Fedora 18-12
[root@tecmint ~]# service httpd start
[root@tecmint ~]# service mysqld start
[root@tecmint ~]# service snmpd start

Start Services in CentOS 6

Start Services Using init

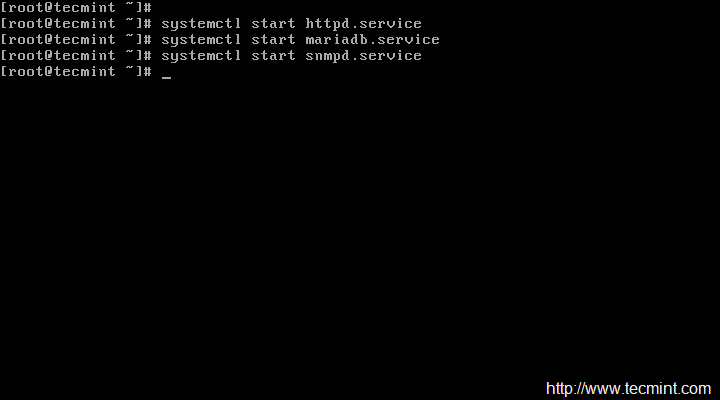
On RHEL/CentOS 7.x and Fedora 19 Onwards
[root@tecmint ~]# systemctl start httpd.service
[root@tecmint ~]# systemctl start mariadb.service
[root@tecmint ~]# systemctl start snmpd.service

Start Services in CentOS 7

Start Services Using systemctl

Configure System Start-up Links

Configuring ApacheMySQL and SNMP Services to start on boot.

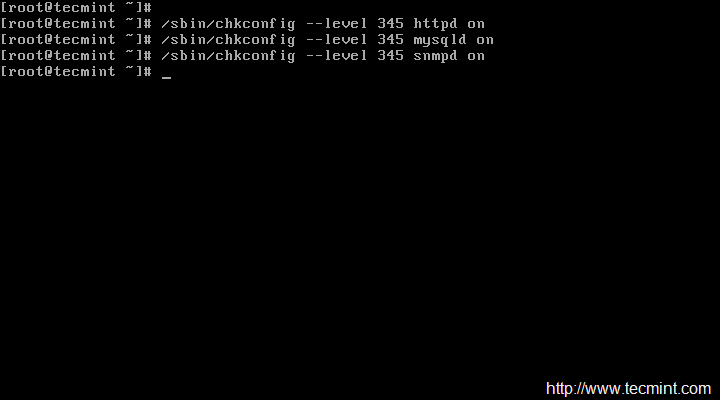
On RHEL/CentOS 6.x/5.x and Fedora 18-12
[root@tecmint ~]# /sbin/chkconfig --levels 345 httpd on
[root@tecmint ~]# /sbin/chkconfig --levels 345 mysqld on
[root@tecmint ~]# /sbin/chkconfig --levels 345 snmpd on

Enable Services at Boot in CentOS

Enable Services at Boot Using chkconfig

On RHEL/CentOS 7.x and Fedora 19 Onwards
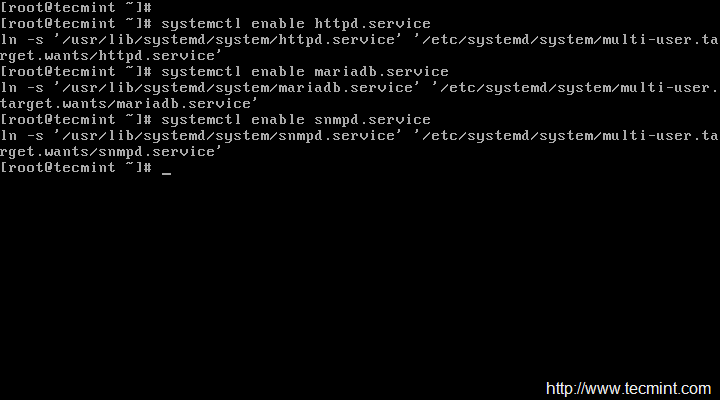
[root@tecmint ~]# systemctl enable httpd.service
[root@tecmint ~]# systemctl enable mariadb.service
[root@tecmint ~]# systemctl enable snmpd.service

Enable Services at Boot in CentOS 7

Enable Services at Boot Using systemctl

Install Cacti on RHEL / CentOS / Fedora

Here, you need to install and enable EPEL Repository. Once you’ve enabled repository, type the following command to install Cacti application.

# yum install cacti
# dnf install cacti         [On Fedora 22+ onwards]

Sample Output:

Loaded plugins: fastestmirror, langpacks
epel/x86_64/metalink                                                                                                                                                  | 4.7 kB  00:00:00
epel                                                                                                                                                                  | 4.4 kB  00:00:00
(1/2): epel/x86_64/group_gz                                                                                                                                           | 250 kB  00:00:03
(2/2): epel/x86_64/primary_db                                                                                                                                         | 4.0 MB  00:02:20
(1/2): epel/x86_64/updateinfo                                                                                                                                         | 315 kB  00:00:09
(2/2): epel/x86_64/pkgtags                                                                                                                                            | 1.4 MB  00:00:59
Loading mirror speeds from cached hostfile
 * base: centos.excellmedia.net
 * epel: ftp.cuhk.edu.hk
 * extras: centos.excellmedia.net
 * updates: centos.excellmedia.net
Resolving Dependencies
--> Running transaction check
---> Package cacti.noarch 0:0.8.8b-7.el7 will be installed
--> Processing Dependency: rrdtool for package: cacti-0.8.8b-7.el7.noarch
--> Processing Dependency: net-snmp-utils for package: cacti-0.8.8b-7.el7.noarch
--> Running transaction check
---> Package net-snmp-utils.x86_64 1:5.7.2-18.el7 will be installed
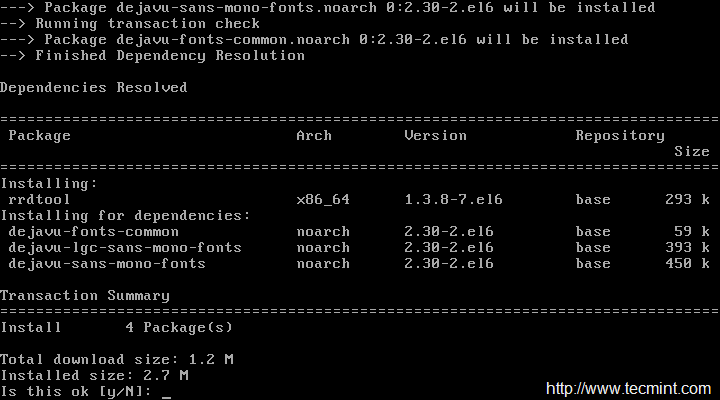
---> Package rrdtool.x86_64 0:1.4.8-8.el7 will be installed
--> Finished Dependency Resolution

Dependencies Resolved

=============================================================================================================================================================================================
 Package                                           Arch                                      Version                                           Repository                               Size
=============================================================================================================================================================================================
Installing:
 cacti                                             noarch                                    0.8.8b-7.el7                                      epel                                    2.1 M
Installing for dependencies:
 net-snmp-utils                                    x86_64                                    1:5.7.2-18.el7                                    base                                    195 k
 rrdtool                                           x86_64                                    1.4.8-8.el7                                       base                                    368 k

Transaction Summary
=============================================================================================================================================================================================
Install  1 Package (+2 Dependent packages)

Total download size: 2.7 M
Installed size: 7.2 M
Is this ok [y/d/N]: y
Downloading packages:
(1/3): net-snmp-utils-5.7.2-18.el7.x86_64.rpm                                                                                                                         | 195 kB  00:00:04
warning: /var/cache/yum/x86_64/7/epel/packages/cacti-0.8.8b-7.el7.noarch.rpm: Header V3 RSA/SHA256 Signature, key ID 352c64e5: NOKEY==============-        ]  56 kB/s | 2.4 MB  00:00:05 ETA
Public key for cacti-0.8.8b-7.el7.noarch.rpm is not installed
(2/3): cacti-0.8.8b-7.el7.noarch.rpm                                                                                                                                  | 2.1 MB  00:00:53
(3/3): rrdtool-1.4.8-8.el7.x86_64.rpm                                                                                                                                 | 368 kB  00:02:47
---------------------------------------------------------------------------------------------------------------------------------------------------------------------------------------------
Total                                                                                                                                                         16 kB/s | 2.7 MB  00:02:47
Retrieving key from file:///etc/pki/rpm-gpg/RPM-GPG-KEY-EPEL-7
Importing GPG key 0x352C64E5:
 Userid     : "Fedora EPEL (7) <epel@fedoraproject.org>"
 Fingerprint: 91e9 7d7c 4a5e 96f1 7f3e 888f 6a2f aea2 352c 64e5
 Package    : epel-release-7-5.noarch (installed)
 From       : /etc/pki/rpm-gpg/RPM-GPG-KEY-EPEL-7
Is this ok [y/N]: y
Running transaction check
Running transaction test
Transaction test succeeded
Running transaction
Warning: RPMDB altered outside of yum.
  Installing : rrdtool-1.4.8-8.el7.x86_64                                                                                                                                                1/3
  Installing : 1:net-snmp-utils-5.7.2-18.el7.x86_64                                                                                                                                      2/3
  Installing : cacti-0.8.8b-7.el7.noarch                                                                                                                                                 3/3
/var/tmp/rpm-tmp.mR0t1v: line 1: fg: no job control
warning: %post(cacti-0.8.8b-7.el7.noarch) scriptlet failed, exit status 1
Non-fatal POSTIN scriptlet failure in rpm package cacti-0.8.8b-7.el7.noarch
  Verifying  : 1:net-snmp-utils-5.7.2-18.el7.x86_64                                                                                                                                      1/3
  Verifying  : rrdtool-1.4.8-8.el7.x86_64                                                                                                                                                2/3
  Verifying  : cacti-0.8.8b-7.el7.noarch                                                                                                                                                 3/3

Installed:
  cacti.noarch 0:0.8.8b-7.el7

Dependency Installed:
  net-snmp-utils.x86_64 1:5.7.2-18.el7                                                              rrdtool.x86_64 0:1.4.8-8.el7

Complete!

Configuring MySQL Server for Cacti Installation

We need to configure MySQL for Cacti, to do this we need to set password for our newly installed MySQL server and then we will create Cacti database with user Cacti. If you’re MySQL is already password protected, then don’t need to set it again.

Set MySQL Password

To set new password for MySQL server, use the following command. (Note : This is for new MySQL installation only).

[root@tecmint ~]# mysqladmin -u root password YOUR-PASSWORD-HERE

Create MySQL Cacti Database

Login into MySQL server with newly created password and create Cacti database with user Cacti and set the password for it.

On RHEL/CentOS 6.x/5.x and Fedora 18-12
[root@tecmint ~]# mysql -u root -p
Enter password:
Welcome to the MySQL monitor.  Commands end with ; or \g.
Your MySQL connection id is 3
Server version: 5.1.73 Source distribution
Copyright (c) 2000, 2013, Oracle and/or its affiliates. All rights reserved.
Oracle is a registered trademark of Oracle Corporation and/or its
affiliates. Other names may be trademarks of their respective
owners.

Type 'help;' or '\h' for help. Type '\c' to clear the current input statement.

mysql> create database cacti;
Query OK, 1 row affected (0.00 sec)

mysql> GRANT ALL ON cacti.* TO cacti@localhost IDENTIFIED BY 'tecmint';
Query OK, 0 rows affected (0.00 sec)

mysql> FLUSH privileges;
Query OK, 0 rows affected (0.00 sec)

mysql> quit;
Bye
On RHEL/CentOS 7.x and Fedora 19 Onwards
[root@tecmint ~]# mysql -u root -p
Enter password:
Welcome to the MariaDB monitor.  Commands end with ; or \g.
Your MariaDB connection id is 3
Server version: 5.5.41-MariaDB MariaDB Server
Copyright (c) 2000, 2014, Oracle, MariaDB Corporation Ab and others.
Type 'help;' or '\h' for help. Type '\c' to clear the current input statement.

MariaDB [(none)]> create database cacti;
Query OK, 1 row affected (0.00 sec)

MariaDB [(none)]> GRANT ALL ON cacti.* TO cacti@localhost IDENTIFIED BY 'tecmint';
Query OK, 0 rows affected (0.00 sec)

MariaDB [(none)]> FLUSH privileges;
Query OK, 0 rows affected (0.00 sec)

MariaDB [(none)]> quit;
Bye

Install Cacti Tables to MySQL

Find out the database file path using RPM command, to install cacti tables into newly created Cacti database, use the following command.

# rpm -ql cacti | grep cacti.sql
Sample Output:
/usr/share/doc/cacti-0.8.8b/cacti.sql
OR
/usr/share/doc/cacti/cacti.sql

Now we’ve of the location of Cacti.sql file, type the following command to install tables, here you need to type the Cacti user password.

[root@tecmint ~]# mysql -u cacti -p cacti < /usr/share/doc/cacti-0.8.8b/cacti.sql
Enter password:

Configure MySQL settings for Cacti

Open the file called /etc/cacti/db.php with any editor.

# vi /etc/cacti/db.php

Make the following changes and save the file. Make sure you set password correctly.

/* make sure these values reflect your actual database/host/user/password */
$database_type = "mysql";
$database_default = "cacti";
$database_hostname = "localhost";
$database_username = "cacti";
$database_password = "your-password-here";
$database_port = "3306";
$database_ssl = false;

Configuring Firewall for Cacti

On RHEL/CentOS 6.x/5.x and Fedora 18-12
[root@tecmint ~]# iptables -A INPUT -p udp -m state --state NEW --dport 80 -j ACCEPT
[root@tecmint ~]# iptables -A INPUT -p tcp -m state --state NEW --dport 80 -j ACCEPT
[root@tecmint ~]# service iptables save
On RHEL/CentOS 7.x and Fedora 19 Onwards
[root@tecmint ~]# firewall-cmd --permanent --zone=public --add-service=http
[root@tecmint ~]# firewall-cmd --reload

Configuring Apache Server for Cacti Installation

Open file called /etc/httpd/conf.d/cacti.conf with your choice of editor.

# vi /etc/httpd/conf.d/cacti.conf

You need to enabled access to Cacti application for your local network or per IP level. For example we’ve enabled access to our local LAN network 172.16.16.0/20. In your case, it would be different.

Alias /cacti    /usr/share/cacti
 
<Directory /usr/share/cacti/>
        Order Deny,Allow
        Deny from all
        Allow from 172.16.16.0/20
</Directory>

In latest version of Apache (ex: Apache 2.4), you may need to change according to the following settings.

Alias /cacti    /usr/share/cacti

<Directory /usr/share/cacti/>
        <IfModule mod_authz_core.c>
                # httpd 2.4
                Require all granted
        </IfModule>
        <IfModule !mod_authz_core.c>
                # httpd 2.2
                Order deny,allow
                Deny from all
                Allow from all
        </IfModule>
</Directory>

Finally, restart the Apache service.

[root@tecmint ~]# service httpd restart				[On RHEL/CentOS 6.x/5.x and Fedora 18-12]

[root@tecmint ~]# systemctl restart httpd.service		[On RHEL/CentOS 7.x and Fedora 19 onwards]

Setting Cron for Cacti

Open file /etc/cron.d/cacti.

# vi /etc/cron.d/cacti

Uncomment the following line. The poller.php script runs every 5mins and collects data of known host which is used by Cacti application to display graphs.

#*/5 * * * *    cacti   /usr/bin/php /usr/share/cacti/poller.php > /dev/null 2>&1

Running Cacti Installer Setup

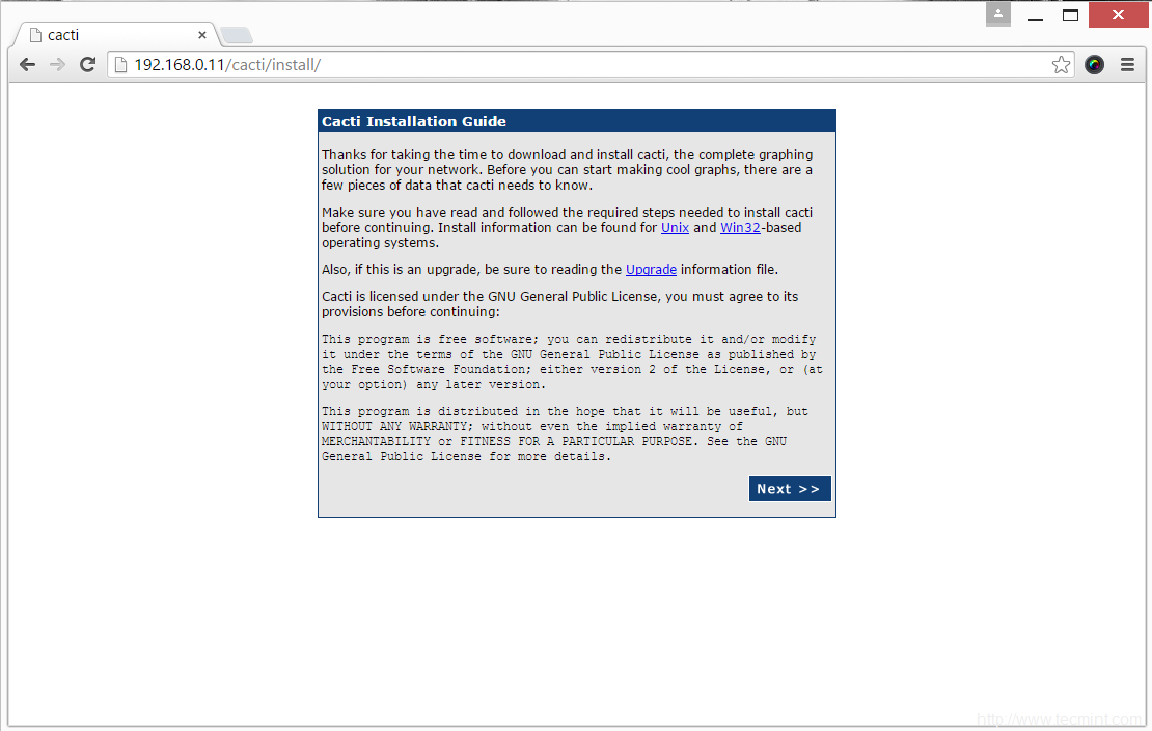
Finally, Cacti is ready, just go to http://YOUR-IP-HERE/cacti/ & follow the installer instruction through the following screens. Click Next button.

Cacti Installer Screen

Cacti Setup Screen

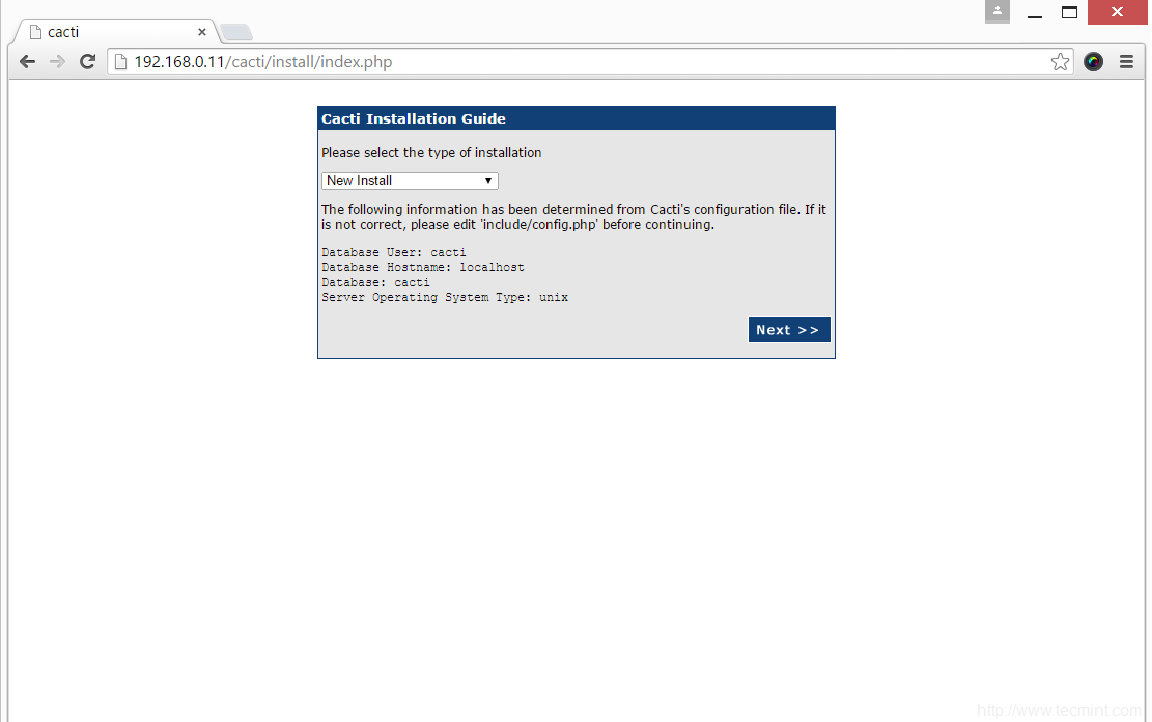
Please choose installation Type as “New Install“.

Cacti New Install Setup

Select Cacti New Install

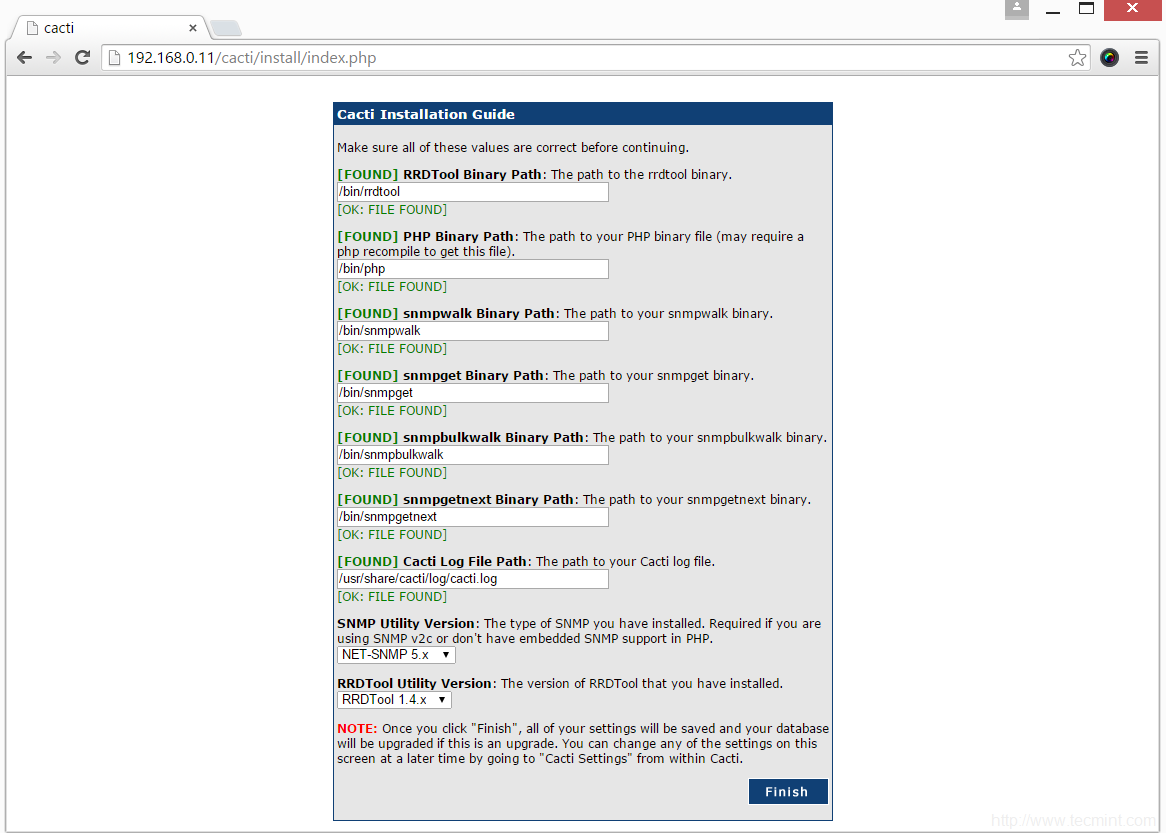
Make sure all the following values are correct before continuing. Click Finish button.

Cacti Installation

Cacti Installation Directories

Cacti Login Screen, enter username as admin and password as admin.

Cacti Login Screen

Cacti Login Screen

Once you’ve entered username and password, it will ask you to enter a new password for cacti.

Set Cacti Password

Cacti Force Password Screen

Cacti Console Screen.

Cacti Console

Cacti Console Screen

How to Create New Graphs

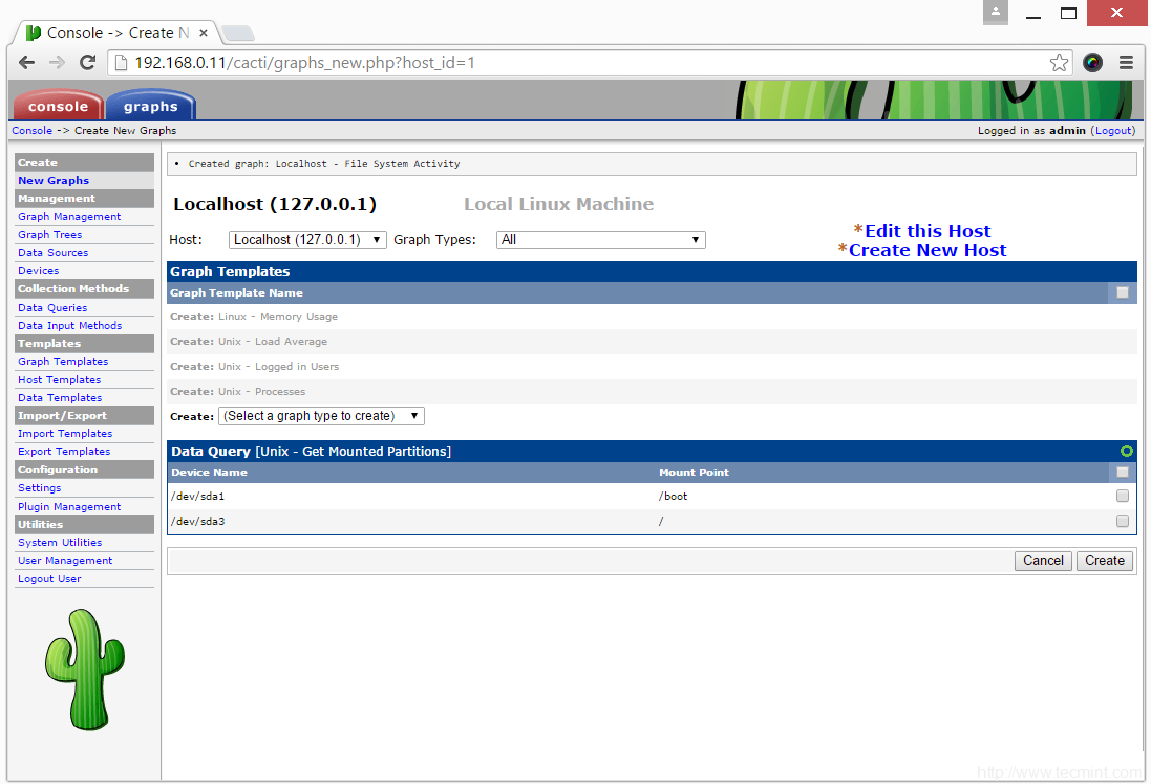
To create graphs, Click on New Graphs –> Select Host –> Select SNMP – Interface Statistics and Select a graph type In/Out Bits. Click on Create button. Please refer screen below.

Create Graphs in Cacti

How to Create Graphs in Cacti

Cacti Monitoring Graphs

Cacti Monitoring Graphs

For more information and usage please visit the Cacti Page.

Source

How to Monitor Linux Commands Executed by System Users in Real-time

Are you a Linux system administrator and want to monitor interactive activity of all system users (Linux commands they executes) in real-time. In this brief Linux system security guide, we will explain how to view all Linux shell commands executed by system users in real-time.

Read AlsoHow to Monitor User Activity with psacct or acct Tools

If your system has bash, the most commonly used shell out there then all commands executed by normal system users will be stored in the .bash_history hidden file which is kept in each user’s home directory. The content of this file can be viewed by users, using the history command.

To view a user aaronkilik’s .bash_history file, type:

# cat /home/aaronkilik/.bash_history

User bash-history file

User bash-history file

From the screen shot above, the date and time when a command was executed is not shown. This is the default setting on most if not all Linux distributions.

You can follow this guide to set date and time for each command in bash_history file.

Monitor User Activity in Real-time Using Sysdig in Linux

To get a glimpse of what users are doing on the system, you can use the w command as follows.

# w

Monitor Logged in Users

Monitor Logged in Users

But to have a real-time view of the shell commands being run by another user logged in via a terminal or SSH, you can use the Sysdig tool in Linux.

Sydig is an open-source, cross-platform, powerful and flexible system monitoring, analysis and troubleshooting tool for Linux. It can be used for system exploration and debugging.

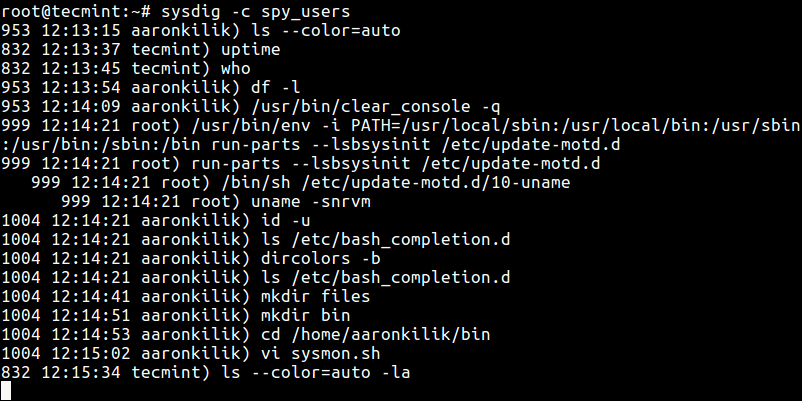
Once you have installed sysdig, use the spy_users chisel to spy on users by running the command below.

# sysdig -c spy_users

The above command displays every command that users launch interactively as well as every directory users visit.

Monitor User Activity in Real-Time

Monitor User Activity in Real-Time

That’s all, you can also check out these following related articles:

  1. 25 Hardening Security Tips for Linux Servers
  2. Lynis – Security Auditing and Scanning Tool for Linux Systems
  3. 10 Useful Open Source Security Firewalls for Linux Systems
  4. A Practical Guide to Nmap (Network Security Scanner) in Linux

In this system security guide, we described how to view users bash history file, show logged on users and what they are doing, and we also explained how to view or monitor all commands executed by system users in real-time.

If you want to share any other methods or ask questions, please do so via the comment section below.

Source

4 Useful Commandline Tools to Monitor MySQL Performance in Linux

There are plenty of tools to monitor MySQL performance and troubleshoot a server, but they don’t always perfect match for a MySQL developer or administrator’s for their common needs, or may not work in some situations, such as remote or over the web monitoring.

MySQL Monitoring Tools

MySQL Monitoring Tools

Luckily, there are variety of open source tools created by MySQL community to fill the gaps. On the other hand, it’s very difficult to locate these tools via web searches, that’s the reason we’ve compiled 4 command line toolsto monitor MySQL database uptimeload and performance in Linux.

Uptime means how long the database has been running and up since its last shutdown or restart. Getting information about uptime is very crucial in many situations, as it helps system administrators to check the status of MySQL database about, how many queries per second that MySQL database serves, threads, slow queries and lots of interesting statistics.

1. Mytop

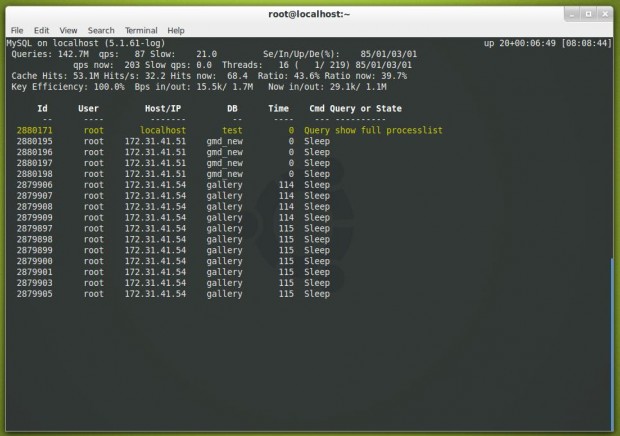
Mytop is one of my classic open source and free console-based (non-gui) monitoring tool for MySQL database was written by Jereme Zawodny using Perl language. Mytop runs in a terminal and displays statistics about threads, queries, slow queries, uptime, load, etc. in tabular format, much similar to the Linux top program. Which indirectly helps the administrators to optimize and improve performance of MySQl to handle large requests and decrease server load.

Install Mytop Mysql Monitoring in Linux

Mytop: Mysql Monitoring

There are mytop packages available for various Linux distributions, such as UbuntuFedora and CentOS. For more about installation instruction read: How to Install Mytop (MySQL Monitoring) in Linux

2. Mtop

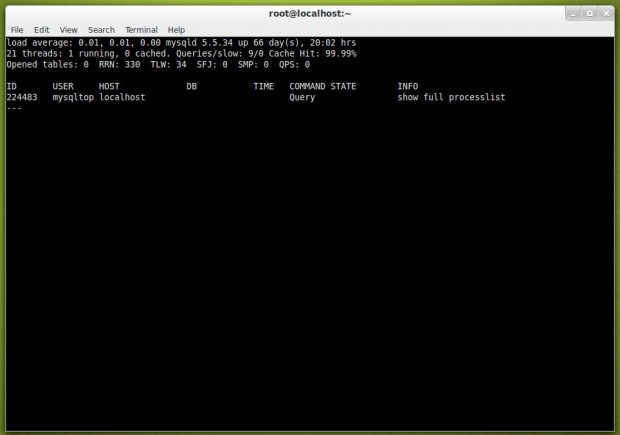
mtop (MySQL top) is a another similar open source, command line based real time MYSQL Server monitoring tool, was written in Perl language that display results in tabular format much like mytop. mtop monitors MySQL queries which are taking the most amount of time to finish and kills those long running queries after certain specified time.

In addition, it also enable us to identify performance related problems, configuration information, performance statistics and tuning related tips from the command line interface. The two tools are very similar, but mtop is not actively maintained and may not work on newly installed MySQL versions.

Install mtop in Linux

mtop Preview

For more about installation instruction read: How to Install Mtop (MySQL Monitoring) in Linux

3. Innotop

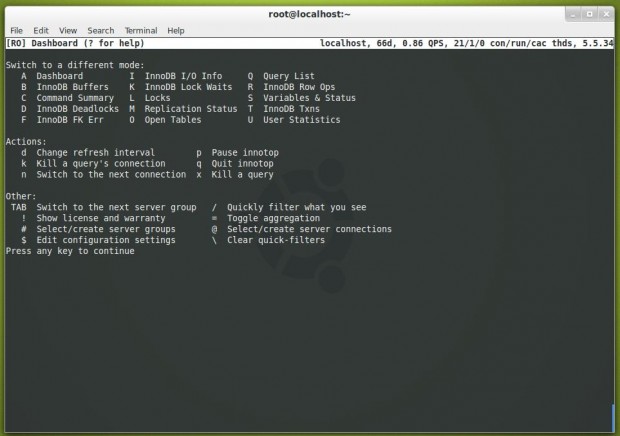
Innotop is a real time advanced command line based investigation program to monitor local and remote MySQL servers running under InnoDB engine. Innotop includes many features and comes with different types of modes/options, which helps us to monitor various aspects of MySQL performance to find out what’s wrong going with MySQL server.
Install Innotop in Linux

Innotop Preview

For more about installation instruction read: How to Install Innotop (MySQL Monitoring) in Linux

4. mysqladmin

mysqladmin is a default command line MySQL client that comes pre-installed with MySQL package for performing administrative operations such as monitoring processes, checking server configuration, reloading privileges, current status, setting root password, changing root password, create/drop databases, and much more.

To check the mysql status as well as uptime run the following command from the terminal, and make sure you must have root permission to execute the command from the shell.

[root@localhost ~]# mysqladmin -u root -p version
Enter password:
Sample Output
mysqladmin  Ver 8.42 Distrib 5.1.61, for redhat-linux-gnu on i386
Copyright (c) 2000, 2011, Oracle and/or its affiliates. All rights reserved.

Oracle is a registered trademark of Oracle Corporation and/or its
affiliates. Other names may be trademarks of their respective
owners.

Server version		5.1.61-log
Protocol version	10
Connection		Localhost via UNIX socket
UNIX socket		/var/lib/mysql/mysql.sock
Uptime:			20 days 54 min 30 sec

Threads: 1  Questions: 149941143  Slow queries: 21  Opens: 752  Flush tables: 1  Open tables: 745  Queries per second avg: 86.607

For more about mysqladmin commands and examples, read: 20 mysqladmin Commands for MySQL Administration in Linux

Conclusion

If you’re looking for a good monitor tool for your own work, I recommend mytop and innotop. I used to depend on mytop for my daily monitoring purposes, but now I shifted to innotop, because it displays much more statistics and information, including important transactions.

Source

bmon – A Powerful Network Bandwidth Monitoring and Debugging Tool for Linux

bmon is a simple yet powerful, text-based network monitoring and debugging tool for Unix-like systems, which captures networking related statistics and displays them visually in a human friendly format. It is a reliable and effective real-time bandwidth monitor and rate estimator.

It can read input using an assortment of input modules and presents output in various output modes, including an interactive curses user interface as well as a programmable text output for scripting purposes.

Suggested Read: 20 Command Line Tools to Monitor Linux Performance

Install bmon Bandwidth Monitoring Tool in Linux

Almost all Linux distributions has bmon package in the default repositories and can be easily install from default package manger, but the available version might be little older.

$ sudo yum install bmon      [On RHEL/CentOS/Fedora]
$ sudo dnf install bmon      [On Fedora 22+]
$ sudo apt-get install bmon  [On Debian/Ubuntu/Mint]

Alternatively, you can get .rpm and .deb packages for your Linux distribution from https://pkgs.org/download/bmon.

If you wanted to have a most recent version of bmon (i.e version 4.0), you need to build it from source using following commands.

On CentOS, RHEL and Fedora

$ git clone https://github.com/tgraf/bmon.git
$ cd bmon
$ sudo yum install make libconfuse-devel libnl3-devel libnl-route3-devel ncurses-devel
$ sudo ./autogen.sh
$ sudo./configure
$ sudo make
$ sudo make install

On Debian, Ubuntu and Linux Mint

$ git clone https://github.com/tgraf/bmon.git
$ cd bmon
$ sudo apt-get install build-essential make libconfuse-dev libnl-3-dev libnl-route-3-dev libncurses-dev pkg-config dh-autoreconf
$ sudo ./autogen.sh
$ sudo ./configure
$ sudo make
$ sudo make install

How to Use bmon Bandwidth Monitoring Tool in Linux

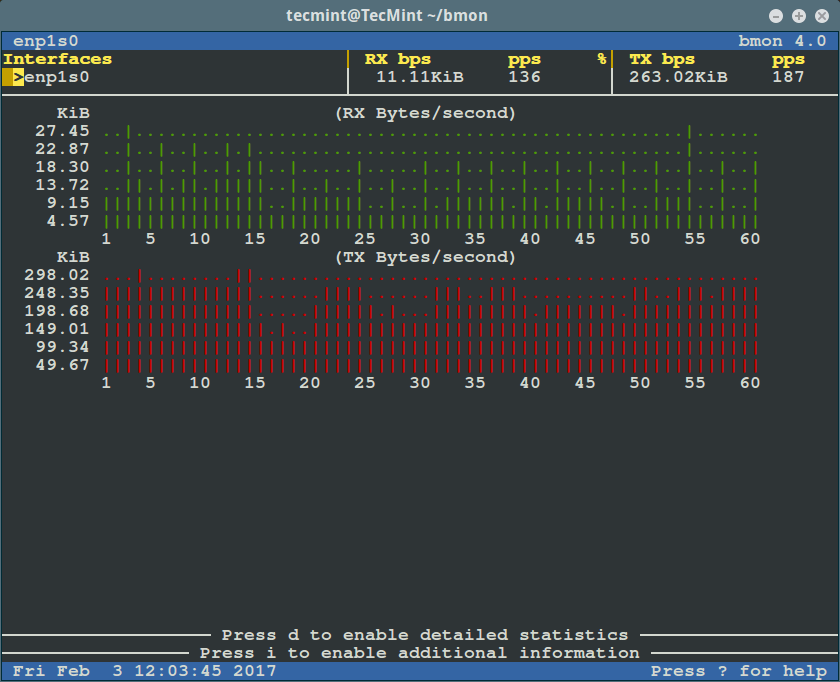
Run it as below (for starters: RX means received bytes per second and TX refers to transmitted bytes per second):

$ bmon

bmon - Linux Bandwidth Monitoring

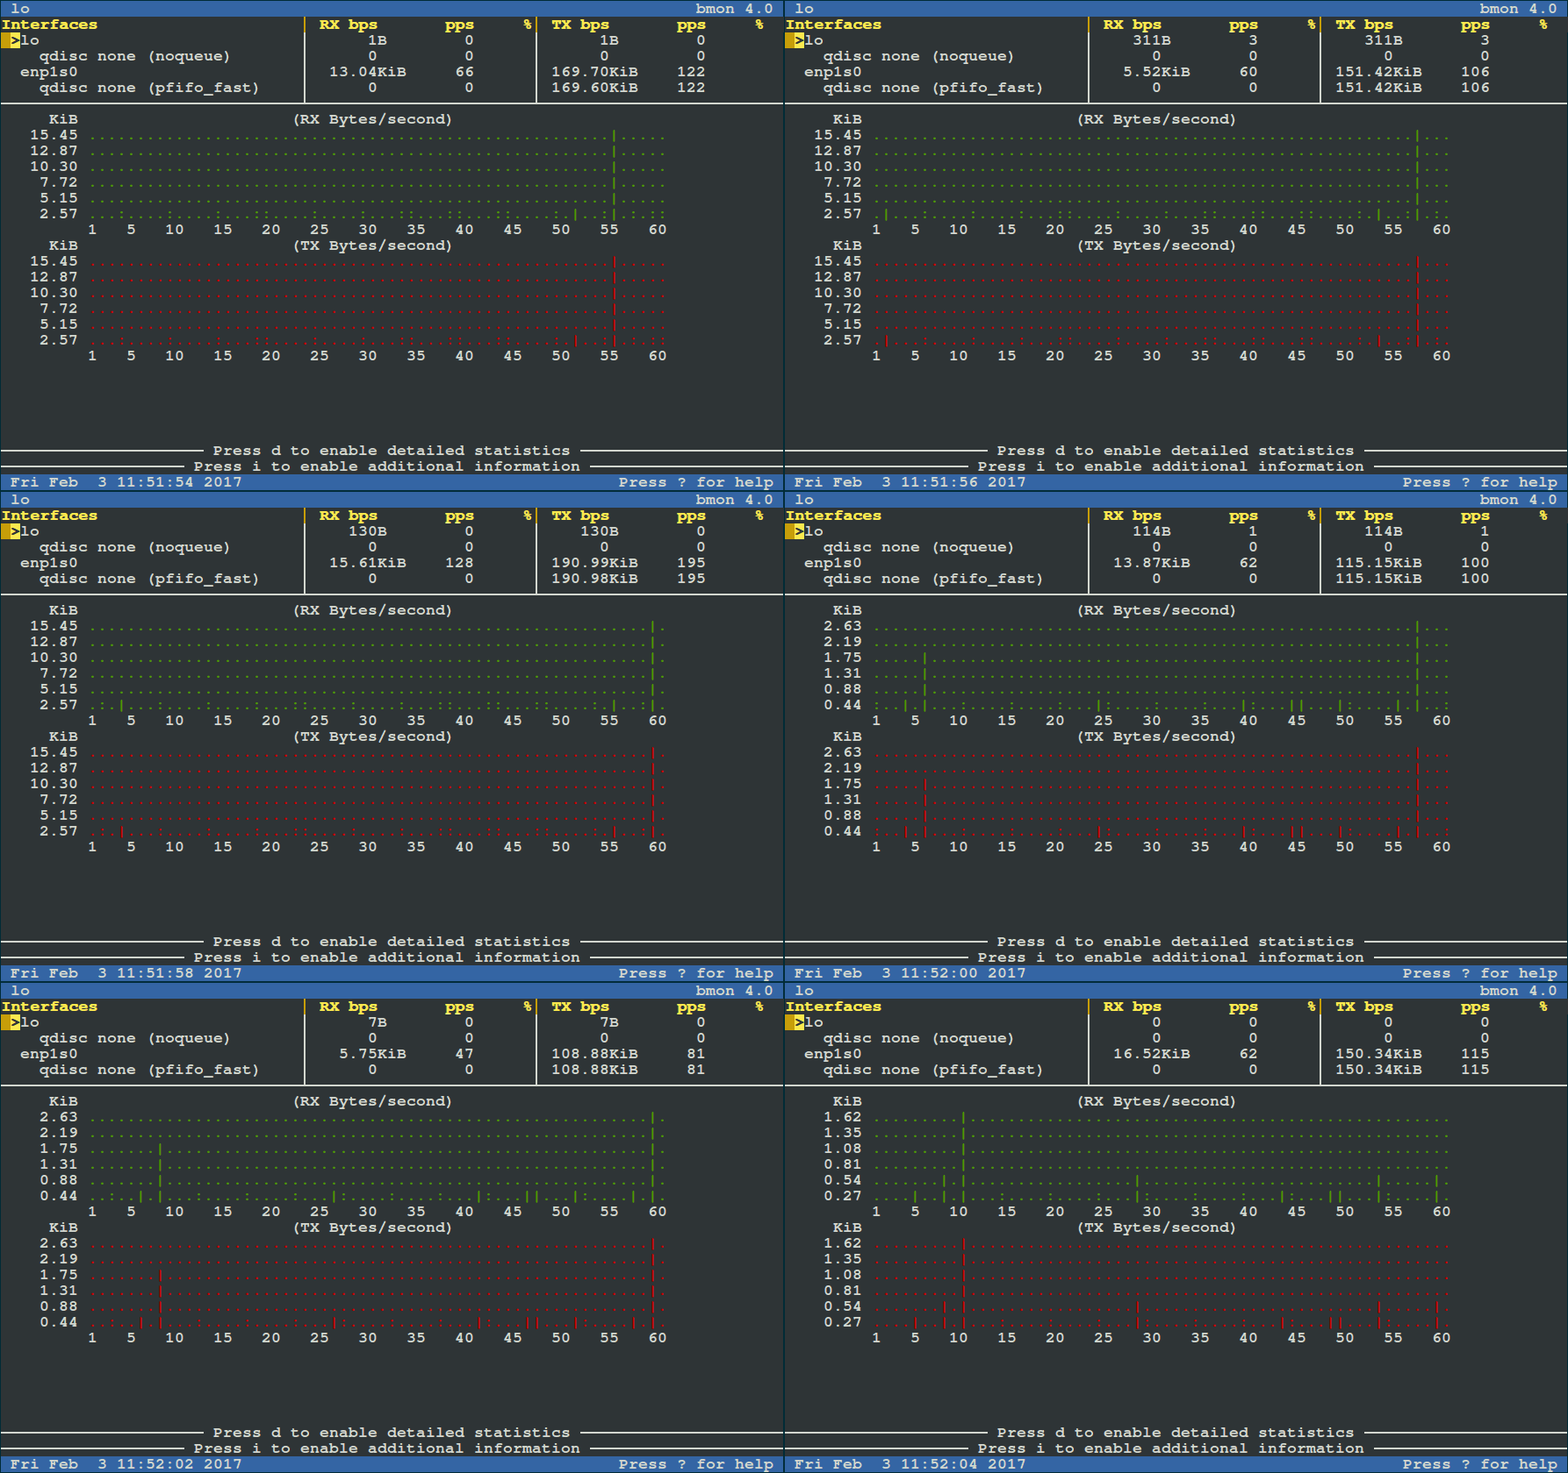
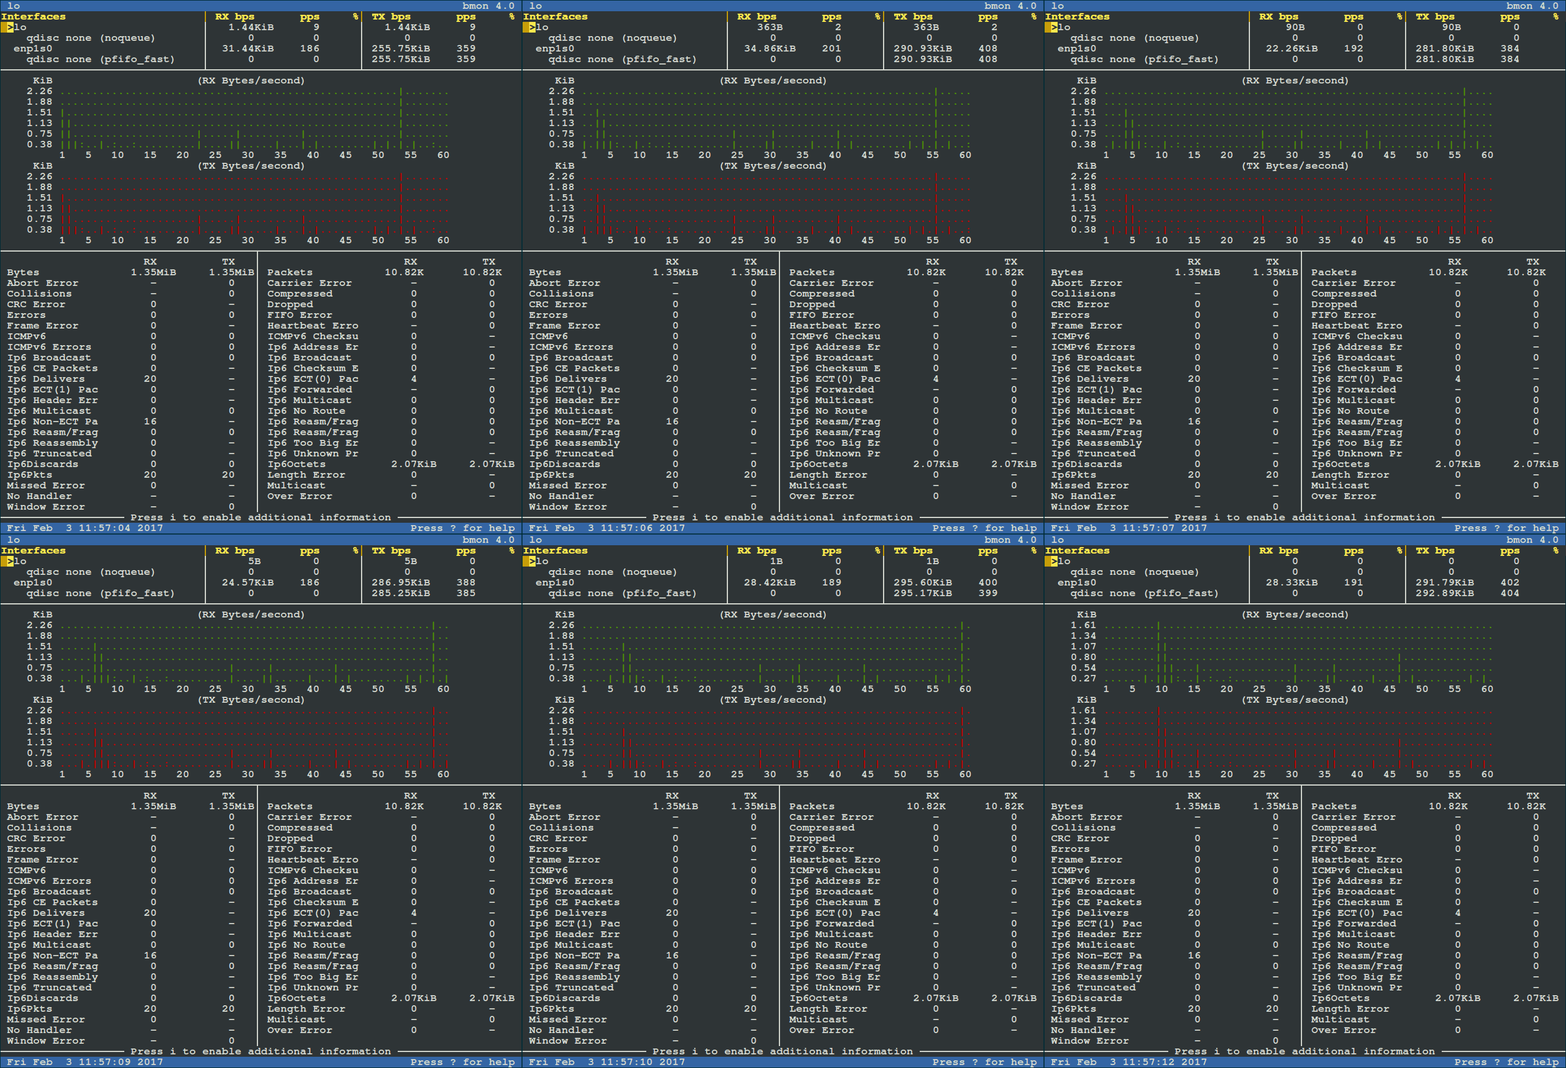
To view more detailed graphical statistics/information of bandwidth usage, press d key and refer screnshot below.

bmon - Detailed Bandwidth Statistics

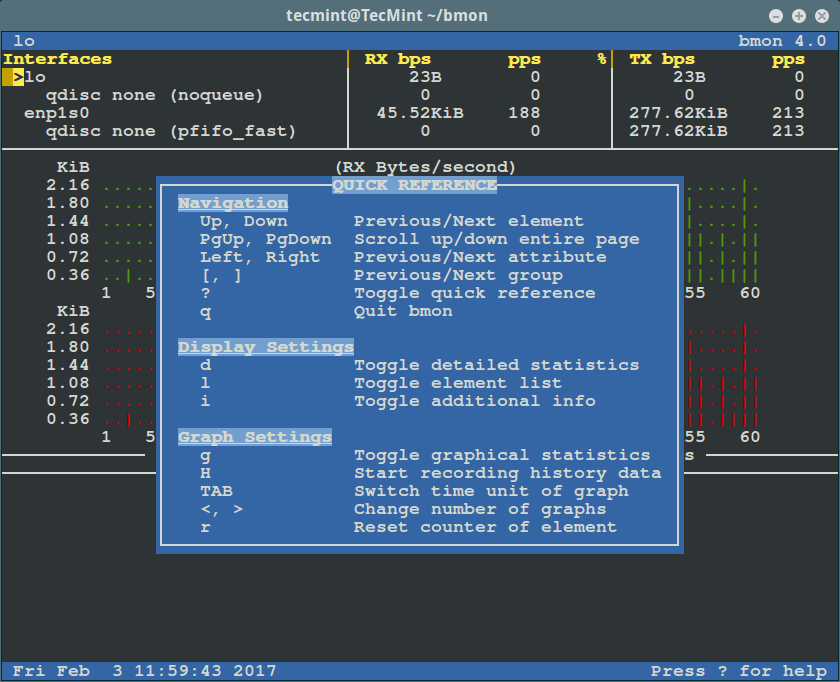
Press [Shift + ?] to view the quick reference below. To exit the interface, press [Shift + ?] again.

bmon - Quick Reference

bmon – Quick Reference

To view statistics of a given interface, select it using the Up and Down arrows. However, to monitor a specific interface only, specify it as an argument on the command line as follows.

Suggested Read: 13 Tools to Monitor Linux Performance

The flag -p sets a policy defining which network interfaces to display, in the example below, we will be monitoring the enp1s0 network interface:

$ bmon -p enp1s0

bmon - Monitor Ethernet Bandwidth

bmon – Monitor Ethernet Bandwidth

To use bit per second instead of bytes per second, use the -b flag like so:

$ bmon -bp enp1s0

We can also define the intervals per second with the -r flag as follows:

$ bmon -r 5 -p enp1s0

How to Use bmon Input Modules

bmon has a number of input modules that offer statistical data about interfaces, which includes:

  1. netlink – employs the Netlink protocol to collect interface and traffic control statistics from the kernel. This is the default input module.
  2. proc — reads interface statistics from the /proc/net/dev file. It is considered a legacy interface and offered for backwards compatibly. It is a fallback module in case the Netlink interface is not available.
  3. dummy – this is a programmable input module for debugging and testing purposes.
  4. null – disables data collection.

To find additional info about a module, invoke the it with the “help” option set as follows:

$ bmon -i netlink:help

The next command will invoke bmon with the proc input module enabled:

$ bmon -i proc -p enp1s0

How to Use bmon Output Modules

bmon also uses output modules to display or export the statistical data collected by the input modules above, which includes:

  1. curses – this is an interactive curses based text user interface, it offers real time rate estimations and a graphical representation of each attribute. It is the default output mode.
  2. ascii – is a straightforward programmable text output meant for human consumption. It can display list of interfaces, detailed counters and graphs to the console. It is the default fallback output mode when curses is not available.
  3. format – is a fully scriptable output mode, it’s meant for consumption by other programs-meaning we can use its output values at a later time in scripts or programs for analysis and more.
  4. null – this disables output.

To get more info concerning a module, run the it with the “help” flag set like so:

$ bmon -o curses:help

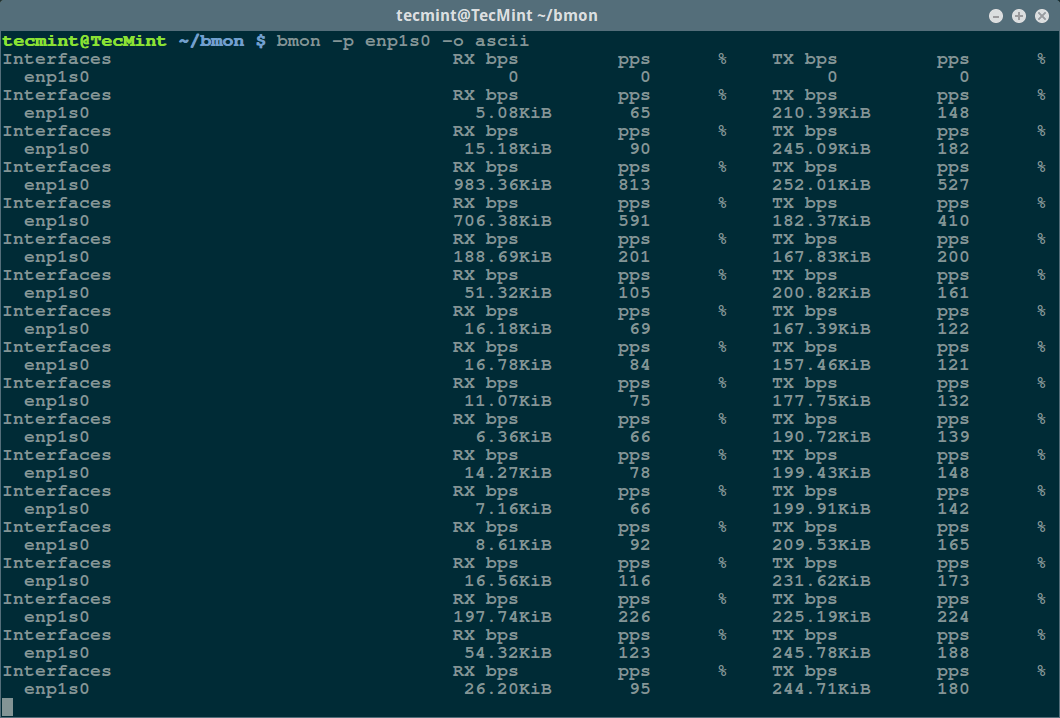
The command that follows will invoke bmon in ascii output mode:

$ bmon -p enp1s0 -o ascii  

bmon - Ascii Output Mode

bmon – Ascii Output Mode

We can run the format output module as well, then use the values obtained for scripting or in another program:

$ bmon -p enp1s0 -o format

bmon - Format Output Mode

bmon – Format Output Mode

For additional usage info, options and examples, read the bmon man page:

$ man bmon 

Visit the bmon Github repository: https://github.com/tgraf/bmon.

That’s all for now, test the various features of bmon in different scenarios and share your thoughts about it with us via the comment section below.

Source

Netdata – A Real-Time Performance Monitoring Tool for Linux Systems

netdata is a extremely optimized Linux utility that provides real-time (per second) performance monitoring for Linux systems, applications, SNMP devices, etc. and shows full interactive charts that absolutely render all collected values over the web browser to analyze them.

Don’t Miss: 20 Useful Command-line Tools to Monitor Linux Performance

It has been developed to be installed on each Linux system, without interrupting the current running applications on it. You can use this tool to monitor and get overview of what is happening in real-time and what just happened, on your Linux systems and applications.

This is what it monitors:

  1. Total and Per Core CPU usage, interrupts, softirqs and frequency.
  2. Total Memory, RAM, Swap and Kernel usage.
  3. Disk I/O (per disk: bandwidth, operations, backlog, utilization, etc).
  4. Monitors Network interfaces including: bandwidth, packets, errors, drops, etc).
  5. Monitors Netfilter / iptables Linux firewall connections, events, errors, etc.
  6. Processes (running, blocked, forks, active, etc).
  7. System Applications with the process tree (CPU, memory, swap, disk reads/writes, threads, etc).
  8. Apache and Nginx Status monitoring with mod_status.
  9. MySQL database monitoring: queries, updates, locks, issues, threads, etc.
  10. Postfix email server message queue.
  11. Squid proxy server bandwidth and requests monitoring.
  12. Hardware sensors (temperature, voltage, fans, power, humidity, etc).
  13. SNMP devices.

netdata Installation on Linux Systems

The latest release of netdata can be easily installed on Arch LinuxGentoo LinuxSolus Linux and Alpine Linuxusing your package manager as shown.

$ sudo pacman -S netdata         [Install Netdata on Arch Linux]
$ sudo emerge --ask netdata      [Install Netdata on Gentoo Linux]
$ sudo eopkg install netdata     [Install Netdata on Solus Linux]
$ sudo apk add netdata           [Install Netdata on Alpine Linux]

On Debian/Ubuntu and RHEL/CentOS/Fedora, there is one line installation script that will install latest netdataand also keep it up to date automatically.

$ bash <(curl -Ss https://my-netdata.io/kickstart.sh            [On 32-bit]
$ bash <(curl -Ss https://my-netdata.io/kickstart-static64.sh)  [On 64-bit]

The above script will:

  • discover the distribution and installs the needed software packages for building netdata (will ask for confirmation).
  • downloads the latest netdata source tree to /usr/src/netdata.git.
  • installs netdata by executing ./netdata-installer.sh from the source tree.
  • installs netdata-updater.sh to cron.daily, so your netdata will be updated daily (you will receive a alert from cron only if the update fails).

Note: The kickstart.sh script progress all its parameters to netdata-installer.sh, so you can define more parameters to modify the installation source, enable/disable plugins, etc.

Alternatively, you can also install latest netdata manually by cloning its repository, but before you start installing netdata, make sure you have these basic build environment packages installed on the system, if not install it using your respective distribution package manager as shown:

On Debian / Ubuntu

# apt-get install zlib1g-dev gcc make git autoconf autogen automake pkg-config

On Centos / Redhat / Fedora

# yum install zlib-devel gcc make git autoconf autogen automake pkgconfig

Next, clone the netdata repository from git and run netdata installer script to build it.

# git clone https://github.com/firehol/netdata.git --depth=1
# cd netdata
# ./netdata-installer.sh

Note: The netdata-installer.sh script will build netdata and install it on your Linux system.

Once the netdata installer finishes, the file /etc/netdata/netdata.conf will be created in your system.

Now it’s time to start netdata by executing the following command from the terminal.

# /usr/sbin/netdata

You can also stop netdata by terminating it’s process with killall command as shown.

# killall netdata

Note: Netdata saves on exit its round robbin database information under /var/cache/netdata file, so that when you start again netdata, it will continue from where it was stopped last time.

Starting and Testing netdata

Now open your browser and navigate to the following address to access the web site for all graphs:

# http://127.0.0.1:19999/

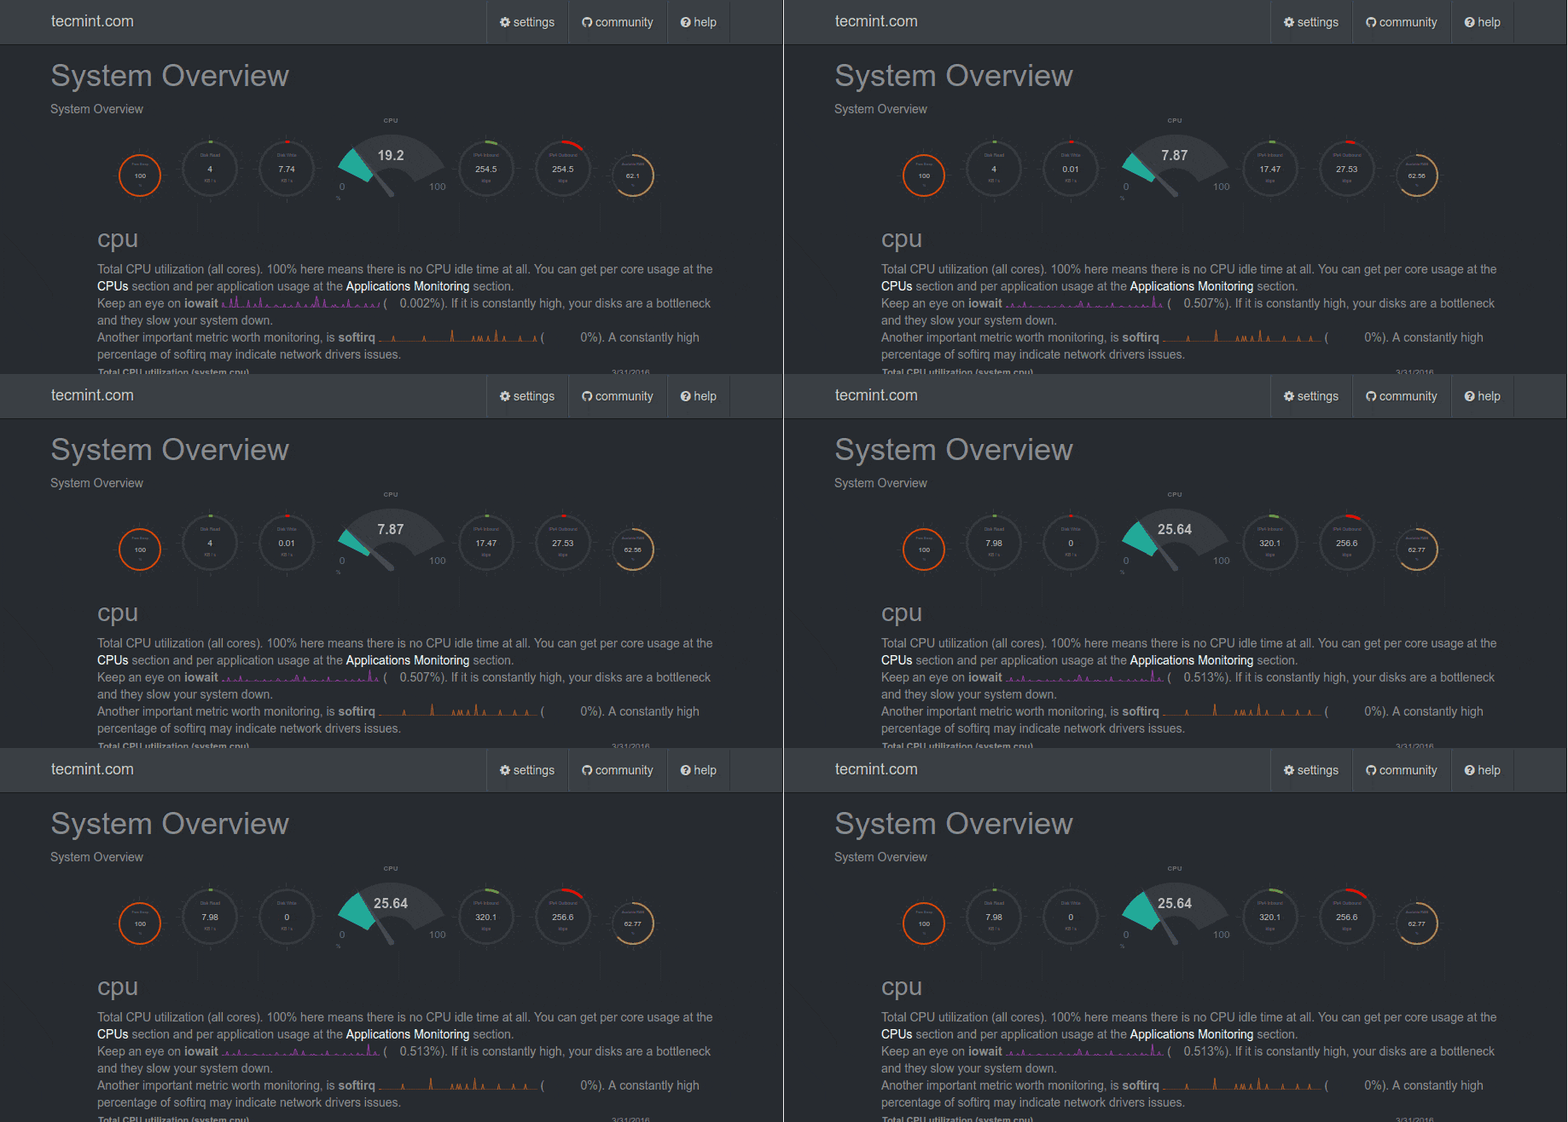
Check out the video that shows how Real-time Linux performance monitoring done here: https://www.youtube.com/watch?v=QIZXS8A4BvI

netdata - Linux Real Time Performance Monitoring

netdata – Linux Real Time Performance Monitoring

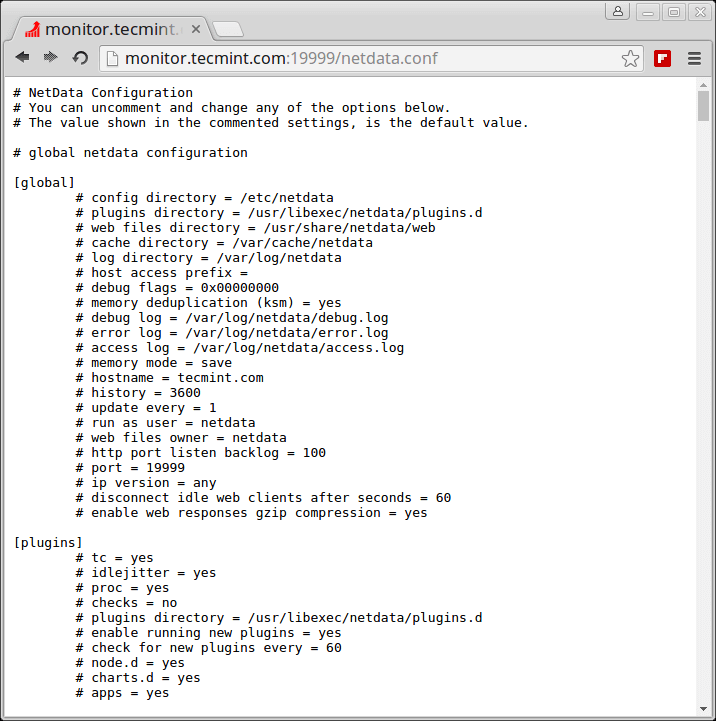
You can also view the running configuration of netdata at any time, by going to:

http://127.0.0.1:19999/netdata.conf

netdata Configuration

netdata Configuration

Updating netdata

You can update netdata daemon to the most recent version by going into netdata.git directory you downloaded before and running:

# cd /path/to/netdata.git
# git pull
# ./netdata-installer.sh

The above netdata installer script will build new version and restart netdata.

Reference: https://github.com/firehol/netdata/

Source

Darkstat – A Web Based Linux Network Traffic Analyzer

Darkstat is a cross-platform, lightweight, simple, real-time network statistics tool that captures network traffic, computes statistics concerning usage, and serves the reports over HTTP.

Darkstat Features:

  • An integrated web-server with deflate compression functionality.
  • Portable, single-threaded and efficient Web based network traffic analyzer.
  • The Web interface shows traffic graphs, reports per host and ports for each host.
  • Supports asynchronous reverse DNS resolution using a child process.
  • Support for IPv6 protocol.

Requirements:

  • libpcap – a portable C/C++ library for network traffic capture.

Being small in size, it uses very low system memory resources and it is easy to install, configure and use in Linux as explained below.

How to Install Darkstat Network Traffic Analyzer in Linux

1. Luckily, darkstat is available in the software repositories of mainstream Linux distributions such as RHEL/CentOS and Debian/Ubuntu.

$ sudo apt-get install darkstat		# Debian/Ubuntu
$ sudo yum install darkstat		# RHEL/CentOS
$ sudo dnf install darkstat		# Fedora 22+

2. After installing darkstat, you need to configure it in the main configuration file /etc/darkstat/init.cfg.

$ sudo vi /etc/darkstat/init.cfg

Note that for the purpose of this tutorial, we will only explain mandatory as well as important configuration options for you to start using this tool.
Now change the value of START_DARKSTAT from no to yes and set the interface darkstat will listen on with the INTERFACE option.

And also uncoment DIR=”/var/lib/darkstat” and DAYLOG=”–daylog darkstat.log” options to specify its directory and log file respectively.

START_DARKSTAT=yes
INTERFACE="-i ppp0"
DIR="/var/lib/darkstat"
# File will be relative to $DIR:
DAYLOG="--daylog darkstat.log"

3. Start the darkstat daemon for now and enable it to start at system boot as follows.

------------ On SystemD ------------ 
$ sudo systemctl start darkstat
$ sudo /lib/systemd/systemd-sysv-install enable darkstat
$ sudo systemctl status darkstat

------------ On SysV Init ------------
$ sudo /etc/init.d/darkstat start
$ sudo chkconfig darkstat on
$ sudo /etc/init.d/darkstat status

4. By default, darkstat listens on port 667, so open the port on firewall to allow access.

------------ On FirewallD ------------
$ sudo firewall-cmd --zone=public --permanent --add-port=667/tcp
$ sudo firewall-cmd --reload

------------ On IPtables ------------
$ sudo iptables -A INPUT -p udp -m state --state NEW --dport 667 -j ACCEPT
$ sudoiptables -A INPUT -p tcp -m state --state NEW --dport 667 -j ACCEPT
$ sudo service iptables save

------------ On UFW Firewall ------------
$ sudo ufw allow 667/tcp
$ sudo ufw reload

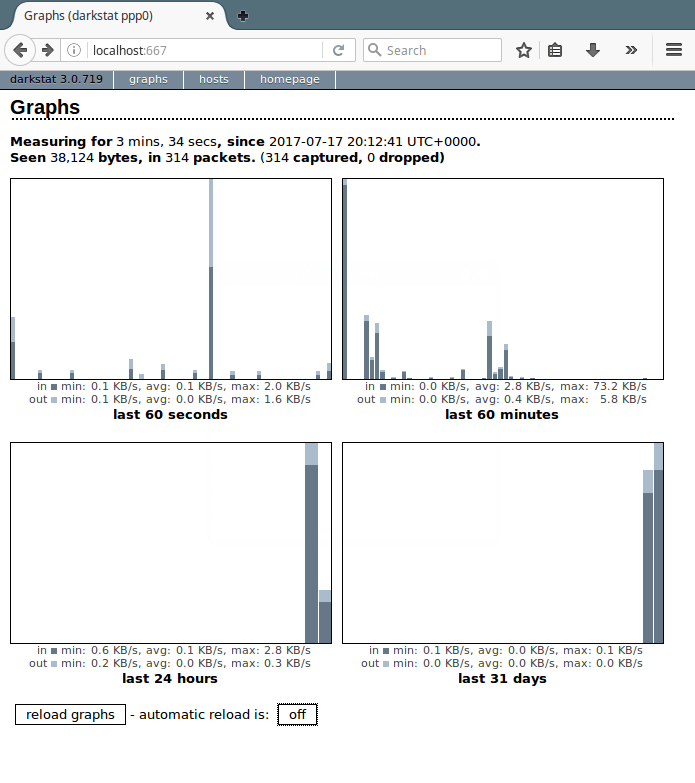
5. Finally access the darkstat web interface by going to URL http://Server-IP:667.

Darkstat Network Traffic Analyzer

Darkstat Network Traffic Analyzer

You can reload graphs automatically by clicking on and off buttons.

Manage Darkstat From Command Line in Linux

Here, we will explain a few important examples of how you can operate darkstat from the command line.

6. To collect network statistics on the eth0 interface, you can use the -i flag as below.

$ darkstat -i eth0

7. To serve web pages on a specific port, include the -p flag like this.

$ darkstat -i eth0 -p 8080

8. To keep an eye on network statistics for a given service, use the -f or filter flag. The specified filter expression in the example below will capture traffic concerned with SSH service.

$ darkstat -i eth0 -f "port 22"

Last but not least, if you want to shut darkstat down in a clean way; it is recommended to send SIGTERM or SIGINT signal to the darkstat parent process.

First get the darkstat parent process ID (PPID) using the pidof command:

$ pidof darkstat

Then kill the process like so:

$ sudo kill -SIGTERM 4790
OR
$ sudo kill -15 4790

For additional usage options, read through the darkstat manpage:

$ man darkstat

Reference Link: Darkstat Homepage

You may also like to read following related articles on Linux network monitoring.

  1. 20 Command Line Tools to Monitor Linux Performance
  2. 13 Linux Performance Monitoring Tools
  3. Netdata – A Real-Time Linux Performance Monitoring Tools
  4. BCC – Dynamic Tools for Linux Performance and Network Monitoring

That’s It! In this article, we have explained how to install and use darkstat in Linux to capture network traffic, calculates usage, and analyze reports over HTTP.

Do you have any questions to ask or thoughts to share, use the comment form below.

Source

6 WC Command Examples to Count Number of Lines, Words, Characters in Linux

The wc (word count) command in Unix/Linux operating systems is used to find out number of newline countword countbyte and characters count in a files specified by the file arguments. The syntax of wc command as shown below.

# wc [options] filenames

The following are the options and usage provided by the command.

wc -l : Prints the number of lines in a file.
wc -w : prints the number of words in a file.
wc -c : Displays the count of bytes in a file.
wc -m : prints the count of characters from a file.
wc -L : prints only the length of the longest line in a file.

So, let’s see how we can use the ‘wc‘ command with their few available arguments and examples in this article. We have used the ‘tecmint.txt‘ file for testing the commands. Let’s find out the output of the file using cat command as shown below.

[root@tecmint ~]# cat tecmint.txt

Red Hat
CentOS
Fedora
Debian
Scientific Linux
OpenSuse
Ubuntu
Xubuntu
Linux Mint
Pearl Linux
Slackware
Mandriva

1. A Basic Example of WC Command

The ‘wc‘ command without passing any parameter will display a basic result of ”tecmint.txt‘ file. The three numbers shown below are 12 (number of lines), 16 (number of words) and 112 (number of bytes) of the file.

[root@tecmint ~]# wc tecmint.txt

12  16 112 tecmint.txt

2. Count Number of Lines

To count number of newlines in a file use the option ‘-l‘, which prints the number of lines from a given file. Say, the following command will display the count of newlines in a file. In the output the first filed assigned as count and second field is the name of file.

[root@tecmint ~]# wc -l tecmint.txt

12 tecmint.txt

3. Display Number of Words

Using ‘-w‘ argument with ‘wc‘ command prints the number of words in a file. Type the following command to count the words in a file.

[root@tecmint ~]# wc -w tecmint.txt

16 tecmint.txt

4. Count Number of Bytes and Characters

When using options ‘-c‘ and ‘-m‘ with ‘wc‘ command will print the total number of bytes and charactersrespectively in a file.

[root@tecmint ~]# wc -c tecmint.txt

112 tecmint.txt
[root@tecmint ~]# wc -m tecmint.txt

112 tecmint.txt

5. Display Length of Longest Line

The ‘wc‘ command allow an argument ‘-L‘, it can be used to print out the length of longest (number of characters) line in a file. So, we have the longest character line (‘Scientific Linux‘) in a file.

[root@tecmint ~]# wc -L tecmint.txt

16 tecmint.txt

6. Check More WC Options

For more information and help on the wc command, simple run the ‘wc –help‘ or ‘man wc‘ from the command line.

[root@tecmint ~]# wc --help

Usage: wc [OPTION]... [FILE]...
  or:  wc [OPTION]... --files0-from=F
Print newline, word, and byte counts for each FILE, and a total line if
more than one FILE is specified.  With no FILE, or when FILE is -,
read standard input.
  -c, --bytes            print the byte counts
  -m, --chars            print the character counts
  -l, --lines            print the newline counts
  -L, --max-line-length  print the length of the longest line
  -w, --words            print the word counts
      --help			display this help and exit
      --version			output version information and exit

Report wc bugs to bug-coreutils@gnu.org
GNU coreutils home page: <http://www.gnu.org/software/coreutils/>
General help using GNU software: <http://www.gnu.org/gethelp/>
For complete documentation, run: info coreutils 'wc invocation'

Source

How to Setup DHCP Server and Client on CentOS and Ubuntu

DHCP (short for Dynamic Host Configuration Protocol) is a client/server protocol that enables a server to automatically assign an IP address and other related configuration parameters (such as the subnet mask and default gateway) to a client on a network.

DHCP is important because it prevents a system or network administrator from manually configuring IP addresses for new computers added to the network or computers that are moved from one subnet to another.

The IP address assigned by a DHCP server to a DHCP client is on a “lease”, the lease time normally varies depending on how long a client computer is likely to require the connection or the DHCP configuration.

In this article, we will explain how to configure a DHCP server in CentOS and Ubuntu Linux distributions to assign IP address automatically to a client machine.

Installing DHCP Server in CentOS and Ubuntu

The DCHP server package is available in the official repositories of mainstream Linux distributions, installing is quite easy, simply run the following command.

# yum install dhcp		        #CentOS
$ sudo apt install isc-dhcp-server	#Ubuntu

Once the installation is complete, configure the interface on which you want the DHCP daemon to serve requests in the configuration file /etc/default/isc-dhcp-server or /etc/sysconfig/dhcpd.

# vim /etc/sysconfig/dhcpd		 #CentOS
$ sudo vim /etc/default/isc-dhcp-server	 #Ubuntu

For example, if you want the DHCPD daemon to listen on eth0, set it using the following directive.

DHCPDARGS=”eth0”

Save the file and exit.

Configuring DHCP Server in CentOS and Ubuntu

The main DHCP configuration file is located at /etc/dhcp/dhcpd.conf, which should contain settings of what to do, where to do something and all network parameters to provide to the clients.

This file basically consists of a list of statements grouped into two broad categories:

  • Global parameters: specify how to carry out a task, whether to carry out a task, or what network configuration parameters to provide to the DHCP client.
  • Declarations: define the network topology, state a clients is in, offer addresses for the clients, or apply a group of parameters to a group of declarations.

Now, open and edit the configuration file to configure your DHCP server.
------------ On CentOS ------------ 
# cp /usr/share/doc/dhcp-4.2.5/dhcpd.conf.example /etc/dhcp/dhcpd.conf	
# vi /etc/dhcp/dhcpd.conf	

------------ On Ubuntu ------------
$ sudo vim /etc/dhcp/dhcpd.conf				

Start by defining the global parameters which are common to all supported networks, at the top of the file. They will apply to all the declarations:

option domain-name "tecmint.lan";
option domain-name-servers ns1.tecmint.lan, ns2.tecmint.lan;
default-lease-time 3600; 
max-lease-time 7200;
authoritative;

Next, you need to define a sub-network for an internal subnet i.e 192.168.1.0/24 as shown.

subnet 192.168.1.0 netmask 255.255.255.0 {
        option routers                  192.168.1.1;
        option subnet-mask              255.255.255.0;
        option domain-search            "tecmint.lan";
        option domain-name-servers      192.168.1.1;
        range   192.168.10.10   192.168.10.100;
        range   192.168.10.110   192.168.10.200;
}

Note that hosts which require special configuration options can be listed in host statements (see the dhcpd.conf man page).

Now that you have configured your DHCP server daemon, you need to start the service for the mean time and enable it to start automatically from the next system boot, and check if its up and running using following commands.

------------ On CentOS ------------ 
# systemctl start dhcpd
# systemctl enable dhcpd

------------ On Ubuntu ------------
$ sudo systemctl start isc-dhcp-server
$ sudo systemctl enable isc-dhcp-server

Next, permit requests to the DHCP daemon on Firewall, which listens on port 67/UDP, by running.

------------ On CentOS ------------ 
# firewall-cmd --zone=public --permanent --add-service=dhcp
# firewall-cmd --reload 

#------------ On Ubuntu ------------
$ sudo ufw allow 67/udp
$ sudo ufw reload

Configuring DHCP Clients

Finally, you need to test if the DHCP server is working fine. Logon to a few client machines on the network and configure them to automatically receive IP addresses from the server.

Modify the appropriate configuration file for the interface on which the clients will auto-receive IP addresses.
DHCP Client Setup on CentOS

On CentOS, the interface config files ate located at /etc/sysconfig/network-scripts/.

# vim /etc/sysconfig/network-scripts/ifcfg-eth0

Add the options below:

DEVICE=eth0
BOOTPROTO=dhcp
TYPE=Ethernet
ONBOOT=yes

Save the file and restart network service (or reboot the system).

# systemctl restart network

DHCP Client Setup on Ubuntu

On Ubuntu 16.04, you can configure all interface in the config file /etc/network/interfaces.

   
$ sudo vi /etc/network/interfaces

Add these lines in it:

auto  eth0
iface eth0 inet dhcp

Save the file and restart network services (or reboot the system).

$ sudo systemctl restart networking

On Ubuntu 18.04, networking is controlled by the Netplan program. You need to edit the appropriate file under the directory /etc/netplan/, for example.

$ sudo vim /etc/netplan/01-netcfg.yaml 

Then enable dhcp4 under a specific interface for example under ethernetsens0, and comment out static IP related configs:

network:
  version: 2
  renderer: networkd
  ethernets:
    ens0:
      dhcp4: yes

Save the changes and run the following command to effect the changes.

$ sudo netplan apply 

For more information, see the dhcpd and dhcpd.conf man pages.

$ man dhcpd
$ man dhcpd.conf

In this article, we have explained how to configure a DHCP server in CentOS and Ubuntu Linux distributions. If you need more clarification on any point, you can ask a question via the feedback form below, or simply share your comments with us.

Source

Installing ProFTPD Server on RHEL/CentOS 7

ProFTPD is an Open Source FTP Server and one of the most used, secure and reliable file transfer daemons on Unix environments, due to its file configurations simplicity speed and easy setup.

Install Proftpd In CentOS 7

Install Proftpd In RHEL/CentOS 7

Requirements

  1. CentOS 7 Minimal Installation
  2. Red Hat Enterprise Linux 7 Installation
  3. Configure Static IP Address on System

This tutorial will guide you on how you can install and use ProFTPD Server on CentOS/RHEL 7 Linux distributions for a simple file transfer from your local system accounts to remote systems.

Step 1: Install Proftpd Server

1. Official RHEL/CentOS 7 repositories doesn’t provide any binary package for ProFTPD Server, so you need to add extra package repositories on your system provided by EPEL 7 Repo, using the following command.

# rpm -Uvh http://ftp.astral.ro/mirrors/fedora/pub/epel/beta/7/x86_64/epel-release-7-0.2.noarch.rpm

Install EPEL in CentOS 7

Install EPEL in RHEL/CentOS 7

2. Before you start installing ProFTPD Server, edit your machine hosts file, change it accordingly to your system FQDN and test the configurations to reflect your system domain naming.

# nano /etc/hosts

Here add your system FQDN on 127.0.0.1 localhost line like in the following example.

127.0.0.1 server.centos.lan localhost localhost.localdomain

Then edit /etc/hostname file to match the same system FQDN entry like in the screenshots below.

# nano /etc/hostname

Open Hostname File

Open Hostname File

Add Hostname in Hosts

Add Hostname in Hosts

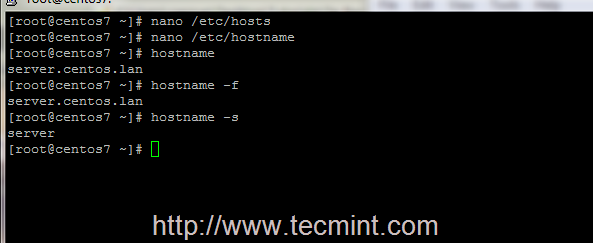
3. After you have edited the host files, test your local DNS resolution using the following commands.

# hostname
# hostname -f    	## For FQDN
# hostname -s    	## For short name

How to Check Hostname in CentOS

Verify System Hostname

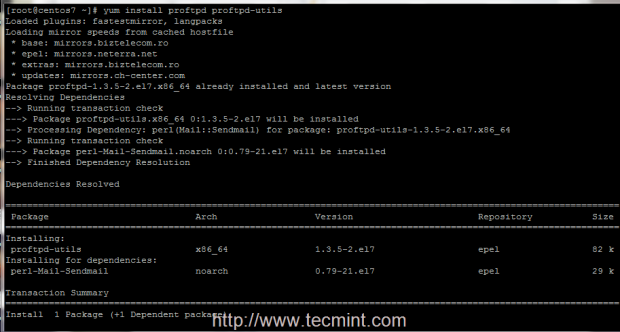
4. Now it’s time to install ProFTPD Server on your system and some required ftp utilities that we will be using later by issuing following command.

# yum install proftpd proftpd-utils

Install FTP in CentOS

Install Proftpd Server

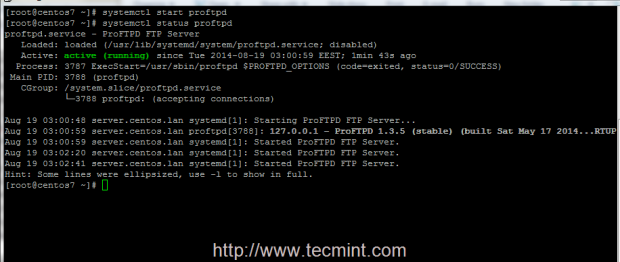
5. After the server is installed, start and manage Proftpd daemon by issuing the following commands.

# systemctl start proftpd
# systemctl status proftpd
# systemctl stop proftpd
# systemctl restart proftpd

Start Proftpd Server

Start Proftpd Server

Step 2: Add Firewall Rules and Access Files

6. Now, your ProDTPD Server runs and listen for connections, but it’s not available for outside connections due to Firewall policy. To enable outside connections make sure you add a rule which opens port 21, using firewall-cmd system utility.

# firewall-cmd –add-service=ftp   ## On fly rule
# firewall-cmd –add-service=ftp   --permanent   ## Permanent rule
# systemctl restart firewalld.service 

Open FTP Port in CentOS

Open Proftp Port in Firewall

7. The most simple way to access your FTP server from remote machines is by using a browser, redirecting to your server IP Address or domain name using ftp protocol on URL.

ftp://domain.tld

OR 

ftp://ipaddress 

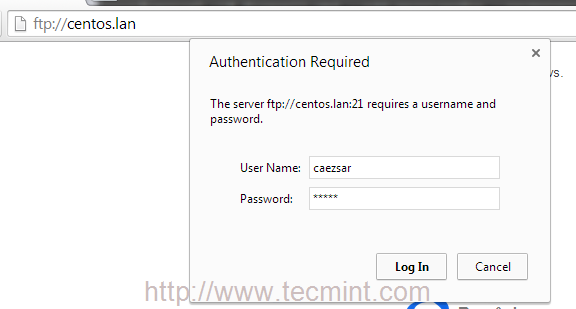
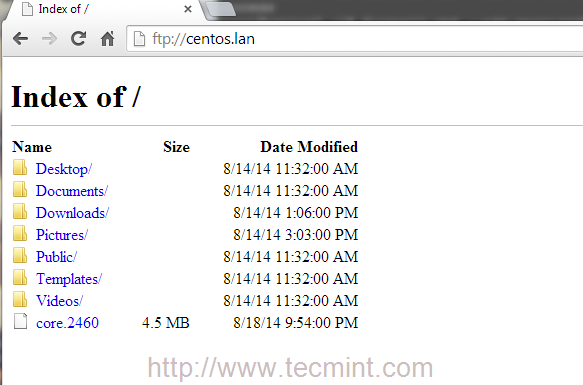
8. The default configuration on Proftpd Server uses valid system local accounts credentials to login and access your account files which is your $HOME system path account, defined in /etc/passwd file.

Access Proftpd from Browser

Access Proftpd from Browser

Index of Proftpd Files

Index of Proftpd Files

9. To make ProFTPD Server automatically run after system reboot, aka enable it system-wide, issue the following command.

# systemctl enable proftpd

That’s it! Now you can access and manage your account files and folders using FTP protocol using whether a browser or other more advanced programs, such as FileZilla, which is available on almost any platforms, or WinSCP, an excellent File Transfer program that runs on Windows based systems.

Suggested Read: How to Install, Configure and Secure FTP Server in CentOS 7

On the next series of tutorials concerning ProFTPD Server on RHEL/CentOS 7, I shall discuss more advanced features like enabling Anonymous accountuse TLS encrypted file transfers and adding Virtual Users.

Source

WP2Social Auto Publish Powered By : XYZScripts.com