HAProxy stands for High Availability proxy. It is a Free and open source application written in C programming Language. HAProxy application is used as TCP/HTTP Load Balancer and for proxy Solutions. The most common use of the HAProxy application is to distribute the workload across multiple servers e.g., web server, database server, etc thus improving the overall performance and reliability of server environment.
The highly efficient and fast application is used by many of the world’s reputed organization which includes but not limited to – Twitter, Reddit, GitHub and Amazon. It is available for Linux, BSD, Solaris and AIX platform.

Install HAProxy Load Balancer in Linux
In this tutorial, we will discuss the process of setting up a high availability load balancer using HAProxy to control the traffic of HTTP-based applications (web servers) by separating requests across multiple servers.
For this article, we’re using the most recent stable release of HAProxy version i.e. 1.5.10 released on December 31st 2014. And also we’re using CentOS 6.5 for this setup, but the below given instructions also works on CentOS/RHEL/Fedora and Ubuntu/Debian distributions.
My Environment Setup
Here our load-balancer HAProxy server having hostname as websrv.tecmintlocal.com with IP address 192.168.0.125.
HAProxy Server Setup
Operating System	:	CentOS 6.5
IP Address		: 	192.168.0.125
Hostname		: 	websrv.tecmintlocal.com
Client Web Servers Setup
The other four machines are up and running with web servers such as Apache.
Web Server #1 :	CentOS 6.5 [IP: 192.168.0.121] - [hostname: web1srv.tecmintlocal.com]
Web Server #2 :	CentOS 6.5 [IP: 192.168.0.122] - [hostname: web2srv.tecmintlocal.com]
Web Server #3 :	CentOS 6.5 [IP: 192.168.0.123] - [hostname: web3srv.tecmintlocal.com]
Web Server #4 :	CentOS 6.5 [IP: 192.168.0.124] - [hostname: web4srv.tecmintlocal.com]
Step 1: Installing Apache on Client Machines
1. First we have to install Apache in all four server’s and share any one of site, for installing Apache in all four server’s here we going to use following command.
# yum install httpd		[On RedHat based Systems]
# apt-get install apache2	[On Debian based Systems]
2. After installing Apache web server on all four client machines, you can verify anyone of the server whether Apache is running by accessing it via IP address in browser.
http://192.168.0.121
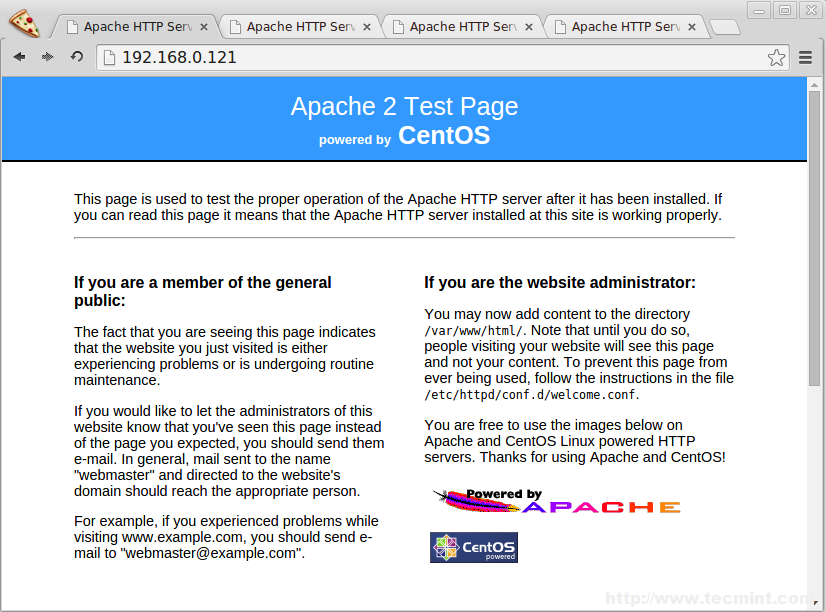
Check Apache Status
Step 2: Installing HAProxy Server
3. In most of the today’s modern Linux distributions, HAPRoxy can be easily installed from the default base repository using default package manager yum or apt-get.
For example, to install HAProxy on RHEL/CentOS/Fedora and Debian/Ubuntu versions, run the following command. Here I’ve included openssl package too, because we’re going to setup HAProxy with SSL and NON-SSL support.
# yum install haproxy openssl-devel	[On RedHat based Systems]
# apt-get install haproxy		[On Debian based Systems]
Note: On Debian Whezzy 7.0, we need to enable the backports repository by adding a new file backports.listunder “/etc/apt/sources.list.d/” directory with the following content.
# echo "deb http://cdn.debian.net/debian wheezy-backports main" >> /etc/apt/sources.list.d/backports.list
Next, update the repository database and install HAProxy.
# apt-get update
# apt-get install haproxy -t wheezy-backports
Step 3: Configure HAProxy Logs
4. Next, we need to enable logging feature in HAProxy for future debugging. Open the main HAProxy configuration file ‘/etc/haproxy/haproxy.cfg‘ with your choice of editor.
# vim /etc/haproxy/haproxy.cfg
Next, follow the distro-specific instructions to configure logging feature in HAProxy.
On RHEL/CentOS/Fedora
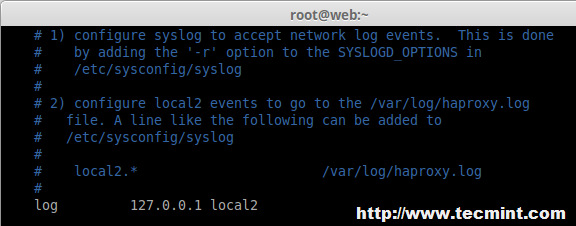
Under #Global settings, enable the following line.
log 127.0.0.1 local2
On Ubuntu/Debian
Under #Global settings, replace the following lines,
log /dev/log        local0
log /dev/log        local1 notice
With,
log 127.0.0.1 local2
Enable HAProxy Logging
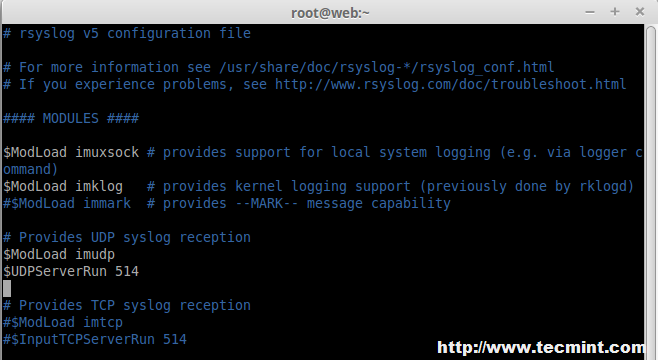
5. Next, we need to enable UDP syslog reception in ‘/etc/rsyslog.conf‘ configuration file to separate log files for HAProxy under /var/log directory. Open your your ‘rsyslog.conf‘ file with your choice of editor.
# vim /etc/rsyslog.conf
Uncommnet ModLoad and UDPServerRun, Here our Server will listen to Port 514 to collect the logs into syslog.
# Provides UDP syslog reception
$ModLoad imudp
$UDPServerRun 514
Configure HAProxy Logging
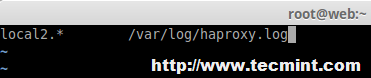
6. Next, we need to create a separate file ‘haproxy.conf‘ under ‘/etc/rsyslog.d/‘ directory to configure separate log files.
# vim /etc/rsyslog.d/haproxy.conf
Append following line to the newly create file.
local2.* /var/log/haproxy.log
HAProxy Logs
Finally, restart the rsyslog service to update the new changes.
# service rsyslog restart
Step 4: Configuring HAProxy Global Settings
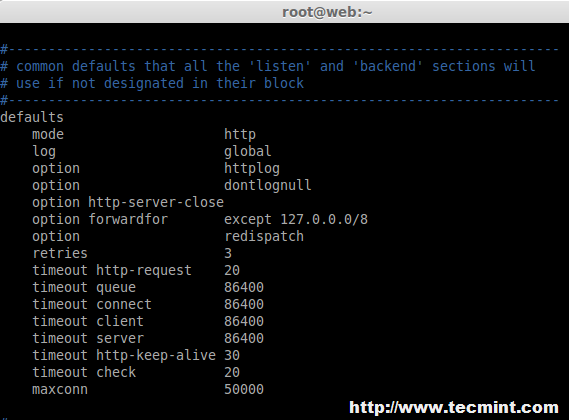
7. Now, here we need to set default variables in ‘/etc/haproxy/haproxy.cfg‘ for HAProxy. The changes needs to make for default under default section as follows, Here some of the changes like timeout for queue, connect, client, server and max connections need to be defined.
In this case, I suggest you to go through the HAProxy man pages and tweak it as per your requirements.
#---------------------------------------------------------------------
defaults
    mode                    http
    log                     global
    option                  httplog
    option                  dontlognull
    option http-server-close
    option forwardfor       except 127.0.0.0/8
    option                  redispatch
    retries                 3
    timeout http-request    20
    timeout queue           86400
    timeout connect         86400
    timeout client          86400
    timeout server          86400
    timeout http-keep-alive 30
    timeout check           20
    maxconn                 50000
HAProxy Default Settings
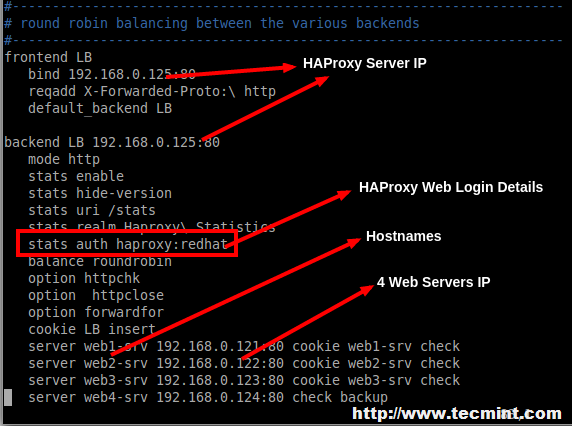
8. Then we need to define front-end and back-end as shown below for Balancer in ‘/etc/haproxy/haproxy.cfg‘ global configuration file. Make sure to replace the IP addresses, hostnames and HAProxy login credentials as per your requirements.
frontend LB
   bind 192.168.0.125:80
   reqadd X-Forwarded-Proto:\ http
   default_backend LB

backend LB 192.168.0.125:80
   mode http
   stats enable
   stats hide-version
   stats uri /stats
   stats realm Haproxy\ Statistics
   stats auth haproxy:redhat		# Credentials for HAProxy Statistic report page.
   balance roundrobin			# Load balancing will work in round-robin process.
   option httpchk
   option  httpclose
   option forwardfor
   cookie LB insert
   server web1-srv 192.168.0.121:80 cookie web1-srv check		# backend server.
   server web2-srv 192.168.0.122:80 cookie web2-srv check		# backend server.
   server web3-srv 192.168.0.123:80 cookie web3-srv check		# backend server.
   server web4-srv 192.168.0.124:80 check backup			# backup fail-over Server, If three of the above fails this will be activated.
HAProxy Global Configuration
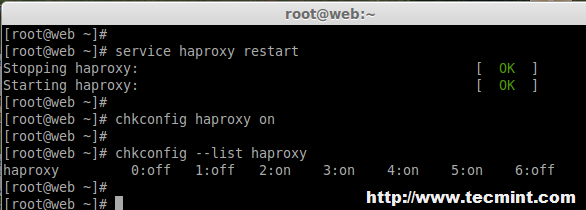
9. After adding above settings, our load balancer can be accessed at ‘http://192.168.0.125/stats‘ with HTTP authentication using login name as ‘haproxy‘ and password ‘redhat‘ as mentioned in the above settings, but you can replace them with your own credentials.
# service haproxy restart
# chkconfig haproxy on
# chkconfig --list haproxy
Start HAProxy
For Ubuntu/Debian users to need to set “ENABLED” option to “1” in ‘/etc/default/haproxy‘ file.
ENABLED=1
Step 5: Verify HAProxy Load Balancer
11. Now it’s time to access our Load balancer URL/IP and verify for the site whether loading. Let me put one HTML file in all four servers. Create a file index.html in all four servers in web servers document root directory and add the following content to it.
<html>
<head>
  <title>Tecmint HAProxy Test Page</title>
</head>

<body>
<!-- Main content -->
<h1>My HAProxy Test Page</h1>

<p>Welcome to HA Proxy test page!

<p>There should be more here, but I don't know
what to be write :p.

<address>Made 11 January 2015<br>
  by Babin Lonston.</address>

</body>
</html>
12. After creating ‘index.html‘ file, now try to access the site and see whether I can able access the copied html file.
http://192.168.0.125/

Verify HAProxy Load Balancer
Site has been successfully accessed.
Step 6: Verify Statistic of Load Balancer
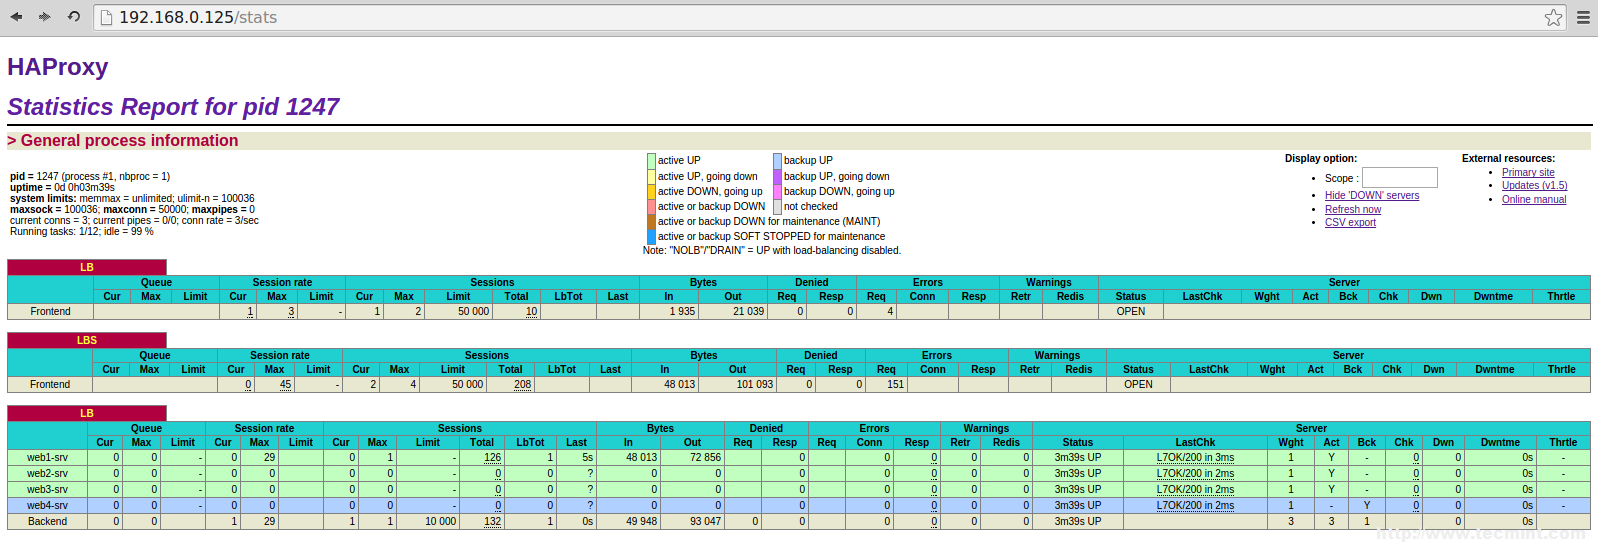
13. To get the statistic page of HAProxy, you can use the following link. While asking for Username and password we have to provide the haproxy/redhat.
http://192.168.0.125/stats
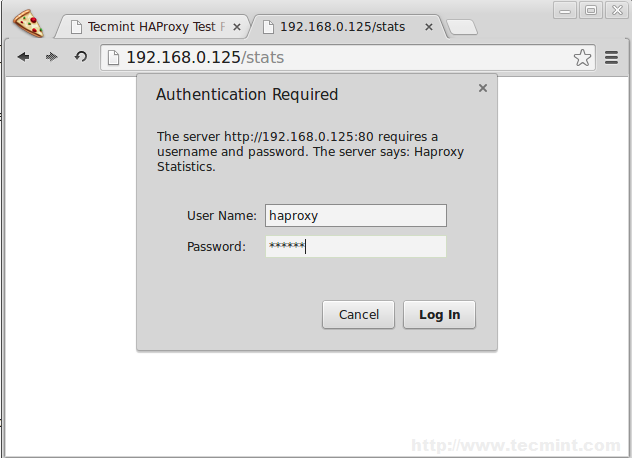
HAProxy Statistics Login
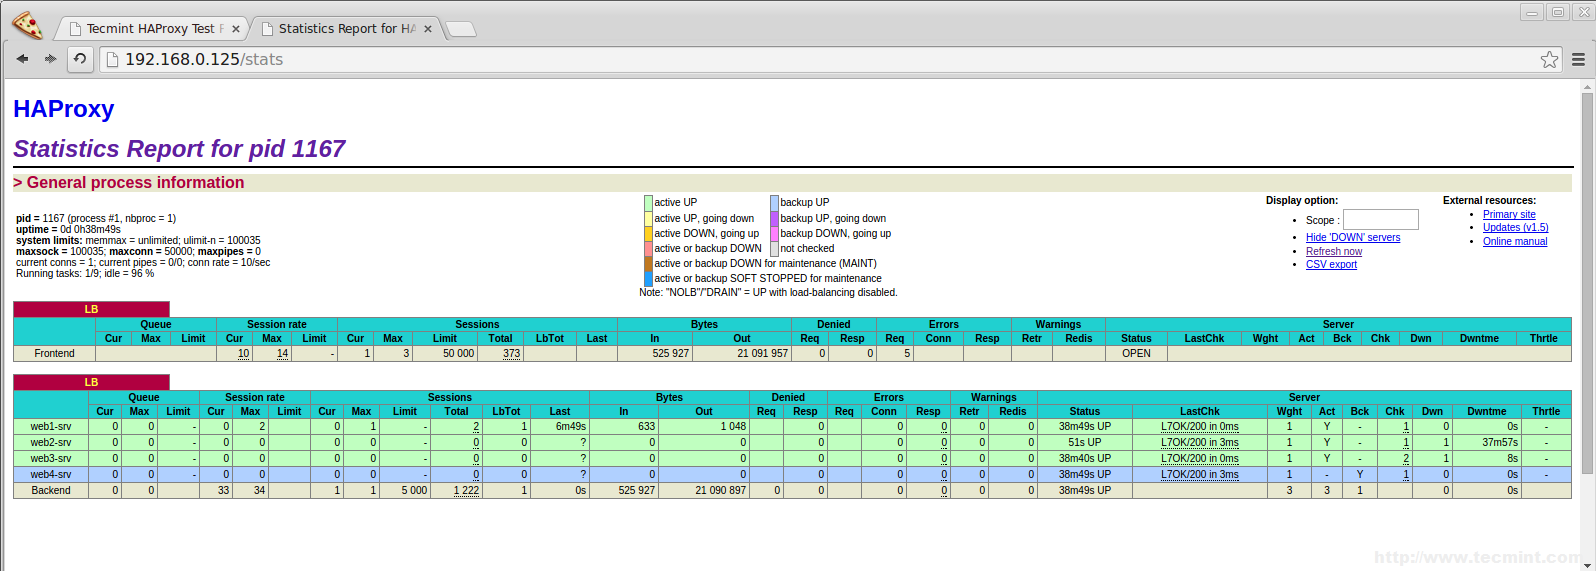
HAProxy Statistics
Step 7: Enabling SSL in HAProxy
14. To enable SSL in HAProxy, you need to install mod_ssl package for creating SSL Certificate for HAProxy.
On RHEL/CentOS/Fedora
To install mod_ssl run the following command
# yum install mod_ssl -y
On Ubuntu/Debian
By default under Ubuntu/Debian SSL support comes standard with Apache package. We just need to enable it..
# a2enmod ssl
After you’ve enabled SSL, restart the Apache server for the change to be recognized.
# service apache2 restart
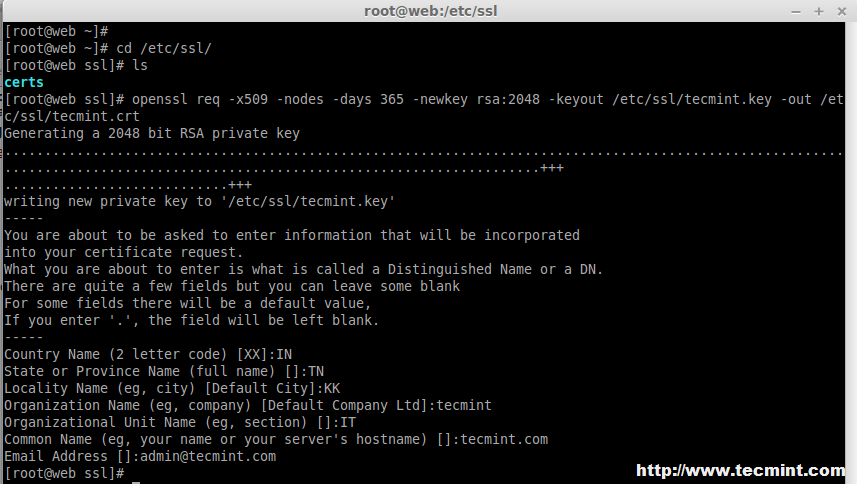
15. After restarting, Navigate to the SSL directory and create SSL certificate using following commands.
# cd /etc/ssl/
# openssl req -x509 -nodes -days 365 -newkey rsa:2048 -keyout /etc/ssl/tecmint.key -out /etc/ssl/tecmint.crt
# cat tecmint.crt tecmint.key > tecmint.pem
Create SSL for HAProxy
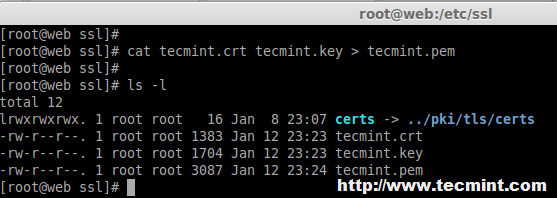
SSL Certificate for HAProxy
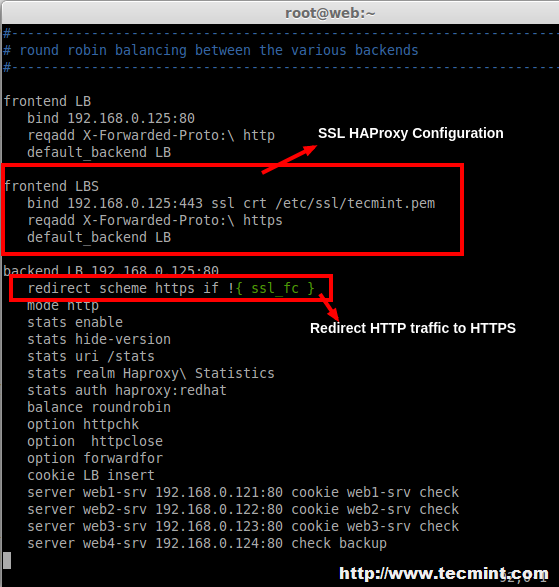
16. Open and edit the haproxy configuration and add the SSL front-end as below.
# vim /etc/haproxy/haproxy.cfg
Add the following configuration as frontend.
frontend LBS
   bind 192.168.0.125:443 ssl crt /etc/ssl/tecmint.pem
   reqadd X-Forwarded-Proto:\ https
   default_backend LB
17. Next, add the redirect rule in backend configuration.
redirect scheme https if !{ ssl_fc }
Enable SSL on HAProxy
18. After making above changes, make sure to restart the haproxy service.
# service haproxy restart
While restarting if we get the below warning, we can fix it by adding a parameter in Global Section of haproxy.
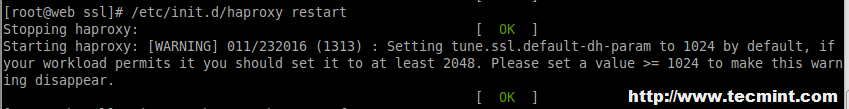
SSL HAProxy Error
tune.ssl.default-dh-param 2048
19. After restarting, try to access the site 192.168.0.125, Now it will forward to https.
http://192.168.0.25
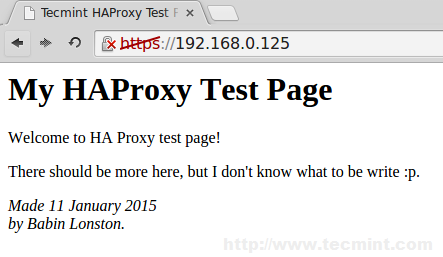
Verify SSL HAProxy
SSL Enabled HAProxy
20. Next, verify the haproxy.log under ‘/var/log/‘ directory.
# tail -f /var/log/haproxy.log
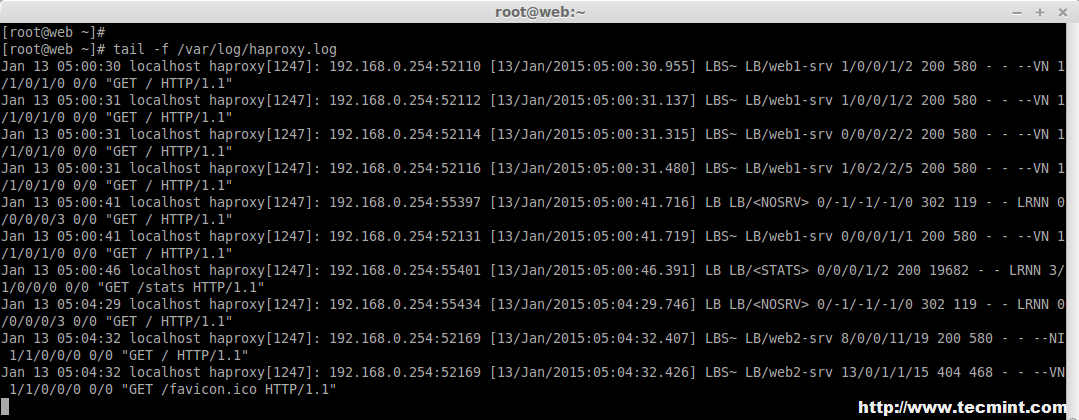
Check HAProxy Logs
Step 8: Open HAProxy Ports on Firewall
21. Open the port’s for web service and Log reception UDP port using below rules.
On CentOS/RHEL 6
iptables -A INPUT -m state --state ESTABLISHED,RELATED -j ACCEPT
iptables -A INPUT -i eth0 -p udp --dport 514 -j ACCEPT
iptables -A INPUT -i eth0 -p tcp --dport 80 -m state --state NEW,ESTABLISHED -j ACCEPT
iptables -A INPUT -i eth0 -p tcp --dport 443 -m state --state NEW,ESTABLISHED -j ACCEPT
On CentOS/RHEL 7 and Fedora 21
# firewallcmd permanent zone=public addport=514/tcp # firewallcmd permanent zone=public addport=80/tcp # firewallcmd permanent zone=public addport=443/tcp # firewallcmd reload
On Debian/Ubuntu
Add the following line to ‘/etc/iptables.up.rules‘ to enable ports on firewall.
A INPUT p tcp dport 514 j ACCEPT A INPUT p tcp dport 80 j ACCEPT A INPUT p tcp dport 443 j ACCEPT
Conclusion
In this article, we’ve installed Apache in 4 server’s and shared a website for reducing the traffic load. I Hope this article will help you to setup a Load Balancer for web server’s using HAProxy and make your applications more stable and available
If you have any questions regarding the article, feel free to post your comments or suggestions, I will love to help you out in whatever the best way I can.