Monitorix is an open source, free and most powerful lightweight tool designed to monitor system and network resources in Linux. It regularly collects system and network data and display the information in graphs using its own web interface. Monitorix allows to monitor overall system performance and also help in detecting bottlenecks, failures, unwanted long response times and other abnormal activities.
Monitorix – Linux System and Network Monitoring Tool
It is written in Perl language and licensed under the terms of GNU (General Public License) as published by the FSP (Free Software Foundation). It uses RRDtool to generate graphs and display them using web interface.
This tool is specifically created for monitoring Red Hat, CentOS, Fedora based Linux systems, but today it runs on many different flavors of GNU/Linux distributions and even it runs on UNIX systems like OpenBSD, NetBSDand FreeBSD.
The development of Monitorix is currently in active state and adding new features, new graphs, new updates and fixing bugs to offer a great tool for Linux system/network administration.
Monitorix Features
- System load average, active processes, per-processor kernel usage, global kernel usage and memory allocation.
- Monitors Disk drive temperatures and health.
- Filesystem usage and I/O activity of filesystems.
- Network traffic usage up to 10 network devices.
- System services including SSH, FTP, Vsftpd, ProFTP, SMTP, POP3, IMAP, POP3, VirusMail and Spam.
- MTA Mail statistics including input and output connections.
- Network port traffic including TCP, UDP, etc.
- FTP statistics with log file formats of FTP servers.
- Apache statistics of local or remote servers.
- MySQL statistics of local or remote servers.
- Squid Proxy Web Cache statistics.
- Fail2ban statistics.
- Monitor remote servers (Multihost).
- Ability to view statistics in graphs or in plain text tables per day, week, month or year.
- Ability to zoom graphs for better view.
- Ability to define the number of graphs per row.
- Built-in HTTP server.
For a full list of new features and updates, please check out the official feature page.
Installing Monitorix on a RHEL/CentOS/Fedora Linux
First, install following required packages.
# yum install rrdtool rrdtool-perl perl-libwww-perl perl-MailTools perl-MIME-Lite perl-CGI perl-DBI perl-XML-Simple perl-Config-General perl-HTTP-Server-Simple perl-IO-Socket-SSL wget
If in case yum fails to installing one or more of above packages, then you could enable following additional repositories to install them.
Next, download the latest version of ‘Monitorix‘ package using wget command.
# wget http://www.monitorix.org/monitorix-3.10.1-1.noarch.rpm
Once successfully downloaded, install it using the rpm command.
# rpm -ivh monitorix-3.10.1-1.noarch.rpm
Preparing...                ########################################### [100%]
   1:monitorix              ########################################### [100%]
Once successfully installed, please have a look at the main configuration file ‘/etc/monitorix.conf‘ to add some extra settings according to your system and enable or disable graphs.
Finally, add Monitorix service to system start-up and start the service with following commands.
# chkconfig --level 35 monitorix on
# service monitorix start
# systemctl start monitorix       [On RHEL/CentOS 7 and Fedora 22+ versions ]
Once, you’ve started service, the program will start collecting system information according to configuration set in ‘/etc/monitorix.conf‘ file, and after few minutes you will start seeing system graphs from your browser at.
http://localhost:8080/monitorix/
If you have SELinux in enabled state, then graphs are not visible and you will get tons of error messages in ‘/var/log/messages‘ or ‘/var/log/audit/audit.log‘ file about access denied to RRD database files. To get rid of such errors messages and visible graphs, you need to disable SELinux.
To Turn Off SELinux, simple changing the line “enforcing” to “disabled” in ‘/etc/selinux/config’ file.
SELINUX=disabled
The above will disable SELinux temporarily, until you reboot the machine. If you want the system to start in always disable mode, you need to reboot the system.
Installing Monitorix on a Ubuntu/Debian/Linux Mint
The Monitorix installation can be done in two-ways, using Izzy repository for automatic installation/updates and another using manually download and install .deb package.
The Izzy repository is an experimental repository but the packages from this repository should work on all versions of Ubuntu, Debian, etc. However, no warranties are given – So, the risk is all yours. If you still want to add this repository for automatic updates via apt-get, simply follow the steps provided below for automatic installation.
Automatic Installation Using Izzy Repository
Add the following line to your ‘/etc/apt/sources.list’ file.
deb http://apt.izzysoft.de/ubuntu generic universe
Get GPG key for this repository, you can get it using wget command.
# wget http://apt.izzysoft.de/izzysoft.asc
Once downloaded, add this GPG key to apt configuration by using the command ‘apt-key‘ as shown below.
# apt-key add izzysoft.asc
Finally, install the package via the repository.
# apt-get update
# apt-get install monitorix
Manual Installation Using .Deb Package
Manually, downloading latest version of .deb package and install it with taking care of required dependencies as shown below.
# apt-get update
# apt-get install rrdtool perl libwww-perl libmailtools-perl libmime-lite-perl librrds-perl libdbi-perl libxml-simple-perl libhttp-server-simple-perl libconfig-general-perl libio-socket-ssl-perl
# wget http://www.monitorix.org/monitorix_3.10.1-izzy1_all.deb
# dpkg -i monitorix_3.10.1-izzy1_all.deb
During installation, a web server configuration takes place. So, you need to reload the Apache web server to reflect new configuration.
# service apache2 restart         [On SysVinit]
# systemctl restart apache2       [On SystemD]
Monitorix comes with a default configuration, if you wish to change or adjust some settings take a look at the configuration file at ‘/etc/monitorix.conf‘. Once you’ve done changes reload the service for new configuration to take effect.
# service monitorix restart         [On SysVinit]
# systemctl restart monitorix       [On SystemD]
Now point your browser to ‘http://localhost:8080/monitorix‘ and start watching graphs of your system. It can be accessed from localhost only, if you wish to allow access to remote IP’s. Simply open the ‘/etc/apache2/conf.d/monitorix.conf‘ file and add IP’s to the ‘Allow from‘ clause. For example see below.
<Directory /usr/share/monitorix/cgi-bin/>
        DirectoryIndex monitorix.cgi
        Options ExecCGI
        Order Deny,Allow
        Deny from all
        Allow from 172.16.16.25
</Directory>
After you made changes to above configuration, do not forget to restart Apache.
# service apache2 restart         [On SysVinit]
# systemctl restart apache2       [On SystemD]
Monitorix Screenshots
Please check out the following are some screenshots.
Monitorix Homepage

Monitorix Homepage
Monitor Linux Load Average
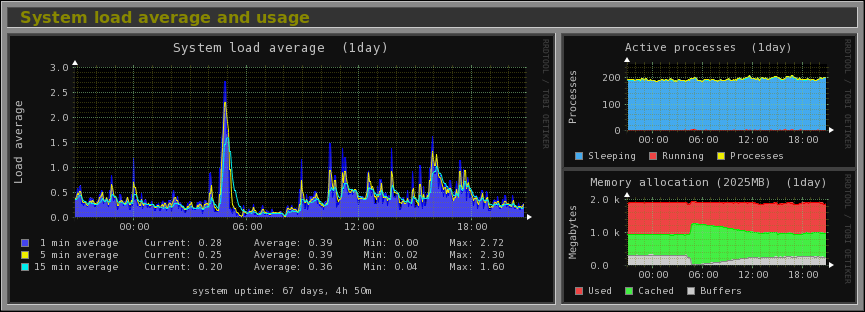
System load average, active processes and memory allocation.
Monitor Linux Kernel Usage
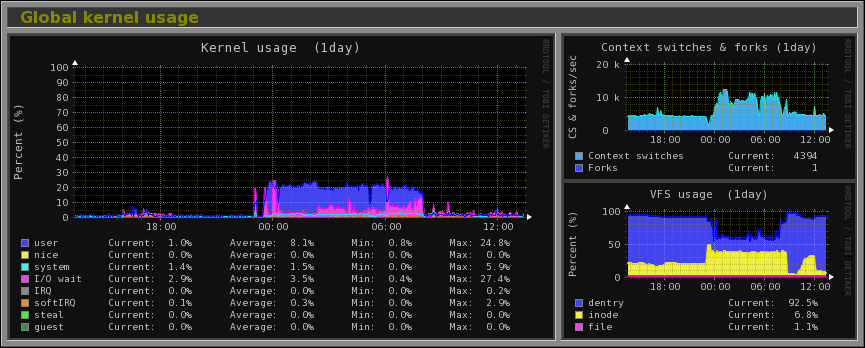
Global kernel usage
Monitor Linux Kernel Processor
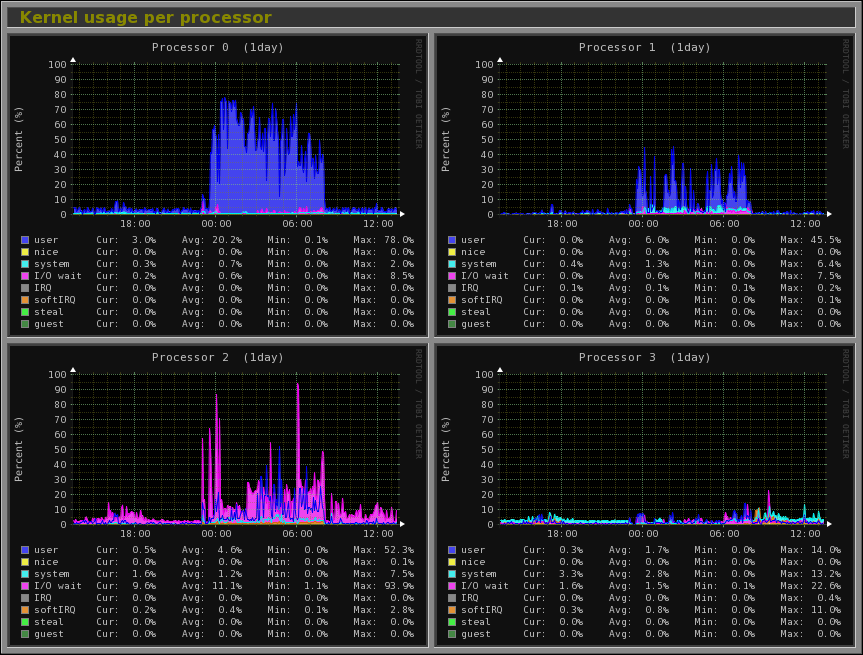
Per-processor kernel usage.
Monitor Linux Disk Health
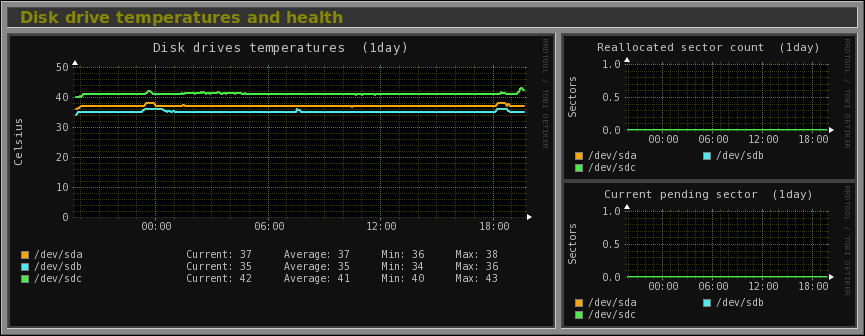
Disk drive temperatures and health.
Monitor Linux Filesystem and Disk I/O Read
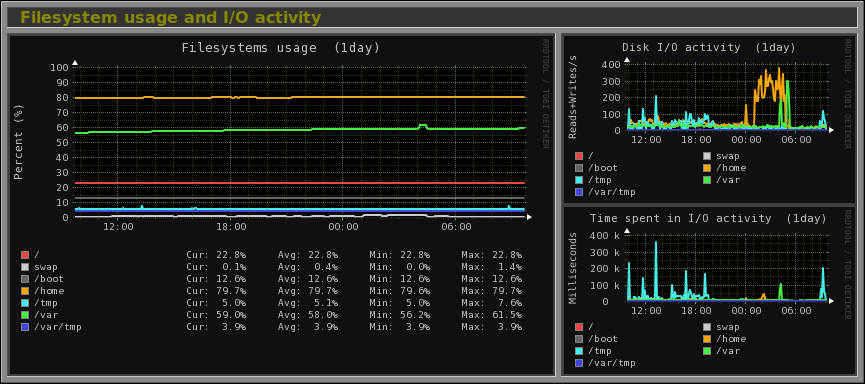
Filesystem usage and I/O activity.
Monitor Linux Network Traffic
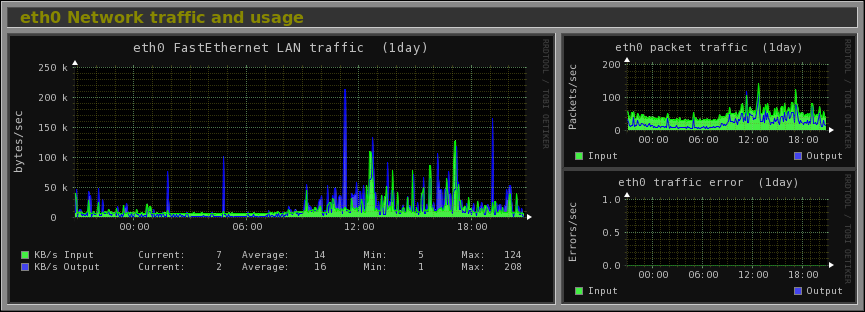
eth0 interface traffic
Monitor Linux System Services
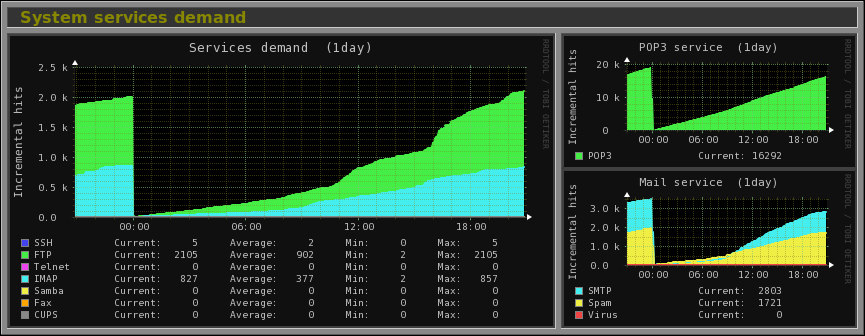
System services demand
Monitor Linux Network Port Traffic
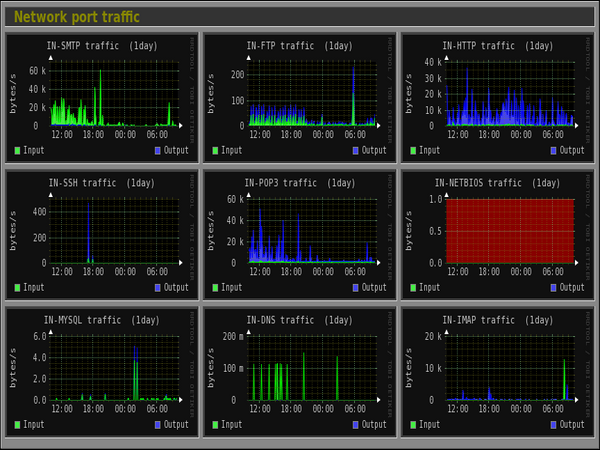
Network Port Traffic
Monitor Linux Apache Statistics
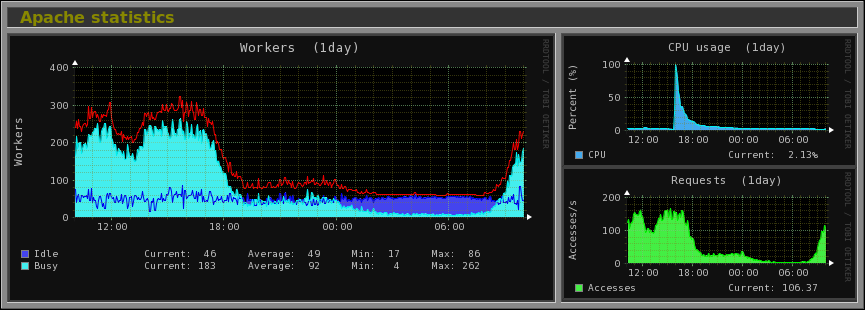
Apache Statistics
Monitor MySQL/MariaDB Statistics
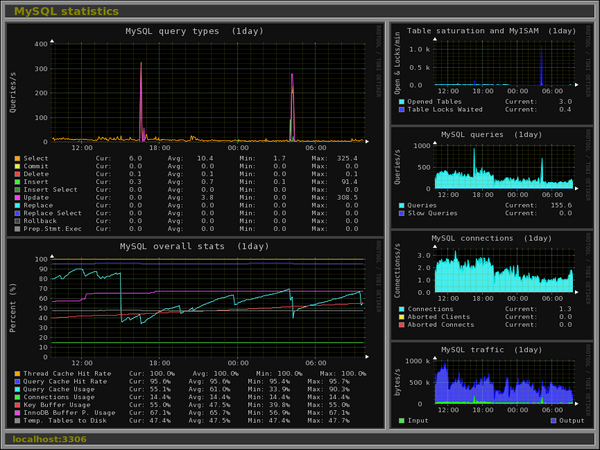
MySQL Statistics