29
Building a Report with Aggregate Data
Figure 29-1 Aggregate data report output
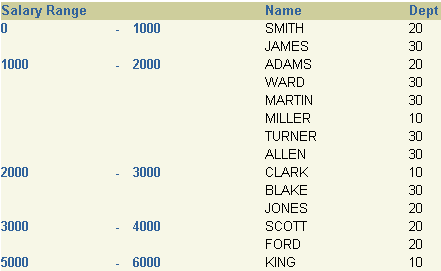
Text description of the illustration aggregate_pap.gif
In this chapter, you will build a report that collects and displays names of all employees whose salaries fall within the range of 0 to 999, then collects and displays all employees whose salaries fall within the range of 1000 to 1999, etc. You will be able to modify this report to display any aggregate range you need.
Concepts
- In a report that aggregates, or collects, data within ranges, values from the database are retrieved and formatted based on an aggregate range that you define. You can even use parameters to specify the range over which the data should be collected.
Data Relationships
- This report uses two "functions" in its SELECT statement to specify the aggregate range. The functions are (FLOOR(SAL/1000))*1000), which calculates the lowest salary, and (CEIL*((SAL+1)/1000) * 1000), which calculates the highest salary. The columns that receive the values of these functions are placed into a break group to produce the control break format of this example report.
Layout
- This report uses the Group Left layout style.
Example Scenario
This chapter will show you how to use the Report Wizard to create the Web and paper layout and report definition. This report will fetch and display data based on an aggregate range of increments of one thousand, starting at zero. You will then modify the Web source of your report.
To see a sample report that aggregates data within ranges, open the examples folder named aggregatingdata, then open the Oracle Reports example named aggregatingdata.rdf. For details on how to open it, see "Accessing the example reports" in the Preface.
Table 29-1 Features demonstrated in this example
29.1 Prerequisites for this example
To build the example in this chapter, you must have access to the EMP and DEPT schema, which is provided by default with the Oracle9i database. The user ID and password for accessing this schema is scott/tiger.
29.2 Create a query and the layout
The steps in this section will show you how to build a simple data model and report layout in the Report Wizard, which you can then use to generate either a JSP-based Web report or a paper report. In the next section, you will modify the JSP so that the appropriate information displays in your Web report.
When you are creating a single-query report, such as this one, you can use the Report Wizard to create the data model and layout simultaneously.
To create a data model and layout:
- Launch Reports Builder (or, if already open, choose File > New > Report).
- In the Welcome or New Report dialog box, select Use the Report Wizard, then click OK.
- If the Welcome page displays, click Next.
- On the Report Type page, select Create both Web and Paper Layout, then click Next.
- On the Style page, type a Title for your report, select Group Left, then click Next.
- On the Data Source page, click SQL Query, then click Next.
- On the Data page, enter the following SELECT statement in the Data Source definition field:
SELECT (FLOOR(SAL/1000))*1000 BOTTOM,
CEIL((SAL+1)/1000) * 1000 TOP,
ENAME,
DEPTNO
FROM EMP
ORDER BY 1,2, SAL
Note:
You you can enter this query in any of the following ways:
- Copy and paste the code from the provided text file called
aggregatingdata_code.txt into the Data Source definition field.
- Click Query Builder to build the query without entering any code manually.
- Type the code in the Data Source definition field.
|
Click Next.
Note:
If you are not already connected to a database, you will be prompted to connect to the database when you click Next. Ensure that you connect to a database that has the appropriate schema for this example. Section 29.1, "Prerequisites for this example" describes the sample schema requirements for this example.
|
- On the Groups page, click the following fields in the Available Fields list and click the right arrow (>) to move them to the Group Fields list, then click Next:
- On the Fields page, click the double right arrows (>>) to move all of the fields to the Displayed Fields list, then click Next.
- On the Totals page, click Next.
- On the Labels page, click Next.
- On the Template page, select Predefined Template and click Beige, then click Finish to display your report output in the Paper Design view. It should look something like this:
Figure 29-2 Paper Design view for the aggregating data report
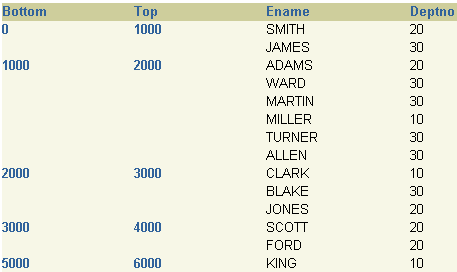
Text description of the illustration aggregate_pdv.gif
- In the Paper Design view, click the text Bottom and change the text to
Salary Range.
- Delete the text Top.
Note:
You can also modify the other column headers to make the text more meaningful.
|
- Click the Paper Layout button in the toolbar to display the Paper Layout view. The layout currently looks like this:
Figure 29-3 Paper Layout view of the Aggregating Data report

Text description of the illustration aggregate_lay.gif
- In the Paper Layout view, click the Flex Off button in the toolbar to set Flex mode off.
- Click the right edge of the f_bottom frame and drag it to the left about 0.5 inches to make room between the f_bottom and f_top fields.
|
Tip:
To find objects in the Paper Layout view, you can use the Object Navigator. When you click an item name in the Object Navigator, the corresponding object is selected in the Paper Layout view.
|
- Click the Text tool in the tool palette.
- Drag a boilerplate text object between f_bottom and f_top, then type "
-" in the text box. The layout should now look like this:
Figure 29-4 Paper Layout view with new boilerplate text

Text description of the illustration aggregate_lay1.gif
- Now, click the Run Paper Layout button in the toolbar to display your report. It should look something like this.
Figure 29-5 Paper Design view of the Aggregating Data report
Text description of the illustration aggregate_pap.gif
Note:
Notice how the report displays the employee names per salary range, hence aggregating the data.
|
- Save your report as
aggregatereport_<your initials>.rdf.
- Take a look at the data model of your report. You can use this data model to generate either a paper report or a JSP-based Web report. To view the data model, click the Data Model button in the toolbar. Your data model should look something like this:
Figure 29-6 Data Model for the aggregating data report
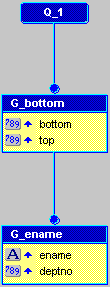
Text description of the illustration aggregate_dm.gif
29.3 Modify the Web source of your JSP report
Now that you've create your paper report layout, you'll now learn how to take the same report and generate a JSP-based Web report that looks the same as your paper report.
To modify your JSP-based Web report:
- Save your report,
aggregatereport_<your initials>.rdf as a JSP under the same name (aggregatereport_<your initials>.jsp).
- Click the Web Source button in the toolbar to display the Web Source view.
In the Web Source, you need to change the column titles to match those of the paper report.
- In the Web Source view, find the text:
<th <rw:id id="HBbottom" asArray="no"/> class="OraColumnHeader"> Bottom
</th>
|
Tip:
Choose Edit > Find and Replace, then type "bottom" in the Find what text box.
|
- Change the column header to "
Salary" so that the line now looks like this:
<th <rw:id id="HBbottom" asArray="no"/> class="OraColumnHeader"> Salary
</th>
- The next line of code indicates the header for the "
Top" column. Delete the header text so that the line looks like this:
<th <rw:id id="HBtop" asArray="no"/> class="OraColumnHeader"> </th>
- Change the other two columns for Ename and Deptno as desired. For example, we changed them to "
Name" and "Dept", like so:
<th <rw:id id="HBename" asArray="no"/> class="OraColumnHeader"> Name </th>
<th <rw:id id="HBdeptno" asArray="no"/> class="OraColumnHeader"> Dept </th>
- Save your report as a JSP.
- Click the Run Web Layout button in the toolbar to display your new JSP-based Web Report in your browser. The report should look something like this:
Note:
If Netscape 7.0 is your default browser, the browser may not display. You can work around this bug by making a copy of the Netscape 7.0 executable, naming it netscape.exe; with this name, the browser will display as expected.
|
Figure 29-7 Aggregating Data JSP-based Web Report
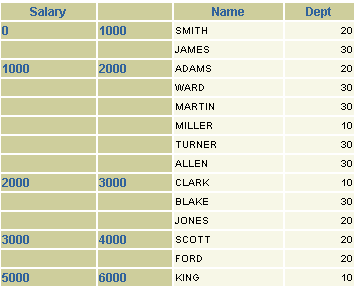
Text description of the illustration aggregate_web.gif
The report displays, in Web format, the aggregate data you specified. Here, you can see which employees fall into the specified salary ranges.
Note:
For information on creating a Parameter Form for a JSP-based Web report, refer to the documented example in Getting Started with Oracle Reports, located on the Oracle Technology Network (http://otn.oracle.com/products/reports/).
|
29.4 Summary
Congratulations! You have successfully built a report that aggregates data, for both paper and Web. You now know how to:
- create a report definition that aggregates data.
- modify your report for the Web.
For more information on any of the wizards, views, or properties used in this example, refer to the Reports Builder Online Help, which you can access in two ways: