10g (9.0.4)
Part Number B10602-01
Home |
Contents |
Index |
| Oracle Reports Building Reports 10g (9.0.4) Part Number B10602-01 |
|

In this example, you will build a report that calculates and displays the four-month average of purchases for each customer.
This chapter will show you how to use the Report Wizard to create a simple time series calculations report for both paper and the Web. For the JSP-based Web report, you will modify the Web source to change labels and add format masks.
To see a sample time series calculations report, open the examples folder named timeseries, then open the Oracle Reports example called timeseries.rdf. For details on how to open it, see "Accessing the example reports" in the Preface.
| Feature | Location |
|---|---|
|
Use the Report Wizard to create a data model and layout for both the paper and Web reports. |
|
|
Modify the JSP to generate the JSP-based Web report. |
To build the example in this chapter, you must have access to the SUMMIT schema, which you can download from the Oracle Reports Documentation page on the Oracle Technology Network (http://otn.oracle.com/products/reports/).
The steps in this section will show you how to build a simple data model and report layout in the Report Wizard, which you can then use to generate either a JSP-based Web report or a paper report. In the next section, you will modify the JSP so that the appropriate information displays in your Web report.
When you are creating a single-query report, such as this one, you can use the Report Wizard to create the data model and layout simultaneously.
SELECT O.CUSTID, O.SHIPDATE, O.TOTAL,
AVG(A.TOTAL) MAVG
FROM ORD O, ORD A
WHERE A.CUSTID = O.CUSTID
AND A.SHIPDATE BETWEEN O.SHIPDATE -123 AND O.SHIPDATE
GROUP BY O.CUSTID, O.SHIPDATE, O.TOTAL
If you are not already connected to a database, you will be prompted to connect to the database when you click Next. Ensure that you connect to a database that has the appropriate schema for this example. Section 28.1, "Prerequisites for this example" describes the sample schema requirements for this example.
Note:
4-Month Moving Average, then click Next

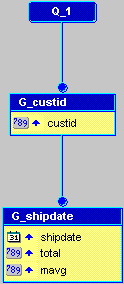
Your data model should look something like this:

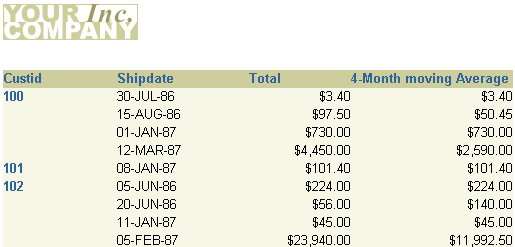
Now that you've created your paper report layout, you can take the same report and generate a JSP-based Web report that looks the same as your paper report.
timeseries_<your initials>.rdf as a JSP under the same name (timeseries_<your initials>.jsp).
In the Web Source, you need to change the format mask to match that of the paper report.
<td <rw:headers id="HFtotal" src="HBtotal, HBcustid, HFcustid"/> class="OraCellNumber"><rw:field id="F_total" src="total" nullValue=" "> F_total </rw:field></td>
formatMask="LNNNGNN0D00" to the line, so that the line looks like this:
<td <rw:headers id="HFtotal" src="HBtotal, HBcustid, HFcustid"/>
class="OraCellNumber"><rw:field id="F_total" src="total"
formatMask="LNNNGNN0D00" nullValue=" "> F_total </rw:field></td>
<td <rw:headers id="HFmavg" src="HBmavg, HBcustid, HFcustid"/> class="OraCellNumber"><rw:field id="F_mavg" src="mavg" formatMask="LNNNGNN0D00" nullValue=" "> F_mavg </rw:field></td>

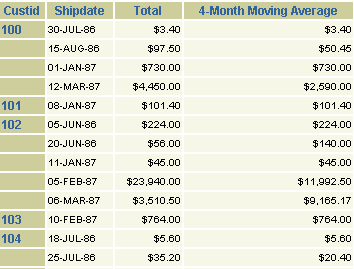
The report displays the total for each customer, as well as the average over the past four months.
Congratulations! You have successfully created a time series calculations report for both paper and Web. You now know how to:
For more information on any of the wizards, views, or properties used in this example, refer to the Reports Builder Online Help, which you can access in two ways:
http://otn.oracle.com/products/reports/), click Documentation and navigate to the Reports Builder Online Help for the most recent, hosted online help.
|
|
 Copyright © 2002, 2003 Oracle Corporation. All Rights Reserved. |
|