
Continuing Zabbix series, this tutorial will guide you on how you can install and configure Zabbix agents on Linux (Debian based systems and CentOS) in order to actively monitor local resources on remote systems.

Add Remote Linux Host to Zabbix Server – Part 3
The main job of zabbix agents consists in gathering local information from the targets where they run and send the data to a central Zabbix server to be further processed and analyzed.
Requirements
Install and Configure Zabbix 2.4.5 on Debian 8 and RHEL/CentOS 7.
Step 1: Install Zabbix Agents in Linux Systems
1. Depending on the Linux distribution you are running, go to Zabbix download page, grab the latest version of the available agents binary packages using a tool such as wget or curl and install it on your machine using the distribution specific package manager – Yum, Rpm or Dpkg.
On Debian based Systems
For Debian systems (including latest release – Debian 8 Jessie) use the following steps to download and install Zabbbix Agent:
$ wget http://repo.zabbix.com/zabbix/2.4/debian/pool/main/z/zabbix/zabbix-agent_2.4.0-1+wheezy_amd64.deb
$ sudo dpkg -i zabbix-agent_2.4.0-1+wheezy_amd64.deb
On CentOS based Systems
For CentOS alike systems, download the .rpm packaged for the distribution specific release number, using the same page as above, and install it using rpm package manager.
In order to automatically manage missing dependency issues and install the agent using one shot use the yumcommand followed by the binary package download link, as in the example below used for installing the agent on CentOS 7:
# rpm -Uvh http://repo.zabbix.com/zabbix/2.4/rhel/7/x86_64/zabbix-agent-2.4.1-2.el7.x86_64.rpm
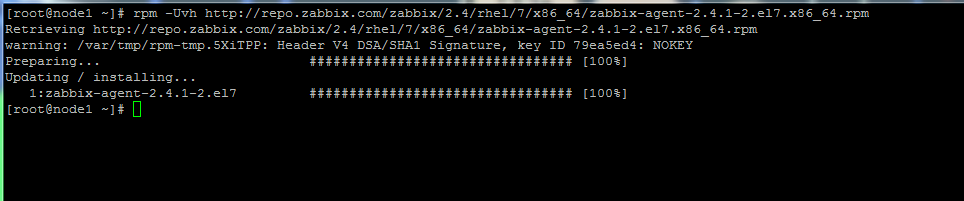
Install Zabbix Agent on CentOS 7
Step 2: Configure and Test Zabbix Agent in Linux
2. The next logical step after installing the packages on the system is to open Zabbix agent configuration file located in /etc/zabbix/ system path on both major distributions and instruct the program to send all the collected information to Zabbix server in order to be analyzed and processed.
Therefore, open zabbix_agentd.conf file with your favorite text editor, find the below lines (use the screenshots as a guide), uncomment them and make the following changes:
# nano /etc/zabbix/zabbix_agentd.conf
add zabbix server IP address and hostname as shown below.
Server=IP of Zabbix Server
ServerActive=IP of Zabbix Server
Hostname=use the FQDN of the node where the agent runs
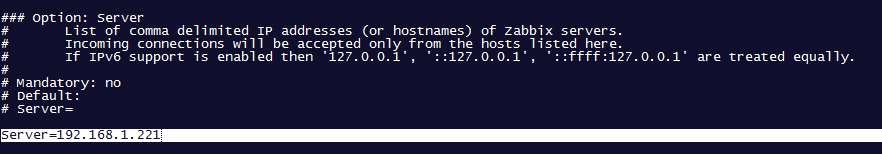
Add Zabbix Server IP Address
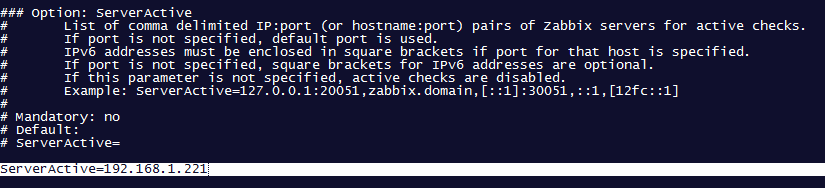
Add Zabbix Server Active IP Address
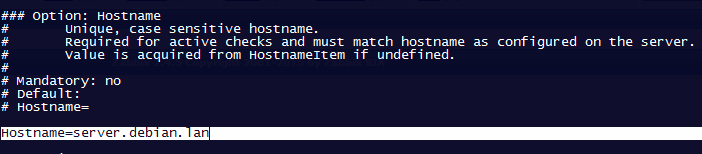
Add Zabbix Agent Hostname
3. Once you’ve finished editing the Zabbix agent configuration file with the required values, restart the daemon using the following command, then use netstat command to verify if the daemon has been started and operates on the specific port – 10050/tcp:
$ sudo systemctl restart zabbix-agent
$ sudo netstat -tulpn|grep zabbix
For older distributions use the service command to manage zabbix agent daemon:
$ sudo service zabbix-agent restart
$ sudo netstat -tulpn|grep zabbix
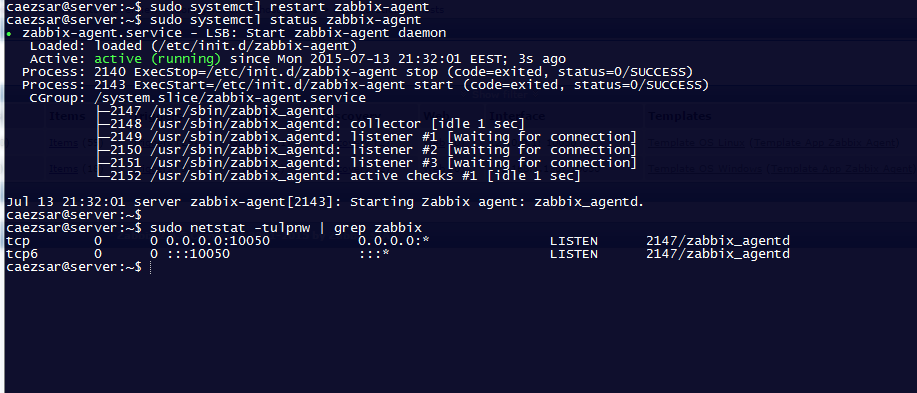
Start Zabbix Agent
4. If your system is behind a firewall then you need to open 10050/tcp port on the system in order to reach through Zabbix server.
For Debian based systems, including Ubuntu, you can use ufw tool to open the port and on CentOS 7 you can use Firewalld utility to manage the firewall rules as the below examples:
$ sudo ufw allow 10050/tcp [On Debian based systems]
$ sudo firewall-cmd --add-port=10050/tcp                [For centOS 7 on-fly rule]
$ sudo firewall-cmd --add-port=10050/tcp --permanent    [For centOS 7 permanent rule]
For older distributions such as centOS 6 or unmanaged firewalls through specific utilities use the powerful iptables command to open ports:
# iptables -A INPUT -p tcp -m tcp --dport 10050 -j ACCEPT
5. Finally, in order to test if you can reach Zabbix Agent from Zabbix Server, use Telnet command from Zabbix server machine to the IP addresses of the machines that run the agents, as illustrated below (don’t worry about the thrown error from agents):
# telnet zabbix_agent_IP 10050
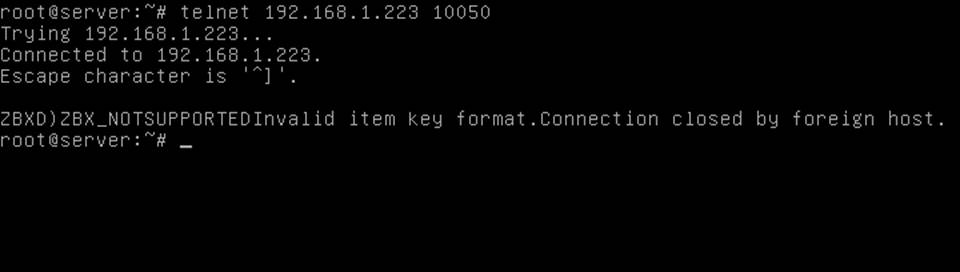
Check Zabbix Agent Connection
Step 3: Add Zabbix Agent Monitored Host to Zabbix Server
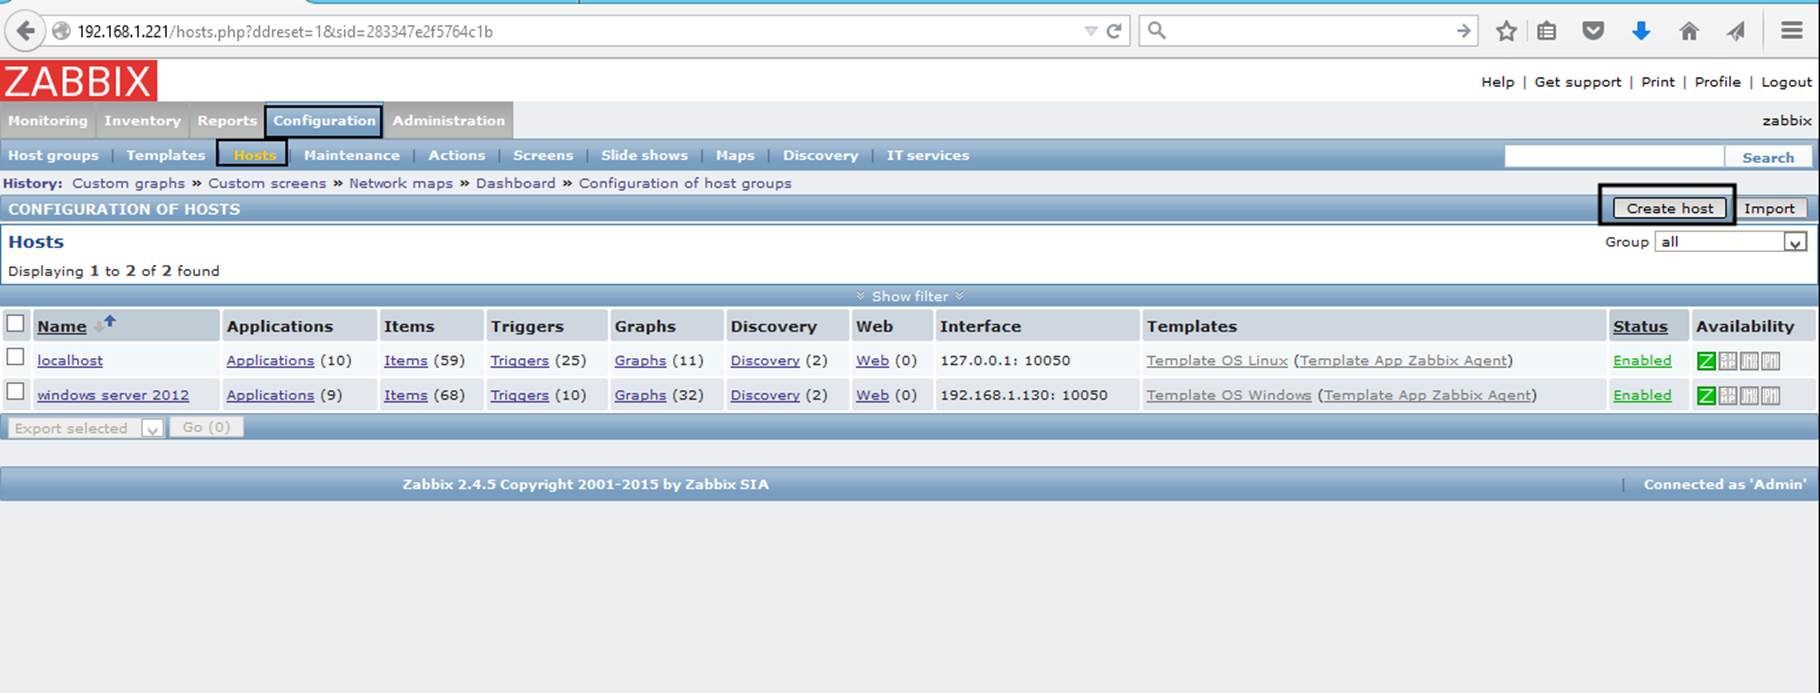
6. On the next step it’s time to move to Zabbix server web console and start adding the hosts which run zabbix agent in order to be monitored by the server.
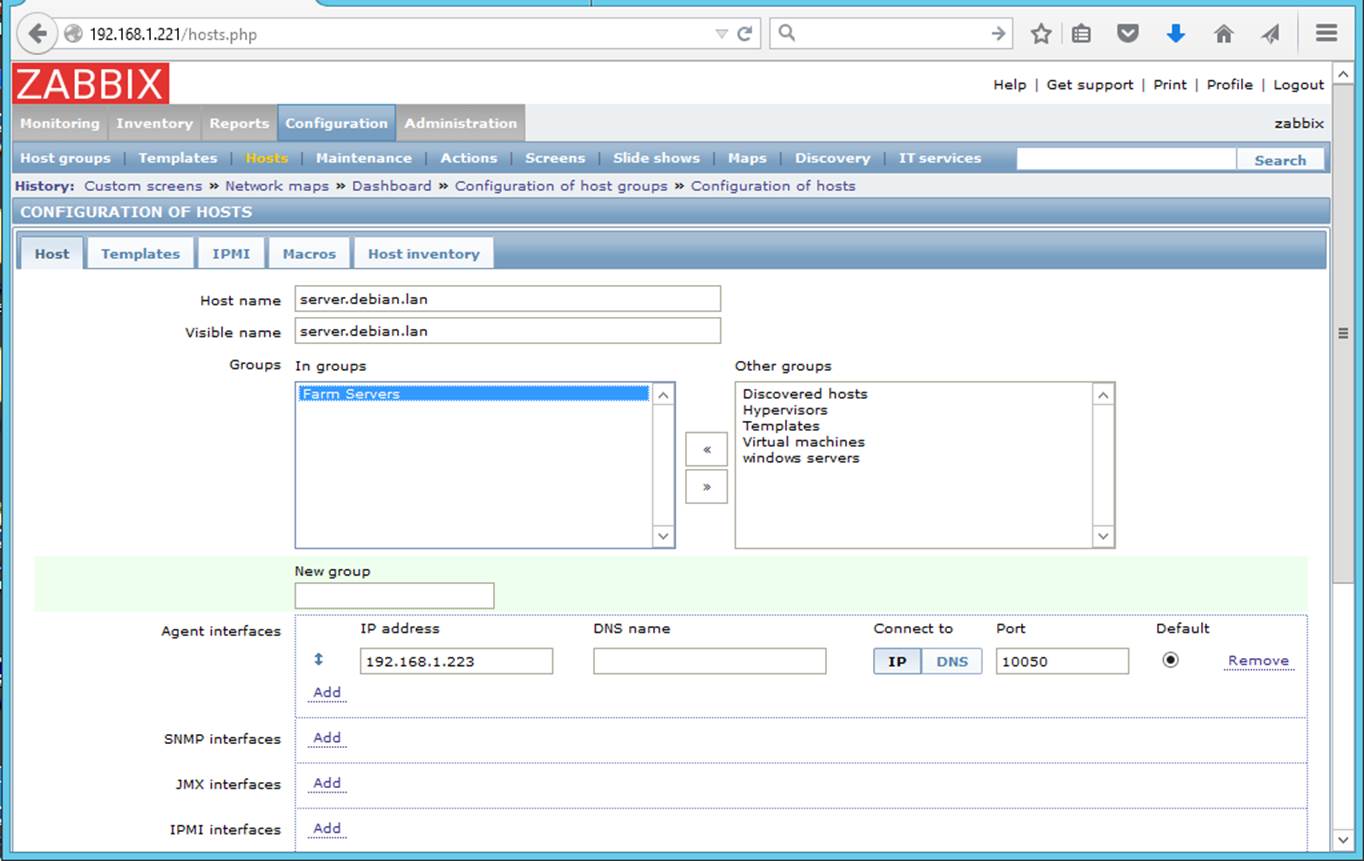
Go to Configuration -> Hosts -> Create Host -> Host tab and fill the Host name field with the FQDN of the monitored zabbix agent machine, use the same value as above for Visible name field.
Next, add this host to a group of monitored servers and use the IP Address of the monitored machine at Agent interfaces field – alternatively you can also use DNS resolution if it’s the case. Use the below screenshots as a guide.
Add Linux Host to Zabbix Monitoring
Add Linux Host to Zabbix Host Group
7. Next, move to Templates tab and hit Select. A new window with templates should open. Choose Template OS Linux then scroll down and hit on Select button to add it and automatically close the window.
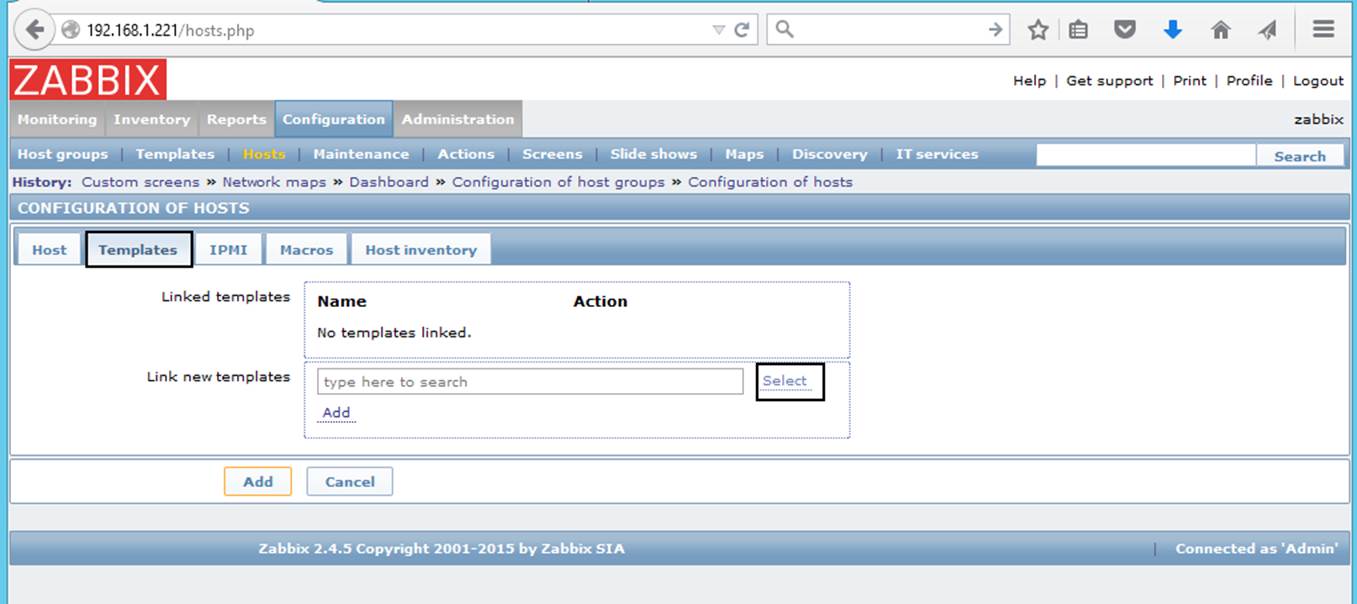
Add Zabbix Linux OS Template
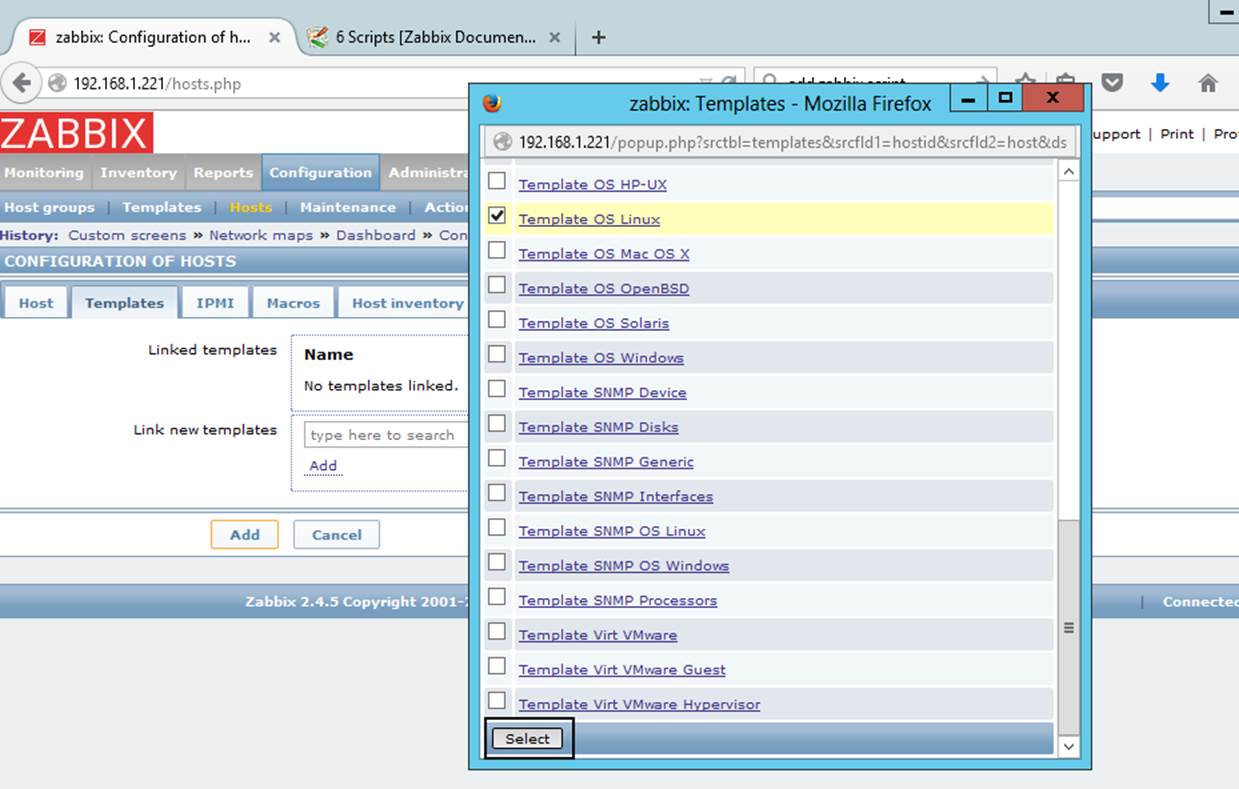
Select Linux OS Template
8. Once the template appears to Link new template box, hit on Add text to link it to zabbix server, then hit on the lower Add button to finish the process and completely add the monitored host. The visible name of the monitored host should now appear hosts window.
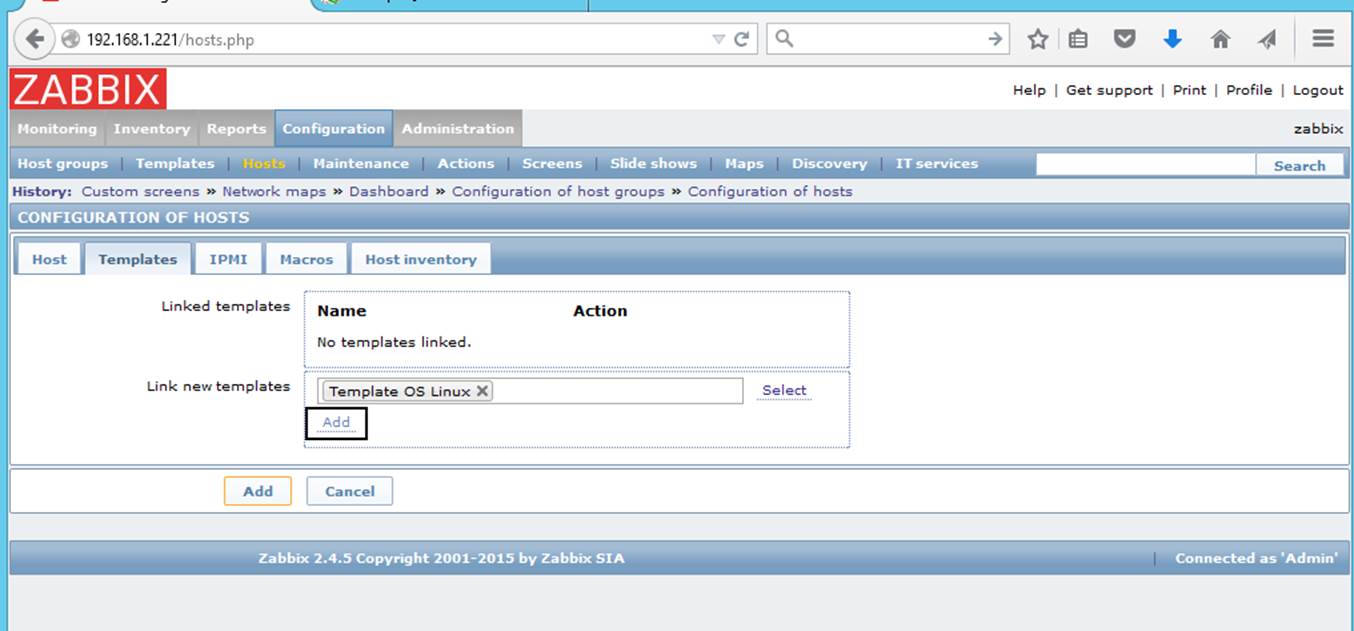
Link New Linux OS Template
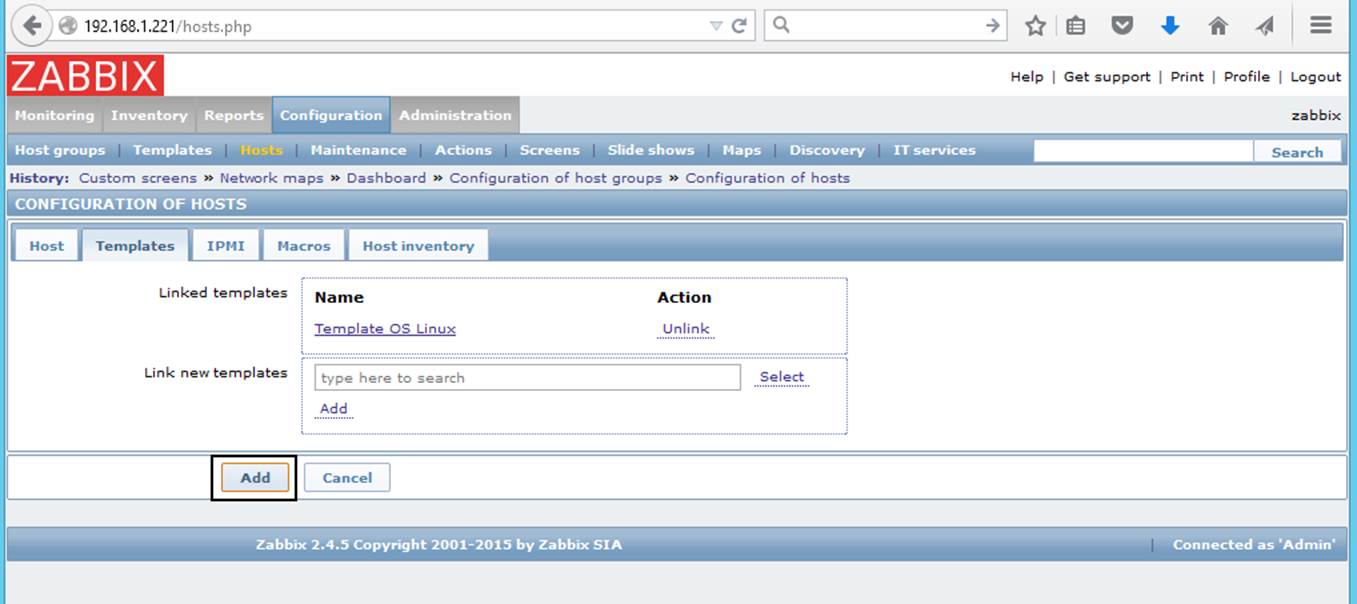
Add Linux OS Template
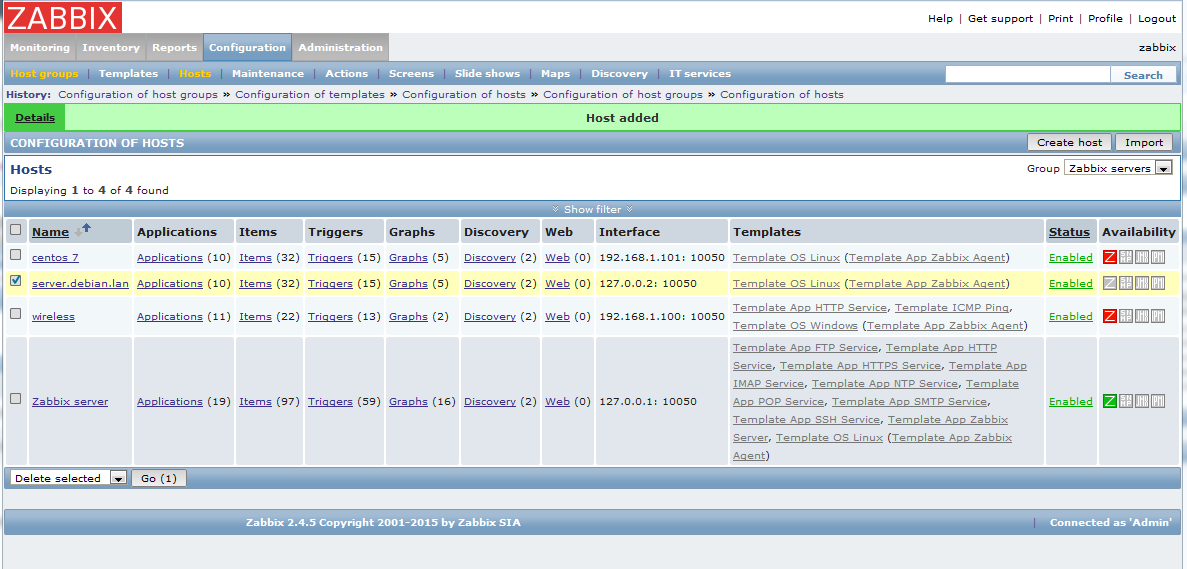
Added Linux Host to Zabbix
That’s all! Just assure that the host Status is set to Enabled and wait a few minutes in order for Zabbix server to contact the agent, process the received data and inform or eventually alert you if something goes bad on the monitored target.