
Collectd-web is a web front-end monitoring tool based on RRDtool (Round-Robin Database Tool), which interprets and graphical outputs the data collected by the Collectd service on Linux systems.
Collectd service comes by default with a huge collection of available plug-ins into its default configuration file, some of them being, by default, already activated once you have installed the software package.
Collectd-web CGI scripts which interprets and generates the graphical html page statistics can be simply executed by the Apache CGI gateway with minimal of configurations required on Apache web server side.
However, the graphical web interface with the generated statistics can, also, be executed by the standalone web server offered by Python CGIHTTPServer script that comes pre-installed with the main Git repository.
This tutorial will cover the installation process of Collectd service and Collectd-web interface on RHEL/CentOS/Fedora and Ubuntu/Debian based systems with the minimal configurations needed to be done in order to run the services and to enable a Collectd service plug-in.
Please go through the following articles of collectd series.
Step 1: – Install Collectd Service
1. Basically, the Collectd daemon task is to gather and store data statistics on the system that it runs on. The Collectd package can be downloaded and installed from the default Debian based distribution repositories by issuing the following command:
On Ubuntu/Debian
# apt-get install collectd [On Debian based Systems]
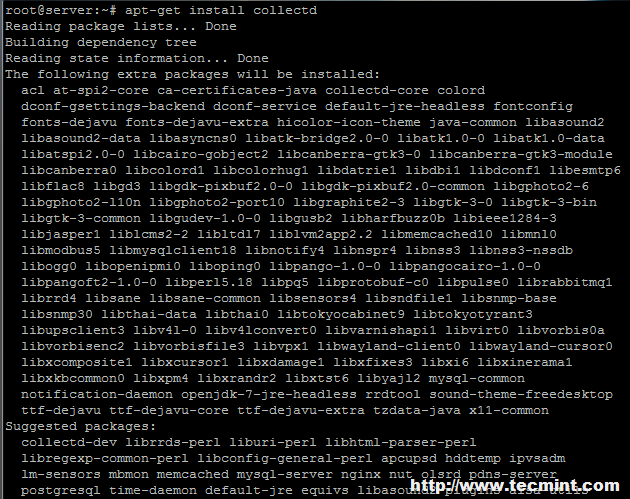
Install Collectd on Debian/Ubuntu
On RHEL/CentOS 6.x/5.x
On older RedHat based systems like CentOS/Fedora, you first need to enable epel repository under your system, then you can able to install collectd package from the epel repository.
# yum install collectd
On RHEL/CentOS 7.x
On latest version of RHEL/CentOS 7.x, you can install and enable epel repository from default yum repos as shown below.
# yum install epel-release
# yum install collectd
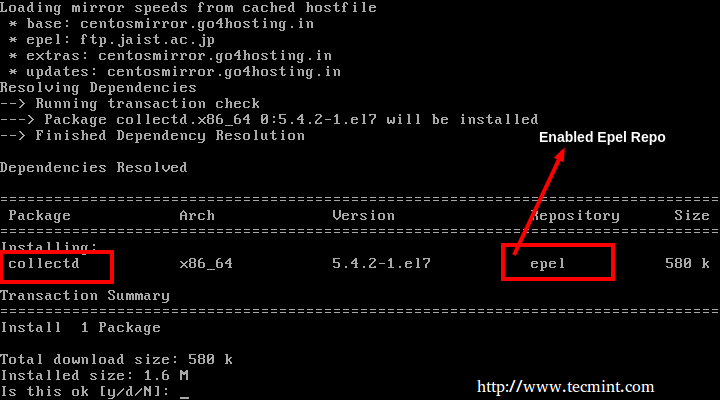
Install Collectd on CentOS/RHEL/Fedora
Note: For Fedora users, no need to enable any third party repositories, simple yum to get the collectd package from default yum repositories.
2. Once the package is installed on your system, run the below command in order to start the service.
# service collectd start			[On Debian based Systems]
# service collectd start                        [On RHEL/CentOS 6.x/5.x Systems]
# systemctl start collectd.service              [On RHEL/CentOS 7.x Systems]
Step 2: Install Collectd-Web and Dependencies
3. Before starting to import the Collectd-web Git repository, first you need to assure that Git software package and the following required dependencies are installed on your machine:
----------------- On Debian / Ubuntu systems -----------------
# apt-get install git
# apt-get install librrds-perl libjson-perl libhtml-parser-perl
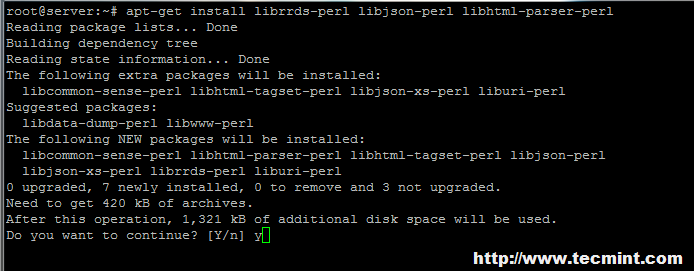
Install Git on Debian/Ubuntu
----------------- On RedHat/CentOS/Fedora based systems -----------------
# yum install git
# yum install rrdtool rrdtool-devel rrdtool-perl perl-HTML-Parser perl-JSON
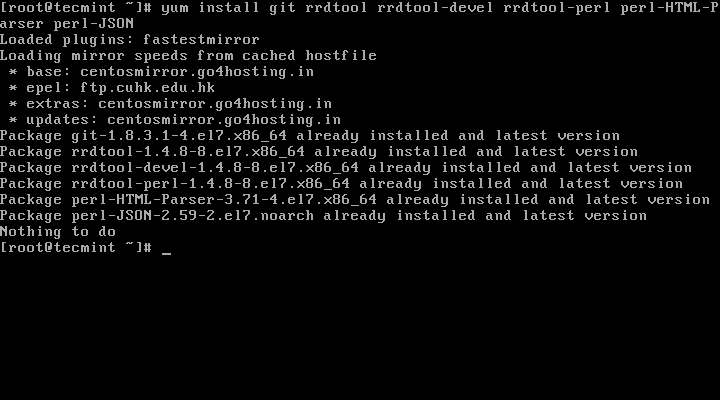
Install Git and Dependencies
Step 3: Import Collectd-Web Git Repository and Modify Standalone Python Server
4. On the next step choose and change the directory to a system path from the Linux tree hierarchy where you want to import the Git project (you can use /usr/local/ path), then run the following command to clone Collectd-web git repository:
# cd /usr/local/
# git clone https://github.com/httpdss/collectd-web.git
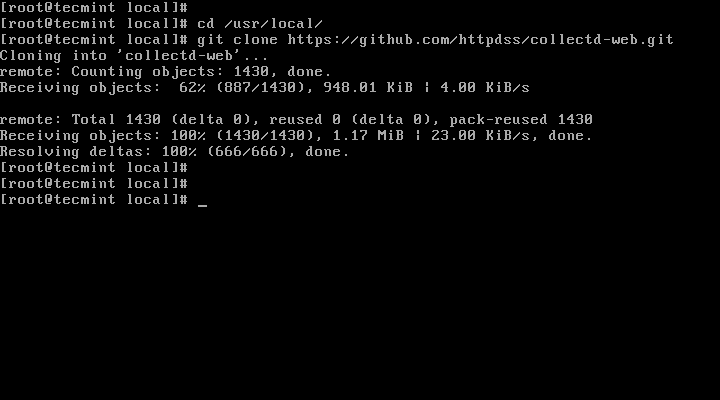
Git Clone Collectd-Web
5. Once the Git repository is imported into your system, go ahead and enter the collectd-web directory and list its contents in order to identify the Python server script (runserver.py), which will be modified on the next step. Also, add execution permissions to the following CGI script: graphdefs.cgi.
# cd collectd-web/
# ls
# chmod +x cgi-bin/graphdefs.cgi
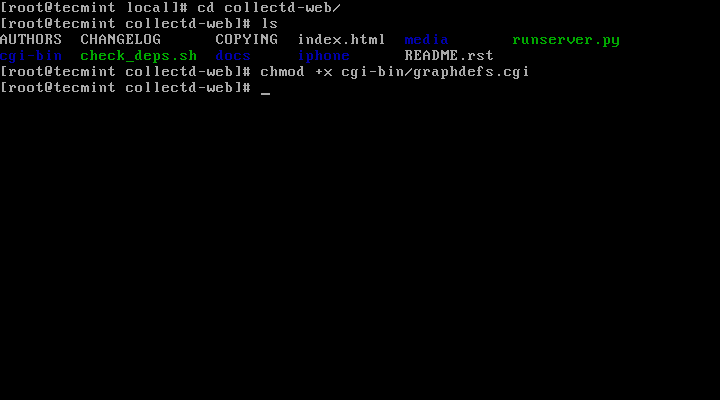
Set Execute Permission
6. Collectd-web standalone Python server script is configured by default to run and bind only on loopback address (127.0.0.1).
In order to access Collectd-web interface from a remote browser, you need to edit the runserver.py script and change the 127.0.1.1 IP Address to 0.0.0.0, in order to bind on all network interfaces IP Addresses.
If you want to bind only on a specific interface, then use that interface IP Address (not advised to use this option in case your network interface Address is dynamically allocated by a DHCP server). Use the below screenshot as an excerpt on how the final runserver.py script should look like:
# nano runserver.py

Configure Collect-web
If you want to use another network port than 8888, modify the PORT variable value.
Step 4: Run Python CGI Standalone Server and Browse Collectd-web Interface
7. After you have modified the standalone Python server script IP Address binding, go ahead and start the server in background by issuing the following command:
# ./runserver.py &
Optional, as an alternate method you can call the Python interpreter to start the server:
# python runserver.py &
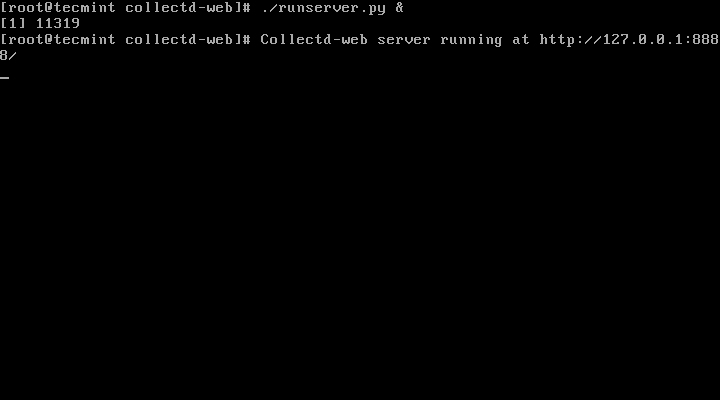
Start Collect-Web Server
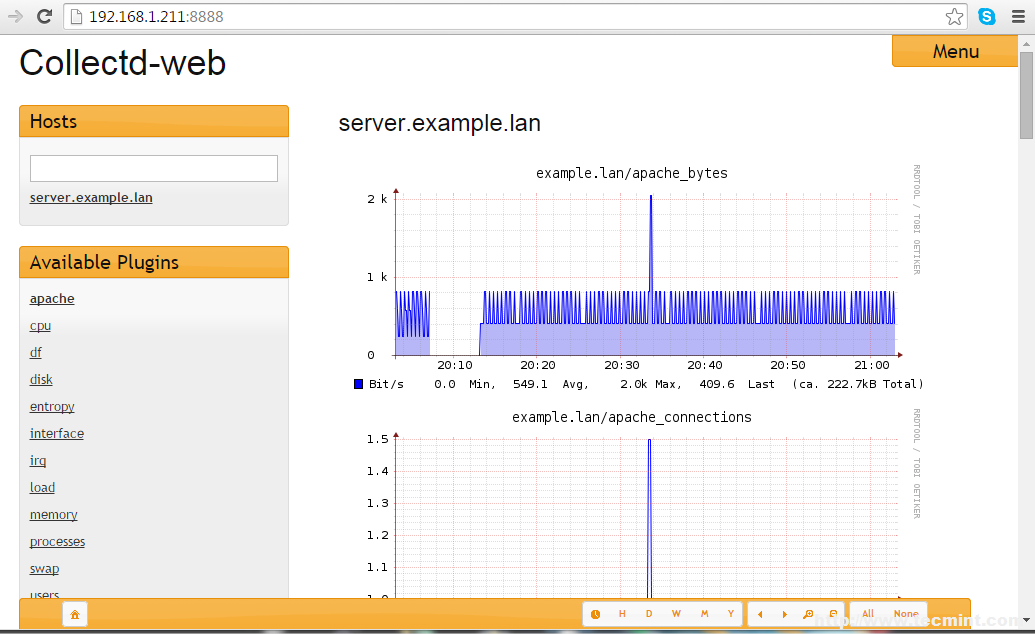
8. To visit Collectd-web interface and display statistics about your host, open a browser and point the URL at your server IP Address and port 8888 using HTTP protocol.
By default you will see a number of graphics about CPU, disk usage, network traffic, RAM, processes and other system resources by clicking on the hostname displayed on Hosts form.
http://192.168.1.211:8888
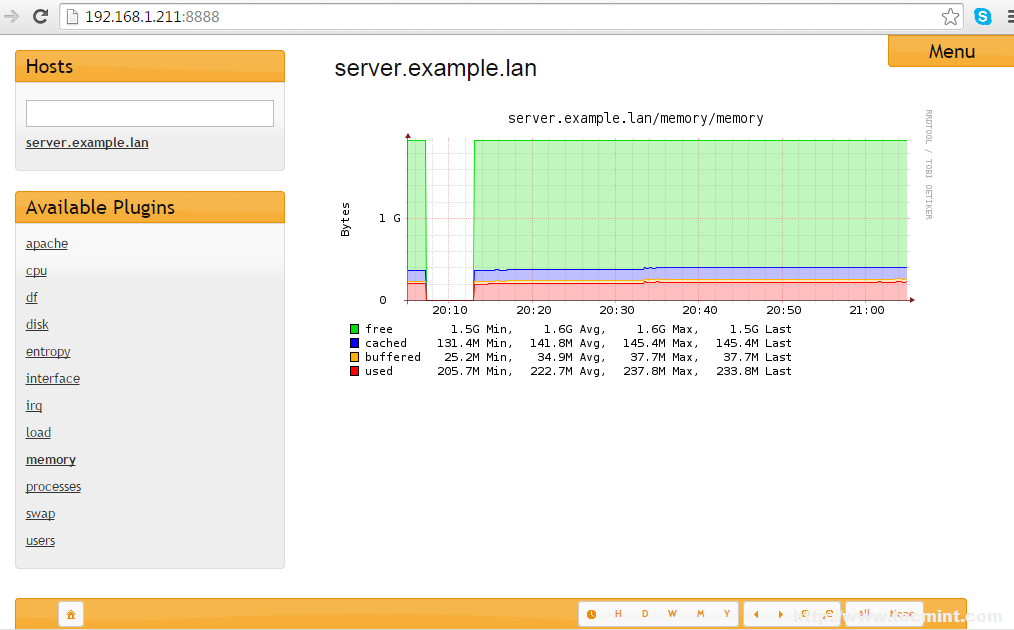
Access Collect-Web Panel
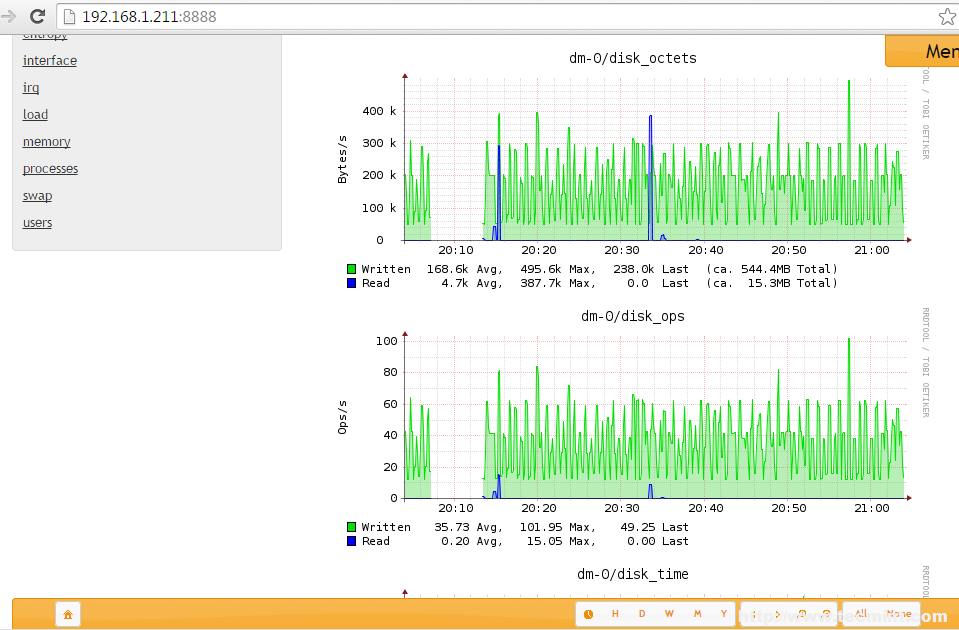
Linux Disk Monitoring
9. To stop the standalone Python server issue the below command or you may cancel or stop the script by hitting Ctrl+c key:
# killall python
Step 5: Create a Custom Bash Script to Manage the Standalone Python Server
10. To manage the standalone PyhtonCGIServer script more easily (start, stop and view status), create the following collectd-server Bash script at a system executable path with the following configurations:
# nano /usr/local/bin/collectd-server
collectd-server file.
#!/bin/bash

PORT="8888"
  case $1 in
            start)
	cd /usr/local/collectd-web/
	python runserver.py 2> /tmp/collectd.log &
    sleep 1
    stat=`netstat -tlpn 2>/dev/null | grep $PORT | grep "python"| cut -d":" -f2 | cut -d" " -f1`
            if [[ $PORT -eq $stat ]]; then
    sock=`netstat -tlpn 2>/dev/null | grep $PORT | grep "python"`
    echo -e "Server is  still running:\n$sock"
            else
    echo -e "Server has stopped"
            fi
                    ;;
            stop)
    pid=`ps -x | grep "python runserver.py" | grep -v "color"`
            kill -9 $pid 2>/dev/null
    stat=`netstat -tlpn 2>/dev/null | grep $PORT | grep "python"| cut -d":" -f2 | cut -d" " -f1`
            if [[ $PORT -eq $stat ]]; then
    sock=`netstat -tlpn 2>/dev/null | grep $PORT | grep "python"`
    echo -e "Server is  still running:\n$sock"
            else
    echo -e "Server has stopped"
            fi
                    ;;
            status)
    stat=`netstat -tlpn 2>/dev/null |grep $PORT| grep "python" | cut -d":" -f2 | cut -d" " -f1`
            if [[ $PORT -eq $stat ]]; then
    sock=`netstat -tlpn 2>/dev/null | grep $PORT | grep "python"`
    echo -e "Server is running:\n$sock"
            else
    echo -e "Server is stopped"
            fi
                    ;;
            *)
    echo "Use $0 start|stop|status"
                    ;;
    esac
In case you have changed PORT variable number from runserver.py script, make sure you make the port variable changes on this bash file accordingly.
11. Once you have created the collectd-server script, add executing permissions in order to be able to run it. The only thing remaining now is to manage the Collectd-web server in a similar way as you do with a system service by issuing the following commands.
# chmod +x /usr/local/bin/collectd-server
# collectd-server start
# collectd-server status
# collectd-server stop
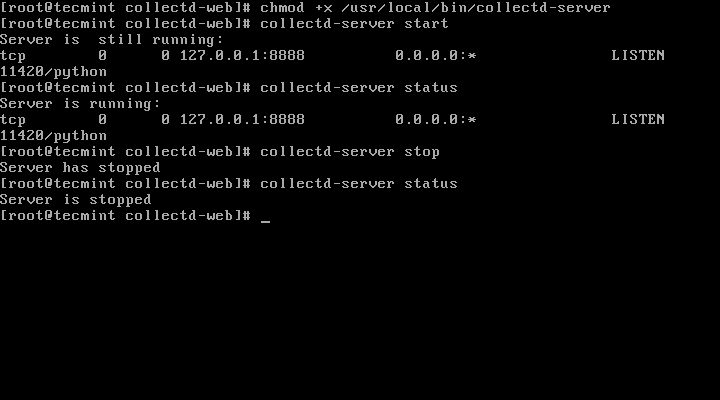
Collectd Server Script
Step 6: Enable a Collectd Daemon Plug-in
12. In order to activate a plug-in on Collectd service, you must go to its main configuration file, which is located at /etc/collectd/collectd.conf file, open this file for editing and uncomment, the first time (remove the # sign in front) the plug-in name you want to activate.
Once the LoadPlugin statement with the name of the plug-in has been uncommented you must deeply search through the file and locate the same plugin name which holds the configurations required to run.
As an example, here’s how you active Collectd Apache plugin. First open Collectd main configuration file for editing:
# nano /etc/collectd/collectd.conf
A. Use Ctrl+w to enable nano editor search and type apache on below terminal the search filed. Once LoadPlugin apache statement has been found, remove the comment special sign # to uncomment it, as illustrated in the below screenshot.
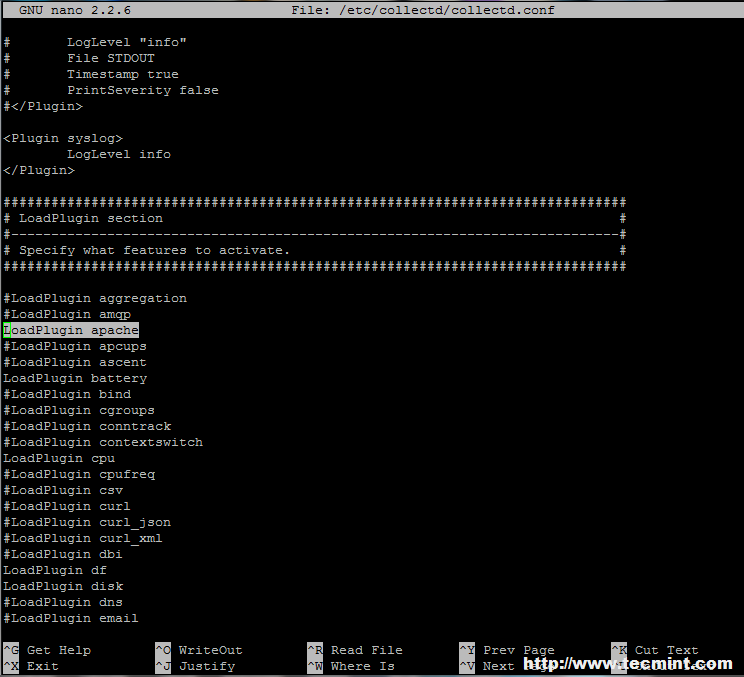
Enable Collectd Apache Plugin
B. Next, type Ctrl+w to search again, apache should already appear on search filed and press Enter key to find the plug-in configurations.
Once apache plug-in configurations are located (they look similar to Apache web server statements) uncomment the following lines, so that the final configuration should resemble to this:
<Plugin apache>
        <Instance "example.lan">
                URL "http://localhost/server-status?auto"
#               User "www-user"
#               Password "secret"
#               VerifyPeer false
#               VerifyHost false
#               CACert "/etc/ssl/ca.crt"
#               Server "apache"
        </Instance>
#
#       <Instance "bar">
#               URL "http://some.domain.tld/status?auto"
#               Host "some.domain.tld"
#               Server "lighttpd"
#       </Instance>
</Plugin>
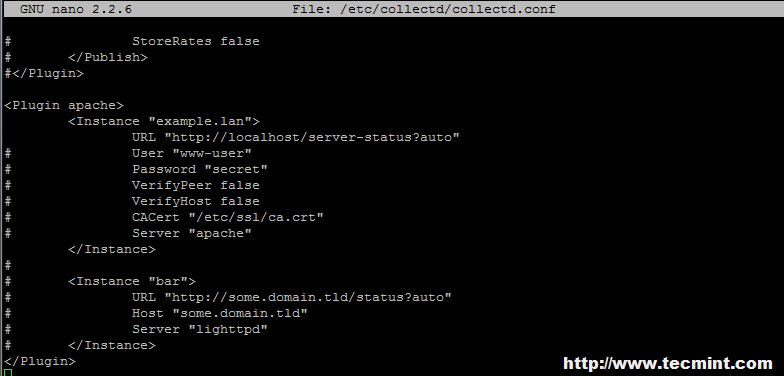
Enable Apache Configuration for Collectd
Note: Replace <Instance "example.lan"> statement string according to your server hostname.
C. After you finish editing the file, save it (Ctrl+o) and close it (Ctrl+x), then restart Collectd daemon to apply changes. Clear your browser cache and reload the page to view the statistics collected by Collectd daemon so far for Apache Web Server.
# /usr/local/bin/collectd-server start
Apache Monitoring
To enable other plug-ins please visit Collectd Wiki page.
Step 7: Enable Collectd Daemon and Collectd-web Server System-Wide
13. In order to automatically start Collectd-web server from the Bash script at boot time, open /etc/rc.localfile for editing and add the following line before the exit 0 statement:
/usr/local/bin/collectd-server start
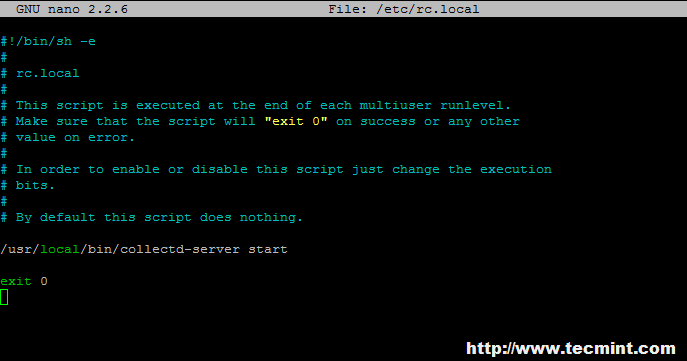
Enable Collectd Systemwide
If you’re not using the collectd-server Bash script which manages the Python server script, replace the above line on rc.conf with the following line:
# cd /usr/local/collectd-web/ && python runserver.py 2> /tmp/collectd.log &
Then, enable both system services by issuing the following commands:
------------------ On Debian / Ubuntu ------------------
# update-rc.d collectd enable
# update-rc.d rc.local enable
Optionally, an alternate method to enable this services at boot time would be with the help on sysv-rc-confpackage:
------------------ On Debian / Ubuntu ------------------
# sysv-rc-conf collectd on
# sysv-rc-conf rc.local on
------------------ On RHEL/CentOS 6..x/5.x and Fedora 12-19 ------------------
# chkconfig collectd on
# chkconfig --level 5 collectd on
------------------ On RHEL/CentOS 7.x and Fedora 20 onwards ------------------
# systemctl enable collectd
That’s all! Collectd daemon and Collectd-web server prove to be excellent monitoring tools for Linux servers, with minimal impact concerning system resources, which can generate and display some interesting graphical statistics about machines workload, the only drawback so far being the fact the statistics are not displaying in real time without refreshing the browser.