How to Run or Repeat a Linux Command Every X Seconds Forever

A system administrator often needs to run a command repeatedly in a certain periods of time. Often such tasks can be easily completed with simple cron commands. In most of the cases  this should work, but the shortest period which you can run cron command is every 1 minute. Believe it or not, in many cases this is too slow.

Run Linux Command Every Second

Run Linux Command Every Second

In this tutorial, you will learn a simple scripting techniques to monitor or keep a eye on a particular command in continuously running state similar to top command (continuously monitor the process and memory utilization)for every 3 seconds by default.

We will not stop to discuss the reasons, why you would need to run commands this often. I believe everyone has different reasons for that in their daily jobs or even at home PCs and laptops.

1. Use watch Command

Watch is a Linux command that allows you to execute a command or program periodically and also shows you output on the screen. This means that you will be able to see the program output in time. By default watch re-runs the command/program every 2 seconds. The interval can be easily changed to meet your requirements.

Monitor Memory Usage

“Watch” is extremely easy to use, to test it, you can fire up a Linux terminal right away and type the following command:

# watch free -m

The above command will check your system free memory and update the results of the free command every two seconds.

Monitor Memory Usage in Linux

Monitor Memory Usage in Linux

As seen per the above output, you have a header, displaying information about (from left to right) update interval, command that is being executed and current time. If you wish to hide this header, you can use the -toption.

The next logical question is – how to change the execution interval. For that purpose, you can use the -noption, that specifies the interval with which the command will be executed. This interval is specified in seconds. So let’s say you want to run your script.sh file every 10 seconds, you can do it like this:

# watch -n 10 script.sh

Note that if you run the command like shown above, you will need to cd to the directory (learn Learn 15 cd Command Examples) where the script is located or otherwise specify the full path to that script.

Other useful options of watch command are:

  1. -b – creates a beep sound if the exit of the command is non-zero.
  2. -c – Interprets ANSI color sequences.
  3. -d – highlights the changes in the command output.

Monitor Logged-In Users, Uptime and Load Average

Let’s say you want to monitor logged-in users, server uptime and load average output in continuously phase every few seconds, then use following command as shown:

# watch uptime

Watch Linux Load Average

Watch Linux Load Average

To exit the command, press CTRL+C.

Here, the 'uptime' command will run and display the updated results every 2 seconds by default.

Monitor Progress of Copy Command

In Linux, while copying files from one location to other using cp command, the progress of data is not shown, to see the progress of data being copied, you can use the watch command along with du -s command to check the disk usage in real time.

# cp ubuntu-15.10-desktop-amd64.iso /home/tecmint/ &
# watch -n 0.1 du -s /home/tecmint/ubuntu-15.10-desktop-amd64.iso 

Monitor Progress of Copy Command

Monitor Progress of Copy Command

If you think that the above process is too complicated to achieve, then I suggest you to go for Advance copy command, which shows progress of data while copying.

2. Use sleep Command

Sleep is often used to debug shell scripts, but it has many other useful purposes as well. For example, when combined with for or while loops, you can get pretty awesome results.

If you are new to bash scripting, you can check our guide about bash loops here.

In case this is the first time you hear about the "sleep" command, it is used to delay something for a specified amount of time. In scripts, you can use it to tell your script to run command 1, wait for 10 seconds and then run command 2.

With the above loops, you can tell bash to run a command, sleep for N amount of seconds and then run the command again.

Below you can see examples of both loops:

for loop Example

# for i in {1..10}; do echo -n "This is a test in loop $i "; date ; sleep 5; done

The above one liner, will run the echo command and display the current date, total of 10 times, with 5 seconds sleep between executions.

Here is a sample output:

This is a test in loop 1 Wed Feb 17 20:49:47 EET 2016
This is a test in loop 2 Wed Feb 17 20:49:52 EET 2016
This is a test in loop 3 Wed Feb 17 20:49:57 EET 2016
This is a test in loop 4 Wed Feb 17 20:50:02 EET 2016
This is a test in loop 5 Wed Feb 17 20:50:07 EET 2016
This is a test in loop 6 Wed Feb 17 20:50:12 EET 2016
This is a test in loop 7 Wed Feb 17 20:50:17 EET 2016
This is a test in loop 8 Wed Feb 17 20:50:22 EET 2016
This is a test in loop 9 Wed Feb 17 20:50:27 EET 2016
This is a test in loop 10 Wed Feb 17 20:50:32 EET 2016

You can change the echo and date commands with your own commands or script and change the sleep interval per your needs.

while loop Example

# while true; do echo -n "This is a test of while loop";date ; sleep 5; done

Here is sample output:

This is a test of while loopWed Feb 17 20:52:32 EET 2016
This is a test of while loopWed Feb 17 20:52:37 EET 2016
This is a test of while loopWed Feb 17 20:52:42 EET 2016
This is a test of while loopWed Feb 17 20:52:47 EET 2016
This is a test of while loopWed Feb 17 20:52:52 EET 2016
This is a test of while loopWed Feb 17 20:52:57 EET 2016

The above command will run until it is either killed or interrupted by the user. It can come in handy if you need to run a command running in the background and you don’t want to count on cron.

Important: When using the above methods, it is highly recommend that you set interval long enough to give enough time of your command to finish running, before the next execution.

Conclusion

The samples in this tutorial are useful, but are not meant to completely replace the cron utility. It is up to you to find which one works better for you, but if we have to separate the usage of both techniques, I would say this:

  1. Use cron when you need to run commands periodically even after system reboots.
  2. Use the methods explained in this tutorial for programs/scripts that are meant to run within the current user session.

As always if you have any questions or comments, do not hesitate to submit them in the comment section below.

Source

20 Netstat Commands for Linux Network Management

netstat (network statistics) is a command line tool for monitoring network connections both incoming and outgoing as well as viewing routing tables, interface statistics etc. netstat is available on all Unix-like Operating Systems and also available on Windows OS as well. It is very useful in terms of network troubleshooting and performance measurement. netstat is one of the most basic network service debugging tools, telling you what ports are open and whether any programs are listening on ports.

Linux Netstat Command

Linux Netstat Command

This tool is very important and much useful for Linux network administrators as well as system administrators to monitor and troubleshoot their network related problems and determine network traffic performance. This article shows usages of netstat command with their examples which may be useful in daily operation.

You might also be interested in following article

  1. 35 Practical Examples of Linux Find Command

1. Listing all the LISTENING Ports of TCP and UDP connections

Listing all ports (both TCP and UDP) using netstat -a option.

# netstat -a | more

Active Internet connections (servers and established)
Proto Recv-Q Send-Q Local Address               Foreign Address             State
tcp        0      0 *:sunrpc                    *:*                         LISTEN
tcp        0     52 192.168.0.2:ssh             192.168.0.1:egs             ESTABLISHED
tcp        1      0 192.168.0.2:59292           www.gov.com:http            CLOSE_WAIT
tcp        0      0 localhost:smtp              *:*                         LISTEN
tcp        0      0 *:59482                     *:*                         LISTEN
udp        0      0 *:35036                     *:*
udp        0      0 *:npmp-local                *:*

Active UNIX domain sockets (servers and established)
Proto RefCnt Flags       Type       State         I-Node Path
unix  2      [ ACC ]     STREAM     LISTENING     16972  /tmp/orbit-root/linc-76b-0-6fa08790553d6
unix  2      [ ACC ]     STREAM     LISTENING     17149  /tmp/orbit-root/linc-794-0-7058d584166d2
unix  2      [ ACC ]     STREAM     LISTENING     17161  /tmp/orbit-root/linc-792-0-546fe905321cc
unix  2      [ ACC ]     STREAM     LISTENING     15938  /tmp/orbit-root/linc-74b-0-415135cb6aeab

2. Listing TCP Ports connections

Listing only TCP (Transmission Control Protocol) port connections using netstat -at.

# netstat -at

Active Internet connections (servers and established)
Proto Recv-Q Send-Q Local Address               Foreign Address             State
tcp        0      0 *:ssh                       *:*                         LISTEN
tcp        0      0 localhost:ipp               *:*                         LISTEN
tcp        0      0 localhost:smtp              *:*                         LISTEN
tcp        0     52 192.168.0.2:ssh             192.168.0.1:egs             ESTABLISHED
tcp        1      0 192.168.0.2:59292           www.gov.com:http            CLOSE_WAIT

3. Listing UDP Ports connections

Listing only UDP (User Datagram Protocol ) port connections using netstat -au.

# netstat -au

Active Internet connections (servers and established)
Proto Recv-Q Send-Q Local Address               Foreign Address             State
udp        0      0 *:35036                     *:*
udp        0      0 *:npmp-local                *:*
udp        0      0 *:mdns                      *:*

4. Listing all LISTENING Connections

Listing all active listening ports connections with netstat -l.

# netstat -l

Active Internet connections (only servers)
Proto Recv-Q Send-Q Local Address               Foreign Address             State
tcp        0      0 *:sunrpc                    *:*                         LISTEN
tcp        0      0 *:58642                     *:*                         LISTEN
tcp        0      0 *:ssh                       *:*                         LISTEN
udp        0      0 *:35036                     *:*
udp        0      0 *:npmp-local                *:*

Active UNIX domain sockets (only servers)
Proto RefCnt Flags       Type       State         I-Node Path
unix  2      [ ACC ]     STREAM     LISTENING     16972  /tmp/orbit-root/linc-76b-0-6fa08790553d6
unix  2      [ ACC ]     STREAM     LISTENING     17149  /tmp/orbit-root/linc-794-0-7058d584166d2
unix  2      [ ACC ]     STREAM     LISTENING     17161  /tmp/orbit-root/linc-792-0-546fe905321cc
unix  2      [ ACC ]     STREAM     LISTENING     15938  /tmp/orbit-root/linc-74b-0-415135cb6aeab

5. Listing all TCP Listening Ports

Listing all active listening TCP ports by using option netstat -lt.

# netstat -lt

Active Internet connections (only servers)
Proto Recv-Q Send-Q Local Address               Foreign Address             State
tcp        0      0 *:dctp                      *:*                         LISTEN
tcp        0      0 *:mysql                     *:*                         LISTEN
tcp        0      0 *:sunrpc                    *:*                         LISTEN
tcp        0      0 *:munin                     *:*                         LISTEN
tcp        0      0 *:ftp                       *:*                         LISTEN
tcp        0      0 localhost.localdomain:ipp   *:*                         LISTEN
tcp        0      0 localhost.localdomain:smtp  *:*                         LISTEN
tcp        0      0 *:http                      *:*                         LISTEN
tcp        0      0 *:ssh                       *:*                         LISTEN
tcp        0      0 *:https                     *:*                         LISTEN

6. Listing all UDP Listening Ports

Listing all active listening UDP ports by using option netstat -lu.

# netstat -lu

Active Internet connections (only servers)
Proto Recv-Q Send-Q Local Address               Foreign Address             State
udp        0      0 *:39578                     *:*
udp        0      0 *:meregister                *:*
udp        0      0 *:vpps-qua                  *:*
udp        0      0 *:openvpn                   *:*
udp        0      0 *:mdns                      *:*
udp        0      0 *:sunrpc                    *:*
udp        0      0 *:ipp                       *:*
udp        0      0 *:60222                     *:*
udp        0      0 *:mdns                      *:*

7. Listing all UNIX Listening Ports

Listing all active UNIX listening ports using netstat -lx.

# netstat -lx

Active UNIX domain sockets (only servers)
Proto RefCnt Flags       Type       State         I-Node Path
unix  2      [ ACC ]     STREAM     LISTENING     4171   @ISCSIADM_ABSTRACT_NAMESPACE
unix  2      [ ACC ]     STREAM     LISTENING     5767   /var/run/cups/cups.sock
unix  2      [ ACC ]     STREAM     LISTENING     7082   @/tmp/fam-root-
unix  2      [ ACC ]     STREAM     LISTENING     6157   /dev/gpmctl
unix  2      [ ACC ]     STREAM     LISTENING     6215   @/var/run/hald/dbus-IcefTIUkHm
unix  2      [ ACC ]     STREAM     LISTENING     6038   /tmp/.font-unix/fs7100
unix  2      [ ACC ]     STREAM     LISTENING     6175   /var/run/avahi-daemon/socket
unix  2      [ ACC ]     STREAM     LISTENING     4157   @ISCSID_UIP_ABSTRACT_NAMESPACE
unix  2      [ ACC ]     STREAM     LISTENING     60835836 /var/lib/mysql/mysql.sock
unix  2      [ ACC ]     STREAM     LISTENING     4645   /var/run/audispd_events
unix  2      [ ACC ]     STREAM     LISTENING     5136   /var/run/dbus/system_bus_socket
unix  2      [ ACC ]     STREAM     LISTENING     6216   @/var/run/hald/dbus-wsUBI30V2I
unix  2      [ ACC ]     STREAM     LISTENING     5517   /var/run/acpid.socket
unix  2      [ ACC ]     STREAM     LISTENING     5531   /var/run/pcscd.comm

8. Showing Statistics by Protocol

Displays statistics by protocol. By default, statistics are shown for the TCP, UDP, ICMP, and IP protocols. The -s parameter can be used to specify a set of protocols.

# netstat -s

Ip:
    2461 total packets received
    0 forwarded
    0 incoming packets discarded
    2431 incoming packets delivered
    2049 requests sent out
Icmp:
    0 ICMP messages received
    0 input ICMP message failed.
    ICMP input histogram:
    1 ICMP messages sent
    0 ICMP messages failed
    ICMP output histogram:
        destination unreachable: 1
Tcp:
    159 active connections openings
    1 passive connection openings
    4 failed connection attempts
    0 connection resets received
    1 connections established
    2191 segments received
    1745 segments send out
    24 segments retransmited
    0 bad segments received.
    4 resets sent
Udp:
    243 packets received
    1 packets to unknown port received.
    0 packet receive errors
    281 packets sent

9. Showing Statistics by TCP Protocol

Showing statistics of only TCP protocol by using option netstat -st.

# netstat -st

Tcp:
    2805201 active connections openings
    1597466 passive connection openings
    1522484 failed connection attempts
    37806 connection resets received
    1 connections established
    57718706 segments received
    64280042 segments send out
    3135688 segments retransmited
    74 bad segments received.
    17580 resets sent

10. Showing Statistics by UDP Protocol

# netstat -su

Udp:
    1774823 packets received
    901848 packets to unknown port received.
    0 packet receive errors
    2968722 packets sent

11. Displaying Service name with PID

Displaying service name with their PID number, using option netstat -tp will display “PID/Program Name”.

# netstat -tp

Active Internet connections (w/o servers)
Proto Recv-Q Send-Q Local Address               Foreign Address             State       PID/Program name
tcp        0      0 192.168.0.2:ssh             192.168.0.1:egs             ESTABLISHED 2179/sshd
tcp        1      0 192.168.0.2:59292           www.gov.com:http            CLOSE_WAIT  1939/clock-applet

12. Displaying Promiscuous Mode

Displaying Promiscuous mode with -ac switch, netstat print the selected information or refresh screen every five second. Default screen refresh in every second.

# netstat -ac 5 | grep tcp

tcp        0      0 *:sunrpc                    *:*                         LISTEN
tcp        0      0 *:58642                     *:*                         LISTEN
tcp        0      0 *:ssh                       *:*                         LISTEN
tcp        0      0 localhost:ipp               *:*                         LISTEN
tcp        0      0 localhost:smtp              *:*                         LISTEN
tcp        1      0 192.168.0.2:59447           www.gov.com:http            CLOSE_WAIT
tcp        0     52 192.168.0.2:ssh             192.168.0.1:egs             ESTABLISHED
tcp        0      0 *:sunrpc                    *:*                         LISTEN
tcp        0      0 *:ssh                       *:*                         LISTEN
tcp        0      0 localhost:ipp               *:*                         LISTEN
tcp        0      0 localhost:smtp              *:*                         LISTEN
tcp        0      0 *:59482                     *:*                         LISTEN

13. Displaying Kernel IP routing

Display Kernel IP routing table with netstat and route command.

# netstat -r

Kernel IP routing table
Destination     Gateway         Genmask         Flags   MSS Window  irtt Iface
192.168.0.0     *               255.255.255.0   U         0 0          0 eth0
link-local      *               255.255.0.0     U         0 0          0 eth0
default         192.168.0.1     0.0.0.0         UG        0 0          0 eth0

14. Showing Network Interface Transactions

Showing network interface packet transactions including both transferring and receiving packets with MTU size.

# netstat -i

Kernel Interface table
Iface       MTU Met    RX-OK RX-ERR RX-DRP RX-OVR    TX-OK TX-ERR TX-DRP TX-OVR Flg
eth0       1500   0     4459      0      0      0     4057      0      0      0 BMRU
lo        16436   0        8      0      0      0        8      0      0      0 LRU

15. Showing Kernel Interface Table

Showing Kernel interface table, similar to ifconfig command.

# netstat -ie

Kernel Interface table
eth0      Link encap:Ethernet  HWaddr 00:0C:29:B4:DA:21
          inet addr:192.168.0.2  Bcast:192.168.0.255  Mask:255.255.255.0
          inet6 addr: fe80::20c:29ff:feb4:da21/64 Scope:Link
          UP BROADCAST RUNNING MULTICAST  MTU:1500  Metric:1
          RX packets:4486 errors:0 dropped:0 overruns:0 frame:0
          TX packets:4077 errors:0 dropped:0 overruns:0 carrier:0
          collisions:0 txqueuelen:1000
          RX bytes:2720253 (2.5 MiB)  TX bytes:1161745 (1.1 MiB)
          Interrupt:18 Base address:0x2000

lo        Link encap:Local Loopback
          inet addr:127.0.0.1  Mask:255.0.0.0
          inet6 addr: ::1/128 Scope:Host
          UP LOOPBACK RUNNING  MTU:16436  Metric:1
          RX packets:8 errors:0 dropped:0 overruns:0 frame:0
          TX packets:8 errors:0 dropped:0 overruns:0 carrier:0
          collisions:0 txqueuelen:0
          RX bytes:480 (480.0 b)  TX bytes:480 (480.0 b)

16. Displaying IPv4 and IPv6 Information

Displays multicast group membership information for both IPv4 and IPv6.

# netstat -g

IPv6/IPv4 Group Memberships
Interface       RefCnt Group
--------------- ------ ---------------------
lo              1      all-systems.mcast.net
eth0            1      224.0.0.251
eth0            1      all-systems.mcast.net
lo              1      ff02::1
eth0            1      ff02::202
eth0            1      ff02::1:ffb4:da21
eth0            1      ff02::1

17. Print Netstat Information Continuously

To get netstat information every few second, then use the following command, it will print netstat information continuously, say every few seconds.

# netstat -c

Active Internet connections (w/o servers)
Proto Recv-Q Send-Q Local Address               Foreign Address             State
tcp        0      0 tecmint.com:http   sg2nlhg007.shr.prod.s:36944 TIME_WAIT
tcp        0      0 tecmint.com:http   sg2nlhg010.shr.prod.s:42110 TIME_WAIT
tcp        0    132 tecmint.com:ssh    115.113.134.3.static-:64662 ESTABLISHED
tcp        0      0 tecmint.com:http   crawl-66-249-71-240.g:41166 TIME_WAIT
tcp        0      0 localhost.localdomain:54823 localhost.localdomain:smtp  TIME_WAIT
tcp        0      0 localhost.localdomain:54822 localhost.localdomain:smtp  TIME_WAIT
tcp        0      0 tecmint.com:http   sg2nlhg010.shr.prod.s:42091 TIME_WAIT
tcp        0      0 tecmint.com:http   sg2nlhg007.shr.prod.s:36998 TIME_WAIT

18. Finding non supportive Address

Finding un-configured address families with some useful information.

# netstat --verbose

netstat: no support for `AF IPX' on this system.
netstat: no support for `AF AX25' on this system.
netstat: no support for `AF X25' on this system.
netstat: no support for `AF NETROM' on this system.

19. Finding Listening Programs

Find out how many listening programs running on a port.

# netstat -ap | grep http

tcp        0      0 *:http                      *:*                         LISTEN      9056/httpd
tcp        0      0 *:https                     *:*                         LISTEN      9056/httpd
tcp        0      0 tecmint.com:http   sg2nlhg008.shr.prod.s:35248 TIME_WAIT   -
tcp        0      0 tecmint.com:http   sg2nlhg007.shr.prod.s:57783 TIME_WAIT   -
tcp        0      0 tecmint.com:http   sg2nlhg007.shr.prod.s:57769 TIME_WAIT   -
tcp        0      0 tecmint.com:http   sg2nlhg008.shr.prod.s:35270 TIME_WAIT   -
tcp        0      0 tecmint.com:http   sg2nlhg009.shr.prod.s:41637 TIME_WAIT   -
tcp        0      0 tecmint.com:http   sg2nlhg009.shr.prod.s:41614 TIME_WAIT   -
unix  2      [ ]         STREAM     CONNECTED     88586726 10394/httpd

20. Displaying RAW Network Statistics

# netstat --statistics --raw

Ip:
    62175683 total packets received
    52970 with invalid addresses
    0 forwarded
Icmp:
    875519 ICMP messages received
        destination unreachable: 901671
        echo request: 8
        echo replies: 16253
IcmpMsg:
        InType0: 83
IpExt:
    InMcastPkts: 117

That’s it, If you are looking for more information and options about netstat command, refer netstat manual docs or use man netstat command to know all the information. If we’ve missed anything in the list, please inform us using our comment section below. So, we could keep updating this list based on your comments.

Source

How to Set or Change Hostname in CentOS 7

A computer hostname represents a unique name that gets assigned to a computer in a network in order to uniquely identify that computer in that specific network. A computer hostname can be set to any name you like, but you should keep in mind the following rules:

  • hostnames can contain letters (from a to z).
  • hostnames can contain digits (from 0 to 9).
  • hostnames can contain only the hyphen character ( – ) as special character.
  • hostnames can contains the dot special character ( . ).
  • hostnames can contain a combination of all three rules but must start and end with a letter or a number.
  • hostnames letters are case-insensitive.
  • hostnames must contains between 2 and 63 characters long.
  • hostnames should be descriptive (to ease identifying the computer purpose, location, geographical area, etc on the network).

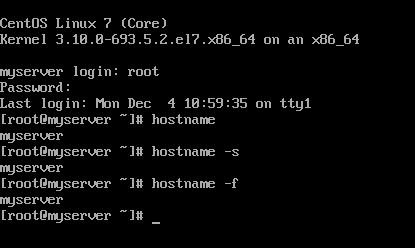
In order to display a computer name in CentOS 7 and RHEL 7 systems via console, issue the following command. The -s flag displayed the computer short name (hostname only) and the -f flag displays the computer FQDN in the network (only if the computer is a part of a domain or realm and the FQDN is set).

# hostname
# hostname -s
# hostname -f

Check Hostname in CentOS 7

Check Hostname in CentOS 7

You can also display a Linux system hostname by inspecting the content of /etc/hostname file using the cat command.

# cat /etc/hostname

Display CentOS 7 Hostname

Display CentOS 7 Hostname

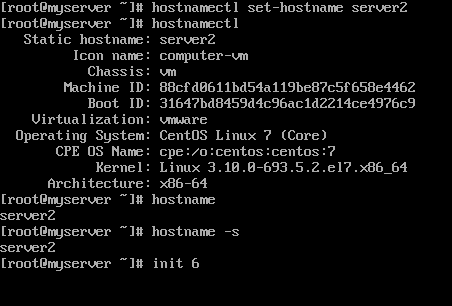
In order to change or set a CentOS 7 machine hostname, use the hostnamectl command as shown in the below command excerpt.

# hostnamectl set-hostname your-new-hostname

In addition to hostname command you can also use hostnamectl command to display a Linux machine hostname.

# hostnamectl

In order to apply the new hostname, a system reboot is required, issue one of the below commands in order to reboot a CentOS 7 machine.

# init 6
# systemctl reboot
# shutdown -r

Set CentOS 7 Hostname

Set CentOS 7 Hostname

A second method to setup a CentOS 7 machine hostname is to manually edit the /etc/hostname file and type your new hostname. Also, a system reboot is necessary in order to apply the new machine name.

# vi /etc/hostname

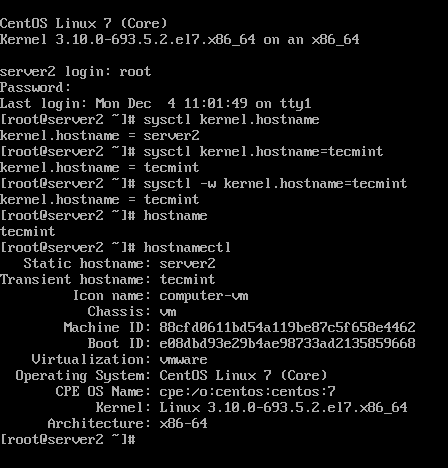
A third method that can be used to change a CentOS 7 machine hostname is by using Linux sysctl interface. However, using this method to change machine name results in setting-up the machine transient hostname.

The transient hostname is a special hostname initialized and maintained only by the Linux kernel as an auxiliary machine name in addition to he static hostname and doesn’t survive reboots.

# sysctl kernel.hostname
# sysctl kernel.hostname=new-hostname
# sysctl -w kernel.hostname=new-hostname

To display machine transient hostname issue the below commands.

# sysctl kernel.hostname
# hostnamectl

Change CentOS 7 Hostname

Change CentOS 7 Hostname

Finally, the hostnamectl command can be used to achieve the following hostname setups: –pretty–static, and –transient.

Although, there are other more specific ways to change a Linux machine hostname, such as issuing nmtui command or manually editing some configuration files specific to each Linux distribution (/etc/sysconfig/network-scripts/ifcfg-ethX for CentOS), the above rules are general available regardless of the used Linux distribution.

Source

How to Customize Bash Colors and Content in Linux Terminal Prompt

Today, Bash is the default shell in most (if not all) modern Linux distributions. However, you may have noticed that the text color in the terminal and the prompt content can be different from one distro to another.

Suggested Read: 5 Most Frequently Used Open Source Shells for Linux

In case you have been wondering how to customize this for better accessibility or mere whim, keep reading – in this article we will explain how to do just that.

The PS1 Bash Environment Variable

The command prompt and terminal appearance are governed by an environment variable called PS1. According to the Bash man page, PS1 represents the primary prompt string which is displayed when the shell is ready to read a command.

The allowed content in PS1 consists of several backslash-escaped special characters whose meaning is listed in the PROMPTING section of the man page.

To illustrate, let’s display the current content of PS1 in our system (this may be somewhat different in your case):

$ echo $PS1

[\u@\h \W]$

We will now explain how to customize PS1 as per our needs.

Customizing the PS1 Format

According to the PROMPTING section in the man page, this is the meaning of each special character:

  1. \u: the username of the current user.
  2. \h: the hostname up to the first dot (.) in the Fully-Qualified Domain Name.
  3. \W: the basename of the current working directory, with $HOME abbreviated with a tilde (~).
  4. \$: If the current user is root, display #$ otherwise.

For example, we may want to consider adding \! If we want to display the history number of the current command, or \H if we want to display the FQDN instead of the short server name.

In the following example we will import both into our current environment by executing this command:

PS1="[\u@\H \W \!]$"

When you press Enter you will see that the prompt content changes as shown below. Compare the prompt before and after executing the above command:

Customize Linux Terminal Prompt PS1

Customize Linux Terminal Prompt PS1

Now let’s go one step further and change the color of the user and hostname in command prompt – both the text and its surrounding background.

Actually, we can customize 3 aspects of the prompt:

Text Format Foreground (text) color Background color
0: normal text 30: Black 40: Black
1: bold 31: Red 41: Red
4: Underlined text 32: Green 42: Green
33: Yellow 43: Yellow
34: Blue 44: Blue
35: Purple 45: Purple
36: Cyan 46: Cyan
37: White 47: White

We will use the \e special character at the beginning and an m at the end to indicate that what follows is a color sequence.

In this sequence the three values (backgroundformat, and foreground) are separated by commas (if no value is given the default is assumed).

Suggested Read: Learn Bash Shell Scripting in Linux

Also, since the value ranges are different, it does not matter which one (backgroundformat, or foreground) you specify first.

For example, the following PS1 will cause the prompt to appear in yellow underlined text with red background:

PS1="\e[41;4;33m[\u@\h \W]$ "

Change Linux Terminal Color Prompt PS1

Change Linux Terminal Color Prompt PS1

As good as it looks, this customization will only last for the current user session. If you close your terminal or exit the session, the changes will be lost.

In order to make these changes permanent, you will have to add the following line to ~/.bashrc or ~/.bash_profile depending on your distribution:

PS1="\e[41;4;33m[\u@\h \W]$ "

Feel free to play around with the colors to find what works best for you.

Summary

In this article we have explained how to customize the color and content of your Bash prompt. If you have questions or suggestions about this post, feel free to use the comment form below to reach us. We look forward to hearing from you!

Source

How to View Colored Man Pages in Linux

In Unix-like operating systems, a man page (in full manual page) is a documentation for a terminal-based program/tool/utility (commonly known as a command). It contains the name of the command, syntax for using it, a description, options available, author, copyright, related commands etc.

Read Alsoccat – Show ‘cat Command’ Output with Syntax Highlighting or Colorizing

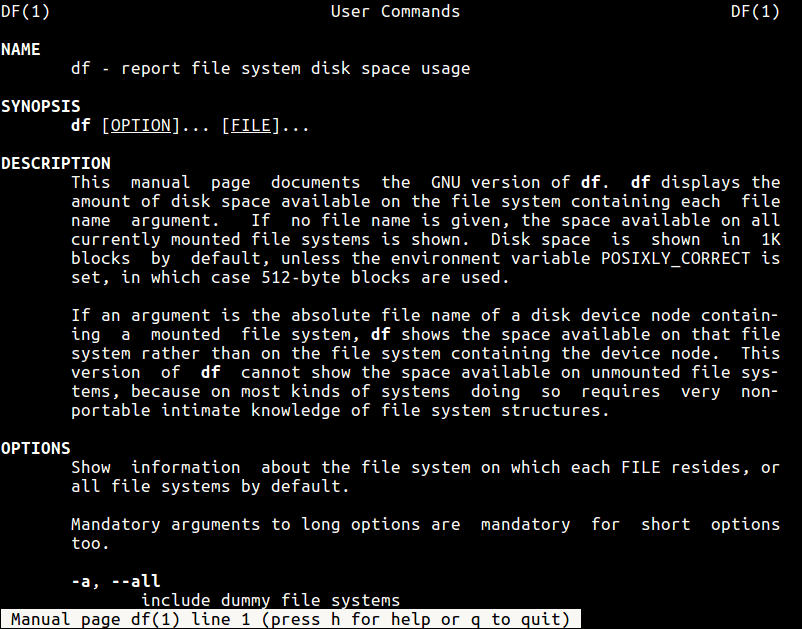
You can read the manual page for a Linux command as follows; this will display the man page for the df command:

$ man df 

df Command Man Page

df Command Man Page

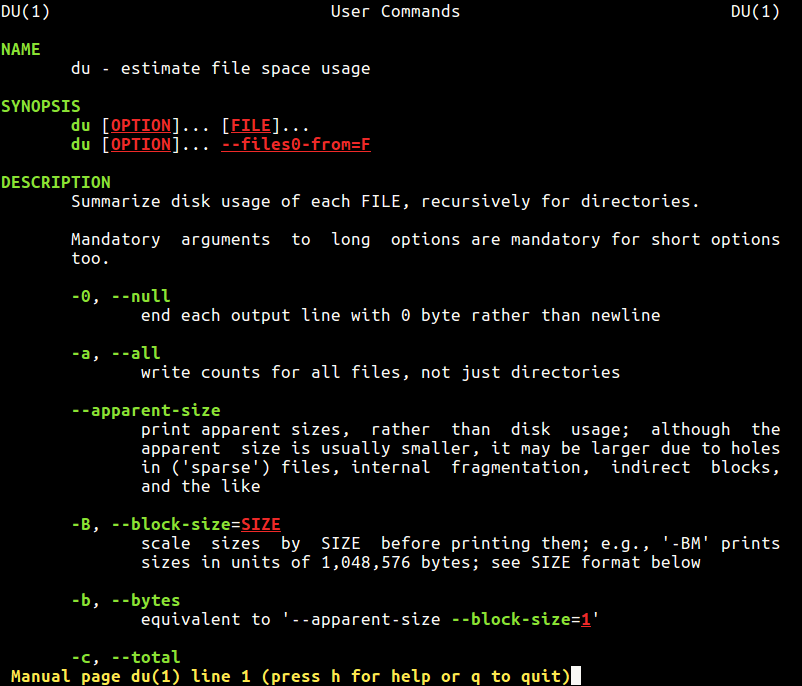
By default, the man program normally uses a terminal pager program such as more or less to format its output, and the default view is normally in white color for every kind of text (bold, underlined etc..).

You can make some tweaks to your ~/.bashrc file to get nicely colored man pages by specifying a color scheme using various LESS_TERMCAP variables.

$ vi ~/.bashrc

Add following color scheme variables.

export LESS_TERMCAP_mb=$'\e[1;32m'
export LESS_TERMCAP_md=$'\e[1;32m'
export LESS_TERMCAP_me=$'\e[0m'
export LESS_TERMCAP_se=$'\e[0m'
export LESS_TERMCAP_so=$'\e[01;33m'
export LESS_TERMCAP_ue=$'\e[0m'
export LESS_TERMCAP_us=$'\e[1;4;31m'

Following are the color codes that we used in the above configuration.

  • 31 – red
  • 32 – green
  • 33 – yellow

And here are the meanings of the escape codes used in the above configuration.

  • 0 – reset/normal
  • 1 – bold
  • 4 – underlined

You can additionally reset your terminal by typing reset or even start up another shell. Now when you try to view a man page df command, it should look like this, nicer than the default view.

Colored Man Page

Colored Man Page

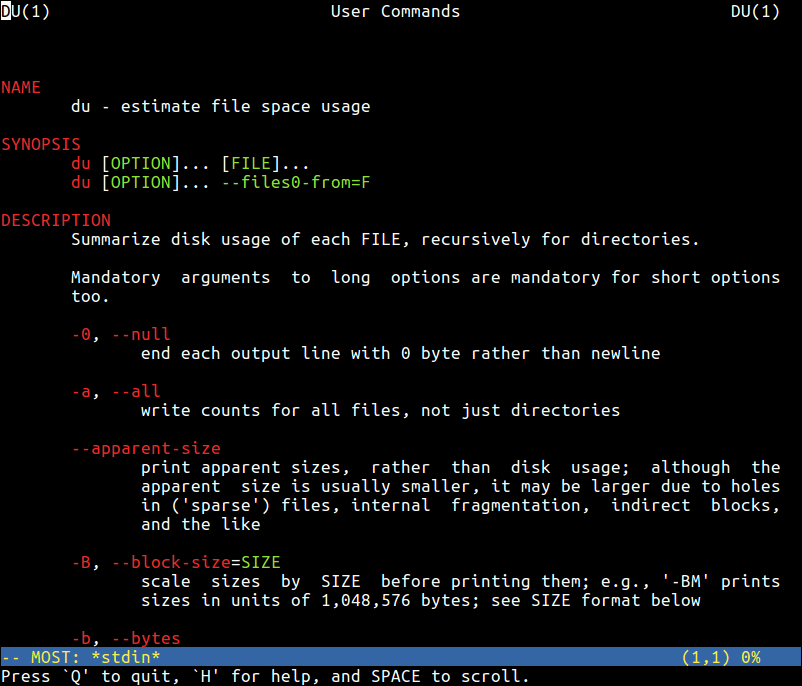
Alternatively, you can use the MOST paging program, which works on Unix-like operating systems and supports multiple windows and can scroll left and right.

$ sudo apt install most		#Debian/Ubuntu 
# yum install most		#RHEL/CentOS
# dnf install most		#Fedora 22+

Next, add the line below in your ~/.bashrc file, then source the file like before and possibly reset your terminal.

export PAGER="most"

Most Paging Program for Linux

Most Paging Program for Linux

Read AlsoHow to Customize Bash Colors and Content in Linux Terminal Prompt

In this article, we showed you how to display beautifully colored man pages in Linux. To send us any queries or share any useful Linux shell tips/tricks, use the comment section below.

Source

How to Start Linux Command in Background and Detach Process in Terminal

In this guide, we shall bring to light a simple yet important concept in process handling in a Linux system, that is how to completely detach a process from its controlling terminal.

When a process is associated with a terminal, two problems might occur:

  1. your controlling terminal is filled with so much output data and error/diagnostic messages.
  2. in the event that the terminal is closed, the process together with its child processes will be terminated.

To deal with these two issues, you need to totally detach a process from a controlling terminal. Before we actually move to solve the problem, let us briefly cover how to run processes in the background.

How to Start a Linux Process or Command in Background

If a process is already in execution, such as the tar command example below, simply press Ctrl+Z to stop it then enter the command bg to continue with its execution in the background as a job.

You can view all your background jobs by typing jobs. However, its stdinstdoutstderr are still joined to the terminal.

$ tar -czf home.tar.gz .
$ bg
$ jobs

Run Linux Command in Background

Run Linux Command in Background

You can as well run a process directly from the background using the ampersand, & sign.

$ tar -czf home.tar.gz . &
$ jobs

Start Linux Process in Background

Start Linux Process in Background

Take a look at the example below, although the tar command was started as a background job, an error message was still sent to the terminal meaning the process is still connected to the controlling terminal.

$ tar -czf home.tar.gz . &
$ jobs

Linux Process Running in Background Message

Linux Process Running in Background Message

Keep Linux Processes Running After Exiting Terminal

We will use disown command, it is used after the a process has been launched and put in the background, it’s work is to remove a shell job from the shell’s active list jobs, therefore you will not use fgbg commands on that particular job anymore.

In addition, when you close the controlling terminal, the job will not hang or send a SIGHUP to any child jobs.

Suggested Read: 5 Ways to Keep Remote SSH Sessions and Processes Running

Let’s take a look at the below example of using diswon bash built-in function.

$ sudo rsync Templates/* /var/www/html/files/ &
$ jobs
$ disown  -h  %1
$ jobs

Keep Linux Process Running After Closing Terminal

Keep Linux Process Running After Closing Terminal

You can also use nohup command, which also enables a process to continue running in the background when a user exits a shell.

$ nohup tar -czf iso.tar.gz Templates/* &
$ jobs

Put Linux Process in Background After Closing Shell

Put Linux Process in Background After Closing Shell

Detach a Linux Processes From Controlling Terminal

Therefore, to completely detach a process from a controlling terminal, use the command format below, this is more effective for graphical user interface (GUI) applications such as firefox:

$ firefox </dev/null &>/dev/null &

In Linux, /dev/null is a special device file which writes-off (gets rid of) all data written to it, in the command above, input is read from, and output is sent to /dev/null.

Suggested Read: 10 Screen Command Examples to Detach Terminal Sessions

As a concluding remark, provided a process is connected to a controlling terminal, as a user, you will see several output lines of the process data as well as error messages on your terminal. Again, when you close the a controlling terminal, your process and child processes will be terminated.

Importantly, for any questions or remarks on the subject, reach us by using the comment form below.

Source

12 Tcpdump Commands – A Network Sniffer Tool

This is our another ongoing series of packet sniffer tool called tcpdump. Here, we are going to show you how to install tcpdump and then we discuss and cover some useful commands with their practical examples.

Linux tcpdump command examples

Linux tcpdump command examples

tcpdump is a most powerful and widely used command-line packets sniffer or package analyzer tool which is used to capture or filter TCP/IP packets that received or transferred over a network on a specific interface. It is available under most of the Linux/Unix based operating systems. tcpdump also gives us a option to save captured packets in a file for future analysis. It saves the file in a pcap format, that can be viewed by tcpdump command or a open source GUI based tool called Wireshark (Network Protocol Analyzier) that reads tcpdump pcap format files.

How to Install tcpdump in Linux

Many of Linux distributions already shipped with tcpdump tool, if in case you don’t have it on systems, you can install it using following Yum command.

# yum install tcpdump

Once tcpdump tool is installed on systems, you can continue to browse following commands with their examples.

1. Capture Packets from Specific Interface

The command screen will scroll up until you interrupt and when we execute tcpdump command it will captures from all the interfaces, however with -i switch only capture from desire interface.

# tcpdump -i eth0

tcpdump: verbose output suppressed, use -v or -vv for full protocol decode
listening on eth0, link-type EN10MB (Ethernet), capture size 65535 bytes
11:33:31.976358 IP 172.16.25.126.ssh > 172.16.25.125.apwi-rxspooler: Flags [P.], seq 3500440357:3500440553, ack 3652628334, win 18760, length 196
11:33:31.976603 IP 172.16.25.125.apwi-rxspooler > 172.16.25.126.ssh: Flags [.], ack 196, win 64487, length 0
11:33:31.977243 ARP, Request who-has tecmint.com tell 172.16.25.126, length 28
11:33:31.977359 ARP, Reply tecmint.com is-at 00:14:5e:67:26:1d (oui Unknown), length 46
11:33:31.977367 IP 172.16.25.126.54807 > tecmint.com: 4240+ PTR? 125.25.16.172.in-addr.arpa. (44)
11:33:31.977599 IP tecmint.com > 172.16.25.126.54807: 4240 NXDomain 0/1/0 (121)
11:33:31.977742 IP 172.16.25.126.44519 > tecmint.com: 40988+ PTR? 126.25.16.172.in-addr.arpa. (44)
11:33:32.028747 IP 172.16.20.33.netbios-ns > 172.16.31.255.netbios-ns: NBT UDP PACKET(137): QUERY; REQUEST; BROADCAST
11:33:32.112045 IP 172.16.21.153.netbios-ns > 172.16.31.255.netbios-ns: NBT UDP PACKET(137): QUERY; REQUEST; BROADCAST
11:33:32.115606 IP 172.16.21.144.netbios-ns > 172.16.31.255.netbios-ns: NBT UDP PACKET(137): QUERY; REQUEST; BROADCAST
11:33:32.156576 ARP, Request who-has 172.16.16.37 tell old-oraclehp1.midcorp.mid-day.com, length 46
11:33:32.348738 IP tecmint.com > 172.16.25.126.44519: 40988 NXDomain 0/1/0 (121)

2. Capture Only N Number of Packets

When you run tcpdump command it will capture all the packets for specified interface, until you Hit cancel button. But using -c option, you can capture specified number of packets. The below example will only capture 6packets.

# tcpdump -c 5 -i eth0

tcpdump: verbose output suppressed, use -v or -vv for full protocol decode
listening on eth0, link-type EN10MB (Ethernet), capture size 65535 bytes
11:40:20.281355 IP 172.16.25.126.ssh > 172.16.25.125.apwi-rxspooler: Flags [P.], seq 3500447285:3500447481, ack 3652629474, win 18760, length 196
11:40:20.281586 IP 172.16.25.125.apwi-rxspooler > 172.16.25.126.ssh: Flags [.], ack 196, win 65235, length 0
11:40:20.282244 ARP, Request who-has tecmint.com tell 172.16.25.126, length 28
11:40:20.282360 ARP, Reply tecmint.com is-at 00:14:5e:67:26:1d (oui Unknown), length 46
11:40:20.282369 IP 172.16.25.126.53216 > tecmint.com.domain: 49504+ PTR? 125.25.16.172.in-addr.arpa. (44)
11:40:20.332494 IP tecmint.com.netbios-ssn > 172.16.26.17.nimaux: Flags [P.], seq 3058424861:3058424914, ack 693912021, win 64190, length 53 NBT Session Packet: Session Message
6 packets captured
23 packets received by filter
0 packets dropped by kernel

3. Print Captured Packets in ASCII

The below tcpdump command with option -A displays the package in ASCII format. It is a character-encoding scheme format.

# tcpdump -A -i eth0

tcpdump: verbose output suppressed, use -v or -vv for full protocol decode
listening on eth0, link-type EN10MB (Ethernet), capture size 65535 bytes
09:31:31.347508 IP 192.168.0.2.ssh > 192.168.0.1.nokia-ann-ch1: Flags [P.], seq 3329372346:3329372542, ack 4193416789, win 17688, length 196
M.r0...vUP.E.X.......~.%..>N..oFk.........KQ..)Eq.d.,....r^l......m\.oyE....-....g~m..Xy.6..1.....c.O.@...o_..J....i.*.....2f.mQH...Q.c...6....9.v.gb........;..4.).UiCY]..9..x.)..Z.XF....'|..E......M..u.5.......ul
09:31:31.347760 IP 192.168.0.1.nokia-ann-ch1 > 192.168.0.2.ssh: Flags [.], ack 196, win 64351, length 0
M....vU.r1~P.._..........
^C09:31:31.349560 IP 192.168.0.2.46393 > b.resolvers.Level3.net.domain: 11148+ PTR? 1.0.168.192.in-addr.arpa. (42)
E..F..@.@............9.5.2.f+............1.0.168.192.in-addr.arpa.....

3 packets captured
11 packets received by filter
0 packets dropped by kernel

4. Display Available Interfaces

To list number of available interfaces on the system, run the following command with -D option.

# tcpdump -D

 1.eth0
2.eth1
3.usbmon1 (USB bus number 1)
4.usbmon2 (USB bus number 2)
5.usbmon3 (USB bus number 3)
6.usbmon4 (USB bus number 4)
7.usbmon5 (USB bus number 5)
8.any (Pseudo-device that captures on all interfaces)
9.lo

5. Display Captured Packets in HEX and ASCII

The following command with option -XX capture the data of each packet, including its link level header in HEXand ASCII format.

# tcpdump -XX -i eth0

11:51:18.974360 IP 172.16.25.126.ssh > 172.16.25.125.apwi-rxspooler: Flags [P.], seq 3509235537:3509235733, ack 3652638190, win 18760, length 196
        0x0000:  b8ac 6f2e 57b3 0001 6c99 1468 0800 4510  ..o.W...l..h..E.
        0x0010:  00ec 8783 4000 4006 275d ac10 197e ac10  ....@.@.']...~..
        0x0020:  197d 0016 1129 d12a af51 d9b6 d5ee 5018  .}...).*.Q....P.
        0x0030:  4948 8bfa 0000 0e12 ea4d 22d1 67c0 f123  IH.......M".g..#
        0x0040:  9013 8f68 aa70 29f3 2efc c512 5660 4fe8  ...h.p).....V`O.
        0x0050:  590a d631 f939 dd06 e36a 69ed cac2 95b6  Y..1.9...ji.....
        0x0060:  f8ba b42a 344b 8e56 a5c4 b3a2 ed82 c3a1  ...*4K.V........
        0x0070:  80c8 7980 11ac 9bd7 5b01 18d5 8180 4536  ..y.....[.....E6
        0x0080:  30fd 4f6d 4190 f66f 2e24 e877 ed23 8eb0  0.OmA..o.$.w.#..
        0x0090:  5a1d f3ec 4be4 e0fb 8553 7c85 17d9 866f  Z...K....S|....o
        0x00a0:  c279 0d9c 8f9d 445b 7b01 81eb 1b63 7f12  .y....D[{....c..
        0x00b0:  71b3 1357 52c7 cf00 95c6 c9f6 63b1 ca51  q..WR.......c..Q
        0x00c0:  0ac6 456e 0620 38e6 10cb 6139 fb2a a756  ..En..8...a9.*.V
        0x00d0:  37d6 c5f3 f5f3 d8e8 3316 d14f d7ab fd93  7.......3..O....
        0x00e0:  1137 61c1 6a5c b4d1 ddda 380a f782 d983  .7a.j\....8.....
        0x00f0:  62ff a5a9 bb39 4f80 668a                 b....9O.f.
11:51:18.974759 IP 172.16.25.126.60952 > mddc-01.midcorp.mid-day.com.domain: 14620+ PTR? 125.25.16.172.in-addr.arpa. (44)
        0x0000:  0014 5e67 261d 0001 6c99 1468 0800 4500  ..^g&...l..h..E.
        0x0010:  0048 5a83 4000 4011 5e25 ac10 197e ac10  .HZ.@.@.^%...~..
        0x0020:  105e ee18 0035 0034 8242 391c 0100 0001  .^...5.4.B9.....
        0x0030:  0000 0000 0000 0331 3235 0232 3502 3136  .......125.25.16
        0x0040:  0331 3732 0769 6e2d 6164 6472 0461 7270  .172.in-addr.arp
        0x0050:  6100 000c 0001                           a.....

6. Capture and Save Packets in a File

As we said, that tcpdump has a feature to capture and save the file in a .pcap format, to do this just execute command with -w option.

# tcpdump -w 0001.pcap -i eth0

tcpdump: listening on eth0, link-type EN10MB (Ethernet), capture size 65535 bytes
4 packets captured
4 packets received by filter
0 packets dropped by kernel

7. Read Captured Packets File

To read and analyze captured packet 0001.pcap file use the command with -r option, as shown below.

# tcpdump -r 0001.pcap

reading from file 0001.pcap, link-type EN10MB (Ethernet)
09:59:34.839117 IP 192.168.0.2.ssh > 192.168.0.1.nokia-ann-ch1: Flags [P.], seq 3353041614:3353041746, ack 4193563273, win 18760, length 132
09:59:34.963022 IP 192.168.0.1.nokia-ann-ch1 > 192.168.0.2.ssh: Flags [.], ack 132, win 65351, length 0
09:59:36.935309 IP 192.168.0.1.netbios-dgm > 192.168.0.255.netbios-dgm: NBT UDP PACKET(138)
09:59:37.528731 IP 192.168.0.1.nokia-ann-ch1 > 192.168.0.2.ssh: Flags [P.], seq 1:53, ack 132, win 65351, length 5

8. Capture IP address Packets

To capture packets for a specific interface, run the following command with option -n.

# tcpdump -n -i eth0

tcpdump: verbose output suppressed, use -v or -vv for full protocol decode
listening on eth0, link-type EN10MB (Ethernet), capture size 65535 bytes
12:07:03.952358 IP 172.16.25.126.ssh > 172.16.25.125.apwi-rxspooler: Flags [P.], seq 3509512873:3509513069, ack 3652639034, win 18760, length 196
12:07:03.952602 IP 172.16.25.125.apwi-rxspooler > 172.16.25.126.ssh: Flags [.], ack 196, win 64171, length 0
12:07:03.953311 IP 172.16.25.126.ssh > 172.16.25.125.apwi-rxspooler: Flags [P.], seq 196:504, ack 1, win 18760, length 308
12:07:03.954288 IP 172.16.25.126.ssh > 172.16.25.125.apwi-rxspooler: Flags [P.], seq 504:668, ack 1, win 18760, length 164
12:07:03.954502 IP 172.16.25.125.apwi-rxspooler > 172.16.25.126.ssh: Flags [.], ack 668, win 65535, length 0
12:07:03.955298 IP 172.16.25.126.ssh > 172.16.25.125.apwi-rxspooler: Flags [P.], seq 668:944, ack 1, win 18760, length 276
12:07:03.955425 IP 172.16.23.16.netbios-ns > 172.16.31.255.netbios-ns: NBT UDP PACKET(137): REGISTRATION; REQUEST; BROADCAST
12:07:03.956299 IP 172.16.25.126.ssh > 172.16.25.125.apwi-rxspooler: Flags [P.], seq 944:1236, ack 1, win 18760, length 292
12:07:03.956535 IP 172.16.25.125.apwi-rxspooler > 172.16.25.126.ssh: Flags [.], ack 1236, win 64967, length 0

9. Capture only TCP Packets.

To capture packets based on TCP port, run the following command with option tcp.

# tcpdump -i eth0 tcp

tcpdump: verbose output suppressed, use -v or -vv for full protocol decode
listening on eth0, link-type EN10MB (Ethernet), capture size 65535 bytes
12:10:36.216358 IP 172.16.25.126.ssh > 172.16.25.125.apwi-rxspooler: Flags [P.], seq 3509646029:3509646225, ack 3652640142, win 18760, length 196
12:10:36.216592 IP 172.16.25.125.apwi-rxspooler > 172.16.25.126.ssh: Flags [.], ack 196, win 64687, length 0
12:10:36.219069 IP 172.16.25.126.ssh > 172.16.25.125.apwi-rxspooler: Flags [P.], seq 196:504, ack 1, win 18760, length 308
12:10:36.220039 IP 172.16.25.126.ssh > 172.16.25.125.apwi-rxspooler: Flags [P.], seq 504:668, ack 1, win 18760, length 164
12:10:36.220260 IP 172.16.25.125.apwi-rxspooler > 172.16.25.126.ssh: Flags [.], ack 668, win 64215, length 0
12:10:36.222045 IP 172.16.25.126.ssh > 172.16.25.125.apwi-rxspooler: Flags [P.], seq 668:944, ack 1, win 18760, length 276
12:10:36.223036 IP 172.16.25.126.ssh > 172.16.25.125.apwi-rxspooler: Flags [P.], seq 944:1108, ack 1, win 18760, length 164
12:10:36.223252 IP 172.16.25.125.apwi-rxspooler > 172.16.25.126.ssh: Flags [.], ack 1108, win 65535, length 0
^C12:10:36.223461 IP mid-pay.midcorp.mid-day.com.netbios-ssn > 172.16.22.183.recipe: Flags [.], seq 283256512:283256513, ack 550465221, win 65531, length 1[|SMB]

10. Capture Packet from Specific Port

Let’s say you want to capture packets for specific port 22, execute the below command by specifying port number 22 as shown below.

# tcpdump -i eth0 port 22

tcpdump: verbose output suppressed, use -v or -vv for full protocol decode
listening on eth0, link-type EN10MB (Ethernet), capture size 65535 bytes
10:37:49.056927 IP 192.168.0.2.ssh > 192.168.0.1.nokia-ann-ch1: Flags [P.], seq 3364204694:3364204890, ack 4193655445, win 20904, length 196
10:37:49.196436 IP 192.168.0.2.ssh > 192.168.0.1.nokia-ann-ch1: Flags [P.], seq 4294967244:196, ack 1, win 20904, length 248
10:37:49.196615 IP 192.168.0.1.nokia-ann-ch1 > 192.168.0.2.ssh: Flags [.], ack 196, win 64491, length 0
10:37:49.379298 IP 192.168.0.2.ssh > 192.168.0.1.nokia-ann-ch1: Flags [P.], seq 196:616, ack 1, win 20904, length 420
10:37:49.381080 IP 192.168.0.2.ssh > 192.168.0.1.nokia-ann-ch1: Flags [P.], seq 616:780, ack 1, win 20904, length 164
10:37:49.381322 IP 192.168.0.1.nokia-ann-ch1 > 192.168.0.2.ssh: Flags [.], ack 780, win 65535, length 0

11. Capture Packets from source IP

To capture packets from source IP, say you want to capture packets for 192.168.0.2, use the command as follows.

# tcpdump -i eth0 src 192.168.0.2

tcpdump: verbose output suppressed, use -v or -vv for full protocol decode
listening on eth0, link-type EN10MB (Ethernet), capture size 65535 bytes
10:49:15.746474 IP 192.168.0.2.ssh > 192.168.0.1.nokia-ann-ch1: Flags [P.], seq 3364578842:3364579038, ack 4193668445, win 20904, length 196
10:49:15.748554 IP 192.168.0.2.56200 > b.resolvers.Level3.net.domain: 11289+ PTR? 1.0.168.192.in-addr.arpa. (42)
10:49:15.912165 IP 192.168.0.2.56234 > b.resolvers.Level3.net.domain: 53106+ PTR? 2.0.168.192.in-addr.arpa. (42)
10:49:16.074720 IP 192.168.0.2.33961 > b.resolvers.Level3.net.domain: 38447+ PTR? 2.2.2.4.in-addr.arpa. (38)

12. Capture Packets from destination IP

To capture packets from destination IP, say you want to capture packets for 50.116.66.139, use the command as follows.

# tcpdump -i eth0 dst 50.116.66.139

tcpdump: verbose output suppressed, use -v or -vv for full protocol decode
listening on eth0, link-type EN10MB (Ethernet), capture size 65535 bytes
10:55:01.798591 IP 192.168.0.2.59896 > 50.116.66.139.http: Flags [.], ack 2480401451, win 318, options [nop,nop,TS val 7955710 ecr 804759402], length 0
10:55:05.527476 IP 192.168.0.2.59894 > 50.116.66.139.http: Flags [F.], seq 2521556029, ack 2164168606, win 245, options [nop,nop,TS val 7959439 ecr 804759284], length 0
10:55:05.626027 IP 192.168.0.2.59894 > 50.116.66.139.http: Flags [.], ack 2, win 245, options [nop,nop,TS val 7959537 ecr 804759787], length 0

This article may help you to explore tcpdump command in depth and also to capture and analysis packets in future. There are number of options available, you can use the options as per your requirement. Please share if you find this article useful through our comment box.

Source

How to Monitor User Activity with psacct or acct Tools

psacct or acct both are open source application for monitoring users activities on the system. These applications runs in the background and keeps track of each users activity on your system as well as what resources are being consumed.

I personally used this program in our company, we have development team where our developers continuously work on servers. So, this is one of best program to keep a eye on them. This program provides an excellent way to monitor what users are doing, what commands are they firing, how much resources are being consumed by them, how long users are active on the system. Another great feature of this program is it gives total resources consumed by services like Apache, MySQL, FTP,SSH etc.

Read AlsoMonitor Linux Commands Executed by System Users in Real-time

I think this is one of the great and must needed application for every Linux/Unix System Administrators, who wanted to keep a track of user activities on their servers/systems.

The psacct or acct package provides several features for monitoring process activities.

  1. ac command prints the statistics of user logins/logouts (connect time) in hours.
  2. lastcomm command prints the information of previously executed commands of user.
  3. accton commands is used to turn on/off process for accounting.
  4. sa command summarizes information of previously executed commands.
  5. last and lastb commands show listing of last logged in users.

Installing psacct or acct Packages

psacct or acct both are similar packages and there is not much difference between them, but the psacctpackage only available for rpm based distributions such as RHELCentOS and Fedora, whereas acct package available for distributions like UbuntuDebian and Linux Mint.

To install psacct package under rpm based distributions issue the following yum command.

# yum install psacct

To install acct package using apt-get command under Ubuntu / Debian / Linux Mint.

$ sudo apt-get install acct

OR

# apt-get install acct
Starting psacct or acct service

By default psacct service is in disabled mode and you need to start it manually under RHEL/CentOS/Fedorasystems. Use the following command to check the status of service.

# /etc/init.d/psacct status
Process accounting is disabled.

You see the status showing as disabled, so let’s start it manually using the following both commands. These two commands will create a /var/account/pacct file and start services.

# chkconfig psacct on
# /etc/init.d/psacct start
Starting process accounting:                               [  OK  ]

After starting service, check the status again, you will get status as enabled as shown below.

# /etc/init.d/psacct status
Process accounting is enabled.

Under UbuntuDebian and Mint service is started automatically, you don’t need to start it again.

Display Statistics of Users Connect Time

ac command without specifying any argument will displays total statistics of connect time in hours based on the user logins/logouts from the current wtmp file.

# ac
total     1814.03
Display Statistics of Users Day-wise

Using command “ac -d” will prints out the total login time in hours by day-wise.

# ac -d
Sep 17  total        5.23
Sep 18  total       15.20
Sep 24  total        3.21
Sep 25  total        2.27
Sep 26  total        2.64
Sep 27  total        6.19
Oct  1  total        6.41
Oct  3  total        2.42
Oct  4  total        2.52
Oct  5  total        6.11
Oct  8  total       12.98
Oct  9  total       22.65
Oct 11  total       16.18
Display Time Totals for each User

Using command “ac -p” will print the total login time of each user in hours.

# ac -p
        root                              1645.18
        tecmint                            168.96
        total     1814.14
Display Individual User Time

To get the total login statistics time of user “tecmint” in hours, use the command as.

# ac tecmint
 total      168.96
Display Day-Wise Logn Time of User

The following command will prints the day-wise total login time of user “tecmint” in hours.

# ac -d tecmint
Oct 11  total        8.01
Oct 12  total       24.00
Oct 15  total       70.50
Oct 16  total       23.57
Oct 17  total       24.00
Oct 18  total       18.70
Nov 20  total        0.18
Print All Account Activity Information

The “sa” command is used to print the summary of commands that were executed by users.

# sa
       2       9.86re       0.00cp     2466k   sshd*
       8       1.05re       0.00cp     1064k   man
       2      10.08re       0.00cp     2562k   sshd
      12       0.00re       0.00cp     1298k   psacct
       2       0.00re       0.00cp     1575k   troff
      14       0.00re       0.00cp      503k   ac
      10       0.00re       0.00cp     1264k   psacct*
      10       0.00re       0.00cp      466k   consoletype
       9       0.00re       0.00cp      509k   sa
       8       0.02re       0.00cp      769k   udisks-helper-a
       6       0.00re       0.00cp     1057k   touch
       6       0.00re       0.00cp      592k   gzip
       6       0.00re       0.00cp      465k   accton
       4       1.05re       0.00cp     1264k   sh*
       4       0.00re       0.00cp     1264k   nroff*
       2       1.05re       0.00cp     1264k   sh
       2       1.05re       0.00cp     1120k   less
       2       0.00re       0.00cp     1346k   groff
       2       0.00re       0.00cp     1383k   grotty
       2       0.00re       0.00cp     1053k   mktemp
       2       0.00re       0.00cp     1030k   iconv
       2       0.00re       0.00cp     1023k   rm
       2       0.00re       0.00cp     1020k   cat
       2       0.00re       0.00cp     1018k   locale
       2       0.00re       0.00cp      802k   gtbl
Where
  1. 9.86re is a “real time” as per wall clock minutes
  2. 0.01cp is a sum of system/user time in cpu minutes
  3. 2466k is a cpu-time averaged core usage, i.e. 1k units
  4. sshd command name
Print Individual User Information

To get the information of individual user, use the options -u.

# sa -u
root       0.00 cpu      465k mem accton
root       0.00 cpu     1057k mem touch
root       0.00 cpu     1298k mem psacct
root       0.00 cpu      466k mem consoletype
root       0.00 cpu     1264k mem psacct           *
root       0.00 cpu     1298k mem psacct
root       0.00 cpu      466k mem consoletype
root       0.00 cpu     1264k mem psacct           *
root       0.00 cpu     1298k mem psacct
root       0.00 cpu      466k mem consoletype
root       0.00 cpu     1264k mem psacct           *
root       0.00 cpu      465k mem accton
root       0.00 cpu     1057k mem touch
Print Number of Processes

This command prints the total number of processes and CPU minutes. If you see continue increase in these numbers, then its time to look into the system about what is happening.

# sa -m
sshd                                    2       9.86re       0.00cp     2466k
root                                  127      14.29re       0.00cp      909k
Print Sort by Percentage

The command “sa -c” displays the highest percentage of users.

# sa -c
 132  100.00%      24.16re  100.00%       0.01cp  100.00%      923k
       2    1.52%       9.86re   40.83%       0.00cp   53.33%     2466k   sshd*
       8    6.06%       1.05re    4.34%       0.00cp   20.00%     1064k   man
       2    1.52%      10.08re   41.73%       0.00cp   13.33%     2562k   sshd
      12    9.09%       0.00re    0.01%       0.00cp    6.67%     1298k   psacct
       2    1.52%       0.00re    0.00%       0.00cp    6.67%     1575k   troff
      18   13.64%       0.00re    0.00%       0.00cp    0.00%      509k   sa
      14   10.61%       0.00re    0.00%       0.00cp    0.00%      503k   ac
      10    7.58%       0.00re    0.00%       0.00cp    0.00%     1264k   psacct*
      10    7.58%       0.00re    0.00%       0.00cp    0.00%      466k   consoletype
       8    6.06%       0.02re    0.07%       0.00cp    0.00%      769k   udisks-helper-a
       6    4.55%       0.00re    0.00%       0.00cp    0.00%     1057k   touch
       6    4.55%       0.00re    0.00%       0.00cp    0.00%      592k   gzip
       6    4.55%       0.00re    0.00%       0.00cp    0.00%      465k   accton
       4    3.03%       1.05re    4.34%       0.00cp    0.00%     1264k   sh*
       4    3.03%       0.00re    0.00%       0.00cp    0.00%     1264k   nroff*
       2    1.52%       1.05re    4.34%       0.00cp    0.00%     1264k   sh
       2    1.52%       1.05re    4.34%       0.00cp    0.00%     1120k   less
       2    1.52%       0.00re    0.00%       0.00cp    0.00%     1346k   groff
       2    1.52%       0.00re    0.00%       0.00cp    0.00%     1383k   grotty
       2    1.52%       0.00re    0.00%       0.00cp    0.00%     1053k   mktemp
List Last Executed Commands of User

The ‘latcomm‘ command is used to search and display previously executed user commands information. You can also search commands of individual usernames. For example, we see commands of user (tecmint).

# lastcomm tecmint
su                      tecmint  pts/0      0.00 secs Wed Feb 13 15:56
ls                      tecmint  pts/0      0.00 secs Wed Feb 13 15:56
bash               F    tecmint  pts/0      0.00 secs Wed Feb 13 15:56
id                      tecmint  pts/0      0.00 secs Wed Feb 13 15:56
grep                    tecmint  pts/0      0.00 secs Wed Feb 13 15:56
bash               F    tecmint  pts/0      0.00 secs Wed Feb 13 15:56
dircolors               tecmint  pts/0      0.00 secs Wed Feb 13 15:56
bash               F    tecmint  pts/0      0.00 secs Wed Feb 13 15:56
tput                    tecmint  pts/0      0.00 secs Wed Feb 13 15:56
tty                     tecmint  pts/0      0.00 secs Wed Feb 13 15:56
bash               F    tecmint  pts/0      0.00 secs Wed Feb 13 15:56
id                      tecmint  pts/0      0.00 secs Wed Feb 13 15:56
bash               F    tecmint  pts/0      0.00 secs Wed Feb 13 15:56
id                      tecmint  pts/0      0.00 secs Wed Feb 13 15:56
Search Logs for Commands

With the help of the lastcomm command you will be able to view individual use of an each commands.

# lastcomm ls
ls                      tecmint  pts/0      0.00 secs Wed Feb 13 15:56

Source

Scrot: A Command Line Tool to Take Desktop/Server Screenshots Automatically in Linux

Scrot (SCReenshOT) is an open source, powerful and flexible, command line utility for taking screen shots of your DesktopTerminal or a Specific Window manually or automatically by Cron job. Scrot is similar to Linux ‘import‘ command, but uses ‘imlib2‘ library to capture and save images. It supports multiple image formats (JPG, PNG, GIF, etc), which you can specify while taking screen shots by using the tool.

Install Scrot Screenshot Tool in Linux

Scrot Screenshot Tool

Features of Scrot

  1. With scrot we can take screen shots easily without any additional work.
  2. We can also optimize the quality of the screen shots image (with the -q switch, followed by a quality level between 1 and 100. The default quality level is 75.
  3. It is very easy to installation and use.
  4. We can capture a specific window or a rectangular area on the screen with the help of switch.
  5. Can get all screen shots in a particular directory and also can store all screen shots in a remote PC or network server.
  6. Can monitor all Desktop PC in admin absent and prevent to unwanted activities.

Installing Scrot in Linux

We can install ‘Scrot‘ on any Linux distribution. If you’re using RedHat or Debian based distribution, you can use a package manager tool like yum or apt-get to install it as shown below.

# yum install scrot			[On RedHat based Systems]
$ sudo apt-get install scrot		[On Debian based Systems]

If you wish to install it from source code, then use the following commands.

$ wget http://linuxbrit.co.uk/downloads/scrot-0.8.tar.gz
$ tar -xvf scrot-0.8.tar.gz
$ cd /scrot-0.8
$ ./configure
$ make
$ su -c "make install"

Note: RedHat users, need to specify prefix location with configure command.

$ ./configure --prefix=/usr

How to Use Scrot to take Screen shots

As I said above, scrot can capture an entire desktop, a terminal or a specific window. With the help of scrot you can also take screen shots of a shell/terminal of a system that doesn’t have a GUI support.

Take Full Desktop Screen Shot

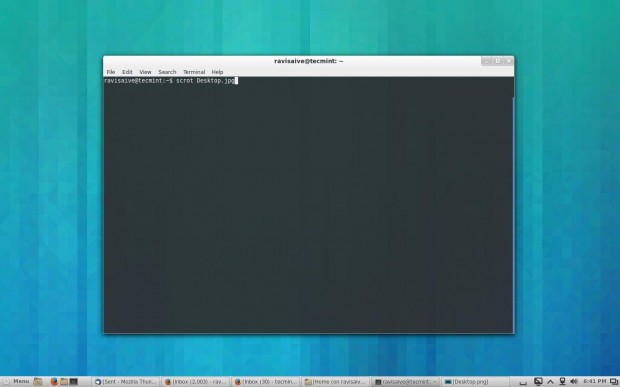
Let’s take a entire screen shot of the Desktop, using the following command in your terminal.

$ scrot /home/tecmint/Desktop.jpg

Desktop Screen Shot

Desktop Screen Shot

Take Specific Window Screen Shot

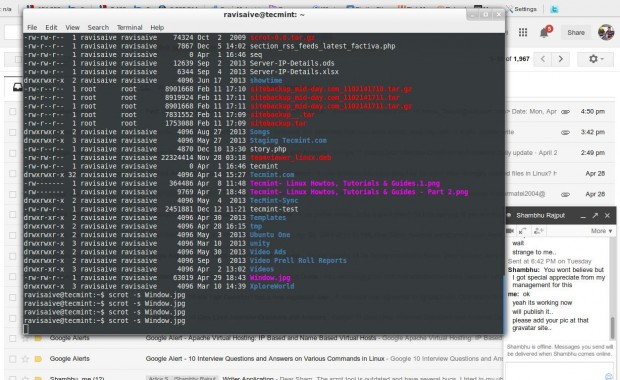
If you would like to capture a specific area on the screen, you can use the following command with ‘-s’ switch that allows you to interactively select the area with your mouse that you wish to take screen shot.

scrot -s /home/tecmint/Window.jpg

Take Selected Window Screen shot

Take Selected Window Screen shot

Adjusting the Image Quality

With the help of ‘-q‘ switch, you can specify the quality level of the image between 1 and 100. The default image level is set to 75, and the image output will be different depending upon the file format you specify.

The following command will capture an image at 90% the quality of the original high quality screen.

$ scrot -q 90 /home/tecmint/Quality.jpg

Take Quality Screen shot

Take Quality Screen shot

Take Screen Shots Automatically

Now if you would like to get automatically screen shots, than you need to create a simple shell script. Create a file ‘screen.sh‘ with ‘touch‘ command and add the following content to it.

#!/bin/sh
DISPLAY=:0 scrot 'tecmint-%Y-%m-%d-%H_%M.jpg' -q 20 && mv /home/tecmint/*.jpg /media/tecmint

Now grant ‘777‘ permission and set an Cron job.

$ chmod 777 screen.sh

Open a ‘crontab‘ file and add the following entry. You can define custom interval time.

$ crontab -e
*/1 * * * * sh /home/tecmint/screen.sh

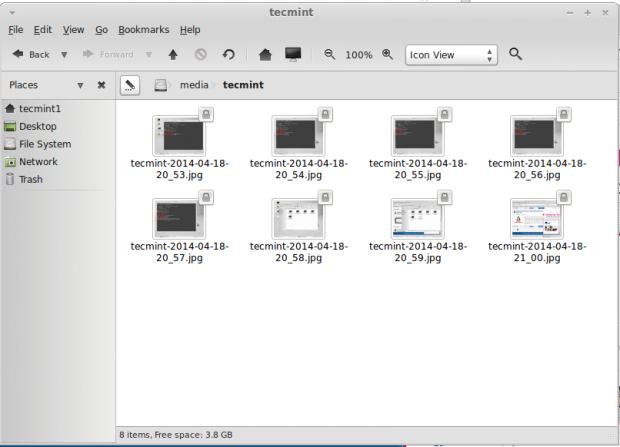
The above Cron entry will run every ‘1‘ minute and take screen shots and store them under ‘/media/tecmint‘ directory with filename as date and time. After running script for 1 minute, this is what I found in my ‘tecmint’directory.

Automatic Screen shots

Automatic Screen shots

Reference Links

http://linuxbrit.co.uk/software/

Source

FireSSH – A Web Browser SSH Client Plugin for Firefox

FireSSH is an open source cross platform browser based SSH terminal client extension for Firefox, developed by Mime Čuvalo using JavaScript for handling accessible and reliable remote SSH sessions right from the browser window and acts as a much powerful SSH client.

This small lightweight add-on enables you to easily create new accounts and make new connections to the systems. You don’t need to install third party tools like Putty or other SSH client on your machine, all you need is to have a web browser in your place to access your remote machines from the browser wherever you go or on the go.

Installation of FireSSH

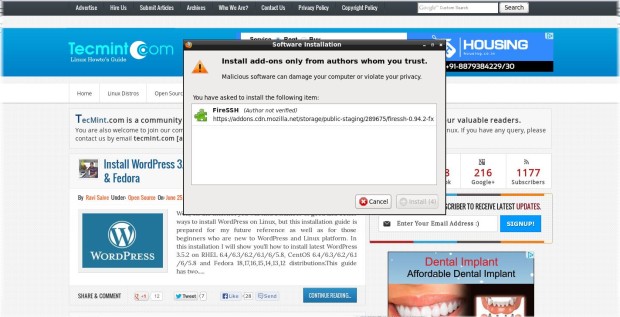
Firstly, you must have a Firefox browser installed on your system. FireSSH is not a standalone program, but created as an extension to Firefox browser. To install FireSSH, go to the following link and click on the “Install Now” button, Once it finishes installation, make sure you restarted Firefox successfully,

  1. https://addons.mozilla.org/firefox/downloads/latest/firessh

Download FireSSH Plugin

Download FireSSH Plugin

How to Start FireSSH?

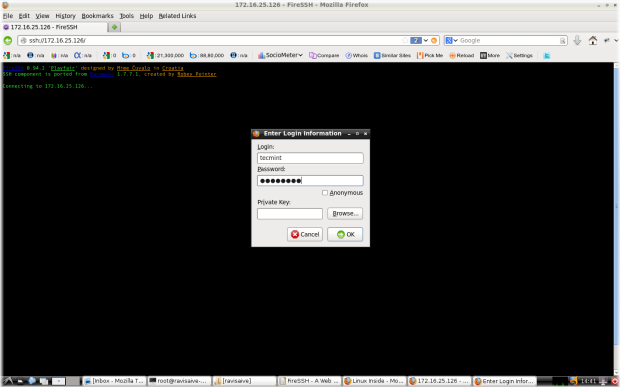
FireSSH extension uses SSH protocol to connect to remote host. For example if you would like to connect to host “172.16.25.126” using the user “tecmint” and password “xyz” you would type in the address bar similar to “ssh://172.16.25.126” and enter details as suggested.

FireSSH Remote Connection

FireSSH Remote Connection Wizard

Finally, click on “OK” button to make the connection to your server.

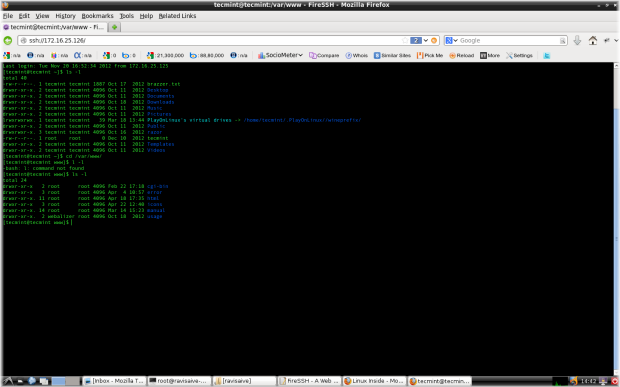
FireSSH Remote SSH Client

FireSSH Remote SSH Session

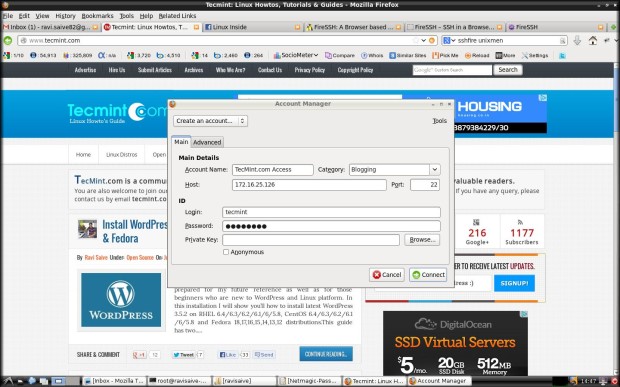
Alternatively, you can go to the “Menu” –> “Tools” –> “Web Developer” –> “FireSSH” to launch the “Account Manager“.

  1. Account Name : Enter host name of the server you want to connect to.
  2. Category : Some people deals with many servers and this helps them to organize their servers into categories. For example, I created category as “Blogging“, you can create any categories.
  3. Host : Enter the IP address of remote host.
  4. Port : By default, SSH runs on port “22“, but some users prefer different port for security reason. So, enter your port number here
  5. Login and Password : Enter your username and password.

Finally, click the “Connect” button to make the remote connection to your server. For reference follow the screen shot.

FireSSH Account Manager

FireSSH New Account Creation

Alternatively, you can also use Firefox toolbar button to add FireSSH to your toolbar. Right click on the toolbarbutton, then go to “Customize” search for FireSSH icon and drag to the toolbar section,

How to uninstall FireSSH

To uninstall, simply go to “Tools” –> “Addons” –> “FireSSH” and then click Uninstall.

Source

WP2Social Auto Publish Powered By : XYZScripts.com