Zammad is a free open source, fully featured web based ticketing system for helpdesk or customer support. It ships in with a multitude of features for handling customer communication through various channels such as social networks (Facebook and Twitter), live chat, e-mails as well as telephone. It has an API for integrating your telephone system into in and outgoing calls.
Zammad Help Desk & Ticket System
Zammad Features:
- Supports full-text search.
- Has flexible text modules.
- Immediately reports changes to objects.
- Supports auto-save.
- Supports individual escalation or setting client solution time limit.
- It is auditable and often used in banks.
- Allows for creation of individual overviews.
- Supports various security mechanisms such as device-logging and two-factor-authentication.
- Provides a customer interface, where they can track the current editing at any time.
- Supports external authentication via Twitter, Facebook, LinkedIn or Google via OAuth.
- Supports nine languages and so much more.
Zammad Requirements:
- Ruby 2.4.2
- Database: PostgresSQL (supported by default), MariaDB or MySQL
- Reverse Proxy: Nginx (supported by default) or Apache.
- Elasticsearch for excellent search performance
Zammad Installation Prerequisites:
Zammad is an open source project which can be deployed on a VPS server of your choice.
You can get a 2GB RAM VPS from
Linode for
$10, but it’s unmanaged. If you want a Managed VPS, then use our new
BlueHost Promotion Offer, you will get upto
40% OFF on hosting with one
Free Domain for Life. If you get a Managed VPS, they will probably install
Zammad for you.
In this article we will explain how to install and configure Zammad open source helpdesk/customer support ticketing system in CentOS/RHEL 7, Ubuntu 16.04 and Debian 9 server.
Step 1: Configure System Locale on System
1. Zammad uses UTF-8 locale, otherwise, packages such as PostgreSQL will not install. Check your system locale using following command on your respective Linux distribution.
# locale

LANG=en_IN
LC_CTYPE="en_IN"
LC_NUMERIC="en_IN"
LC_TIME="en_IN"
LC_COLLATE="en_IN"
LC_MONETARY="en_IN"
LC_MESSAGES="en_IN"
LC_PAPER="en_IN"
LC_NAME="en_IN"
LC_ADDRESS="en_IN"
LC_TELEPHONE="en_IN"
LC_MEASUREMENT="en_IN"
LC_IDENTIFICATION="en_IN"
LC_ALL=
If there is nothing with UTF-8 in the above output, you have to set a new locale using following command.
# localectl set-locale LANG=en_US.UTF-8
# locale status

System Locale: LANG=en_US.UTF-8
       VC Keymap: us
      X11 Layout: us
Step 2: Install Elasticsearch on System
2. Now install Elasticsearch using following commands according to your Linux distribution you are using.
Install Elasticsearch on CentOS/RHEL 7
# rpm --import https://artifacts.elastic.co/GPG-KEY-elasticsearch
# echo "[elasticsearch-5.x]
name=Elasticsearch repository for 5.x packages
baseurl=https://artifacts.elastic.co/packages/5.x/yum
gpgcheck=1
gpgkey=https://artifacts.elastic.co/GPG-KEY-elasticsearch
enabled=1
autorefresh=1
type=rpm-md" | sudo tee /etc/yum.repos.d/elasticsearch.repo

# yum -y install java elasticsearch
# /usr/share/elasticsearch/bin/elasticsearch-plugin install ingest-attachment
# systemctl daemon-reload
# systemctl enable elasticsearch
# systemctl start elasticsearch
# systemctl status elasticsearch
Install Elasticsearch on Ubuntu 16.04
# echo "deb https://artifacts.elastic.co/packages/5.x/apt stable main" | sudo tee -a /etc/apt/sources.list.d/elastic-5.x.list
# wget -qO - https://artifacts.elastic.co/GPG-KEY-elasticsearch | sudo apt-key add -
# apt-get update
# apt-get install openjdk-8-jre elasticsearch
# /usr/share/elasticsearch/bin/elasticsearch-plugin install ingest-attachment
# systemctl restart elasticsearch
# systemctl enable elasticsearch
# systemctl status elasticsearch
Install Elasticsearch on Debian 9
# apt-get install apt-transport-https sudo wget
# echo "deb http://ftp.debian.org/debian jessie-backports main" | sudo tee -a /etc/apt/sources.list.d/debian-backports.list
# echo "deb https://artifacts.elastic.co/packages/5.x/apt stable main" | sudo tee -a /etc/apt/sources.list.d/elastic-5.x.list
# wget -qO - https://artifacts.elastic.co/GPG-KEY-elasticsearch | sudo apt-key add -
# apt-get update
# apt-get install -t jessie-backports openjdk-8-jre
# apt-get install elasticsearch
# /var/lib/dpkg/info/ca-certificates-java.postinst configure
# /usr/share/elasticsearch/bin/elasticsearch-plugin install ingest-attachment
# systemctl restart elasticsearch
# systemctl enable elasticsearch
# systemctl status elasticsearch
Step 3: Install Zammad Support Ticket System
3. Once Elasticsearch has been installed, now you can add Zammad official repository to install Zammad, this will also install required packages such as Nginx HTTP server and PostgreSQL from this repository using following commands according to your distribution.
Install Zammad on CentOS/RHEL 7
# yum -y install epel-release wget
# wget -O /etc/yum.repos.d/zammad.repo https://dl.packager.io/srv/zammad/zammad/stable/installer/el/7.repo
# yum -y install zammad
Install Zammad on Ubuntu 16.04
# wget -qO- https://dl.packager.io/srv/zammad/zammad/key | sudo apt-key add -
# wget -O /etc/apt/sources.list.d/zammad.list https://dl.packager.io/srv/zammad/zammad/stable/installer/ubuntu/16.04.repo
# apt-get update
# apt-get install zammad
Install Zammad on Debian 9
# wget -qO- https://dl.packager.io/srv/zammad/zammad/key | sudo apt-key add -
# wget -O /etc/apt/sources.list.d/zammad.list https://dl.packager.io/srv/zammad/zammad/stable/installer/debian/9.repo
# apt-get update
# apt-get install zammad
4. Once Zammad has been installed, you can find all its packages under /opt/zammad (default base directory) and all the Zammad services (zammad, zammad-web, zammad-worker and zammad-websocket) are started automatically, you can view their status using following commands.
#systemctl status zammad
#systemctl status zammad-web
#systemctl status zammad-worker
#systemctl status zammad-websocket
5. You can also manage (restart, stop, start, disable, enable, etc..) any of these services like other systemd services using following commands.
--------- Zammad Server ---------
# systemctl status zammad
# systemctl stop zammad
# systemctl start zammad
# systemctl restart zammad
--------- Zammad Web Application Server ---------
# systemctl status zammad-web
# systemctl stop zammad-web
# systemctl start zammad-web
# systemctl restart zammad-web
--------- Zammad Worker Process ---------
# systemctl status zammad-worker
# systemctl stop zammad-worker
# systemctl start zammad-worker
# systemctl restart zammad-worker
--------- Zammad Websocket Server ---------
# systemctl status zammad-websocket
# systemctl stop zammad-websocket
# systemctl start zammad-websocket
# systemctl restart zammad-websocket
Step 4: Verify Nginx and PostgreSQL Services
6. The Nginx web server is started automatically, a server block for Zammad is created and auto-configured in /etc/nginx/conf.d/zammad.conf, that you confirm using following commands.
# cat /etc/nginx/conf.d/zammad.conf
# systemctl status nginx
7. The PostgreSQL database server is also auto-started and configured to work with Zammad that you can verify using following command.
# systemctl status postgresql
Step 5: Configure Nginx Server Block for Zammad
8. Now it’s time to configure nginx server block for Zammad, open the configuration file.
# vi /etc/nginx/conf.d/zammad.conf
Add your fully qualified domain name or Public IP to server name directive as shown.
server {
    listen 80;

    # replace 'localhost' with your fqdn if you want to use zammad from remote
    server_name domain.com;
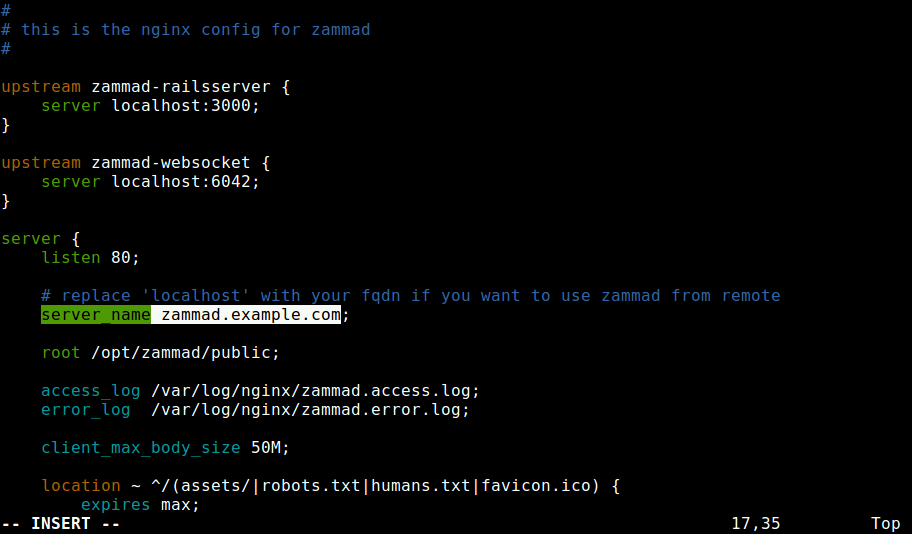
Configure Nginx for Zammad
Save the changes and exit the file. Then restart Nginx services for the recent changes to take effect.
# systemctl restart nginx
Important: On CentOS, SeLinux & Firewalld are possibly enabled. To get everything work you need to open the port 80 (HTTP) and 443 (HTTPS) to allow client requests to the Nginx web server, as follows:
# setsebool httpd_can_network_connect on -P
# firewall-cmd --zone=public --add-service=http --permanent
# firewall-cmd --zone=public --add-service=https --permanent
# firewall-cmd --reload
Step 6: Install Zammad via Web Installer
9. Once everything in place, you can access your Zammad installation from a web browser at the following URL’s.
http://example.com
OR
http://Public-IP
After the web interface loads, you will see the message Setup new system, click on it to continue.
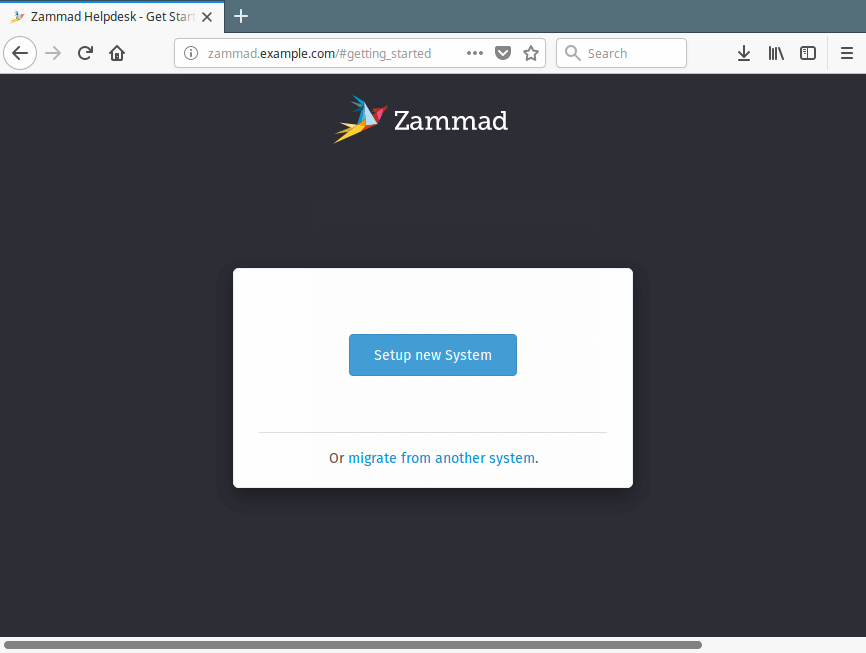
Zammad Setup Web Installer
10. Next, create the Zammad admin account, enter required details and click Create.
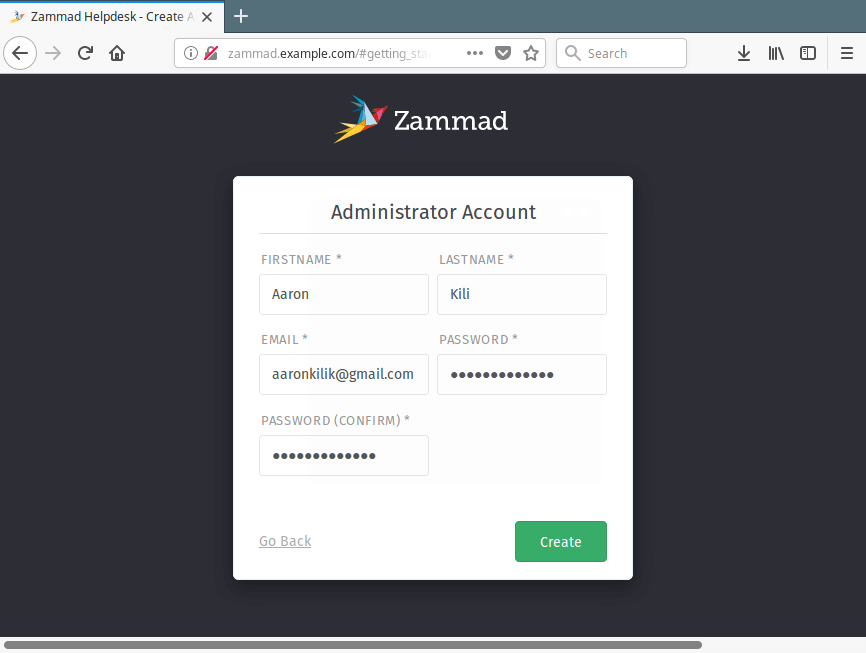
Create Zammad Admin Account
13. Then create your organization and upload logo, once you are done, click Next.
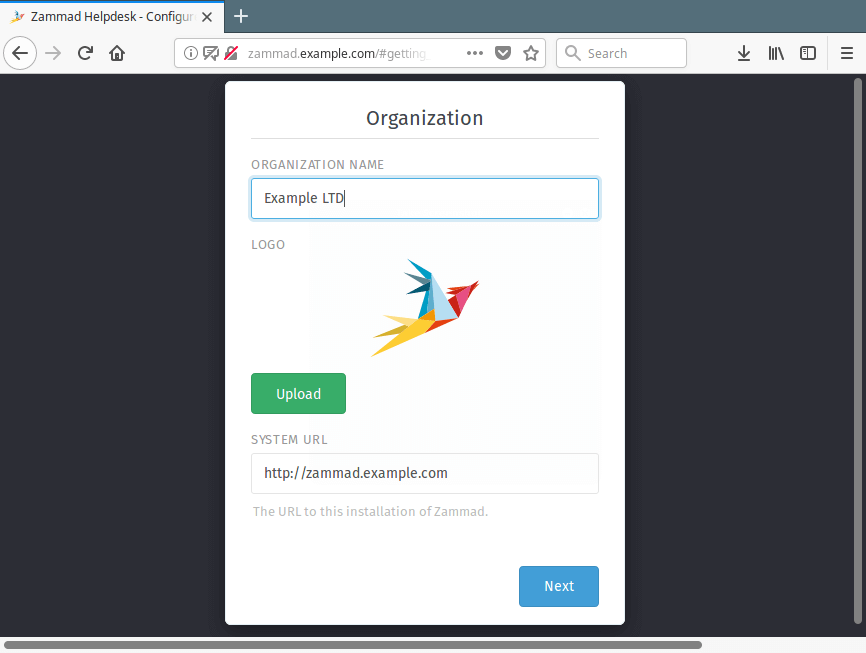
Create Organization in Zammad
11. Next, configure Zammad email service. You can either use your local server setup or setup another outgoing STMP server. Then click Continue.
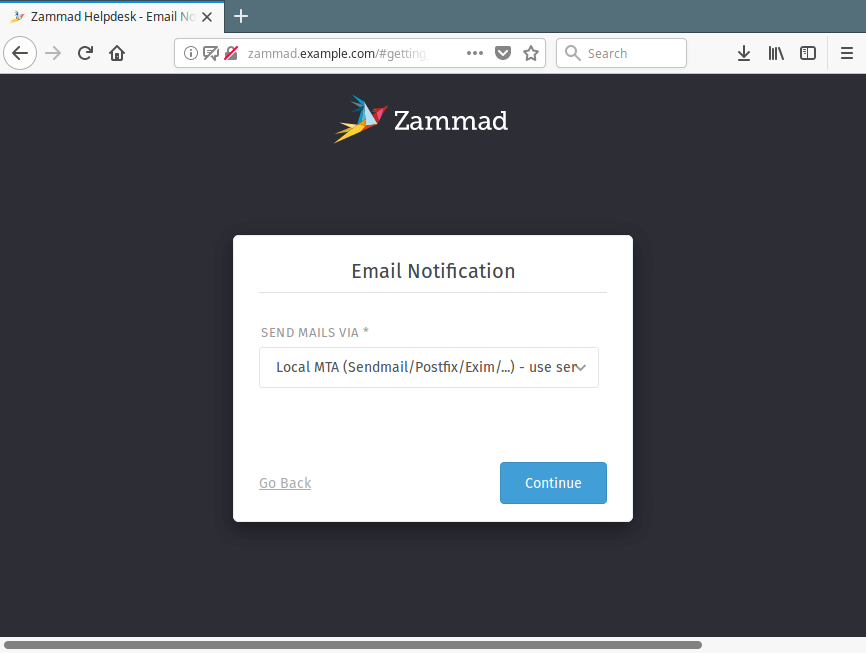
Set Zammad Email Notification
12. In the next interface, you can either configure Connect Channels or click Skip to configure it later on.
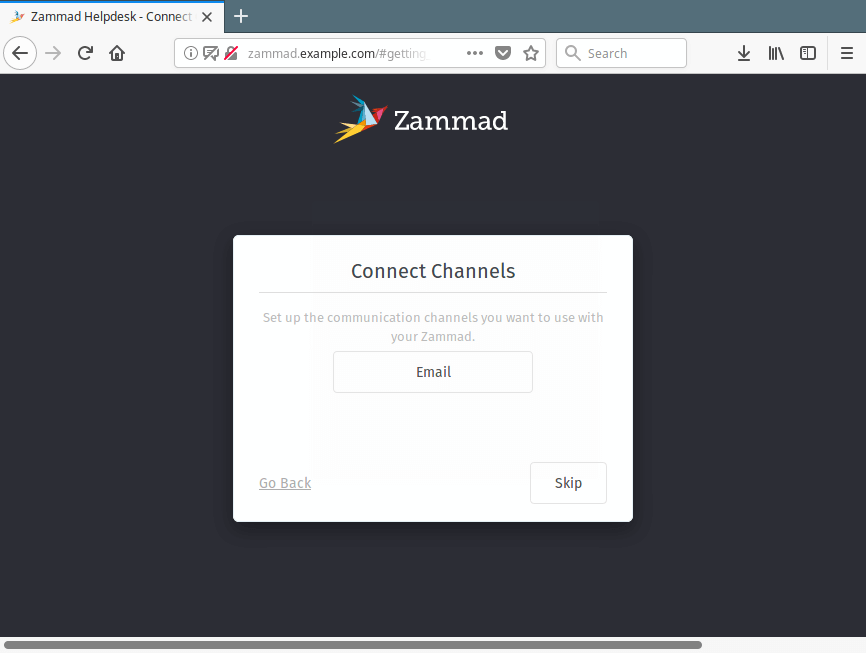
Setup Zammad Connect Channels
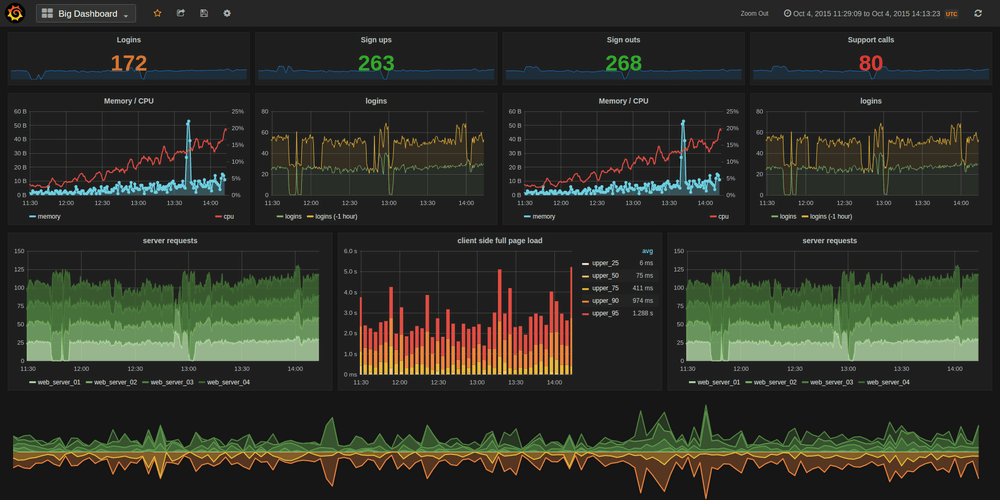
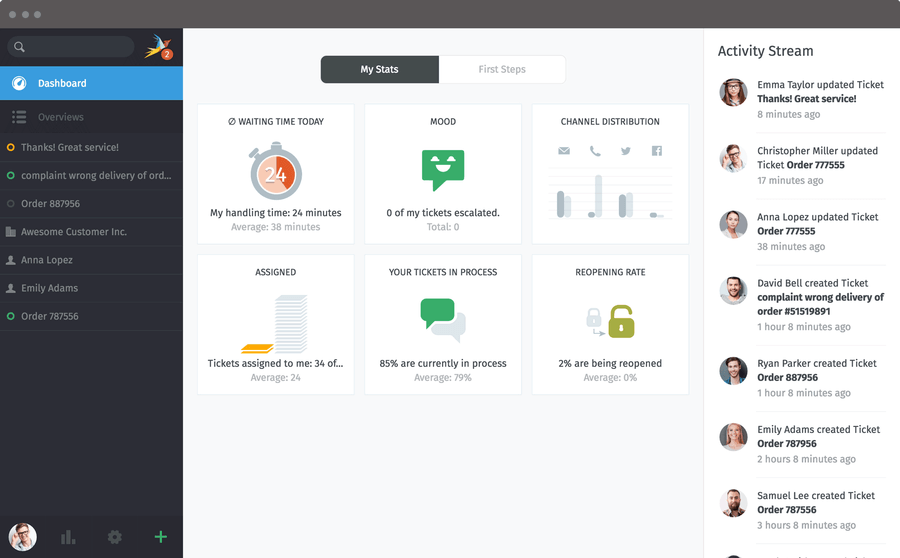
13. Once the setup is complete. You will be redirected to the Zammad helpdesk dashboard as shown in the following screenshot. From here, you can full setup you helpdesk or customer support system and manage it.
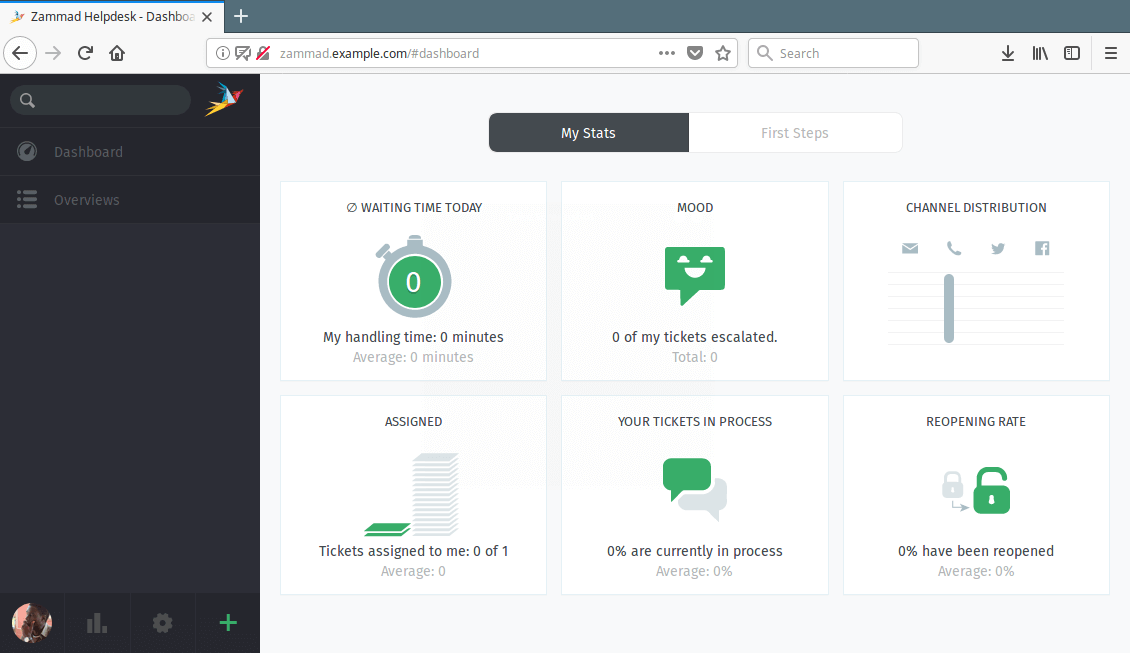
Zammad Helpdesk Dashboard
For more information, go to the Zammad Homepage: https://zammad.org/
That’s all! Zammad is a powerful web based ticketing system for helpdesk or customer support. If you encountered any issues while installing it, use the feedback form below to share you queries with us.
Source