In a previous article, we put together a list of 10 useful commands to collect system and hardware information in Linux. In this guide, we will narrow down to the CPU/processor, and show you various ways of extracting detailed information about your machine CPU.
Just to give you an overview, we will query information such as CPU architecture, vendor_id, model, model name, number of CPU cores, speed of each core and lots more.
Essentially, the /proc/cpuinfo contains this all info, every other command/utility gets its output from this file.
With that said, below are 9 commands for getting info about your Linux CPU.
1. Get CPU Info Using cat Command
You can simply view the information of your system CPU by viewing the contents of the /proc/cpuinfo file with the help of cat command as follows:
$ cat /proc/cpuinfo
processor	: 0
vendor_id	: GenuineIntel
cpu family	: 6
model		: 69
model name	: Intel(R) Core(TM) i5-4210U CPU @ 1.70GHz
stepping	: 1
microcode	: 0x1c
cpu MHz		: 1700.062
cache size	: 3072 KB
physical id	: 0
siblings	: 4
core id		: 0
cpu cores	: 2
apicid		: 0
initial apicid	: 0
fpu		: yes
fpu_exception	: yes
cpuid level	: 13
wp		: yes
flags		: fpu vme de pse tsc msr pae mce cx8 apic sep mtrr pge mca cmov pat pse36 clflush dts acpi mmx fxsr sse sse2 ss ht tm pbe syscall nx pdpe1gb rdtscp lm constant_tsc arch_perfmon pebs bts rep_good nopl xtopology nonstop_tsc aperfmperf eagerfpu pni pclmulqdq dtes64 monitor ds_cpl vmx est tm2 ssse3 sdbg fma cx16 xtpr pdcm pcid sse4_1 sse4_2 movbe popcnt tsc_deadline_timer aes xsave avx f16c rdrand lahf_lm abm epb tpr_shadow vnmi flexpriority ept vpid fsgsbase tsc_adjust bmi1 avx2 smep bmi2 erms invpcid xsaveopt dtherm ida arat pln pts
bugs		:
bogomips	: 4788.92
clflush size	: 64
cache_alignment	: 64
address sizes	: 39 bits physical, 48 bits virtual
power management:
......
To get a little specific, you can employ grep command – a CLI tool for searching plain-text data for lines matching a regular expression. This can help you only output vendor name, model name, number of processors, number of cores etc:
$ cat /proc/cpuinfo | grep 'vendor' | uniq		#view vendor name
$ cat /proc/cpuinfo | grep 'model name' | uniq		#display model name
$ cat /proc/cpuinfo | grep processor | wc -l		#count the number of processing units
$ cat /proc/cpuinfo | grep 'core id'			#show individual cores
Suggested Read: How to Use ‘cat’ and ‘tac’ Commands with Examples in Linux
2. lscpu Command – Shows CPU Architecture Info
The command lscpu prints CPU architecture information from sysfs and /proc/cpuinfo as shown below:
$ lscpu
Architecture:          x86_64
CPU op-mode(s):        32-bit, 64-bit
Byte Order:            Little Endian
CPU(s):                4
On-line CPU(s) list:   0-3
Thread(s) per core:    2
Core(s) per socket:    2
Socket(s):             1
NUMA node(s):          1
Vendor ID:             GenuineIntel
CPU family:            6
Model:                 69
Model name:            Intel(R) Core(TM) i5-4210U CPU @ 1.70GHz
Stepping:              1
CPU MHz:               1303.687
CPU max MHz:           2700.0000
CPU min MHz:           800.0000
BogoMIPS:              4788.92
Virtualization:        VT-x
L1d cache:             32K
L1i cache:             32K
L2 cache:              256K
L3 cache:              3072K
NUMA node0 CPU(s):     0-3
Flags:                 fpu vme de pse tsc msr pae mce cx8 apic sep mtrr pge mca cmov pat pse36 clflush dts acpi mmx fxsr sse sse2 ss ht tm pbe syscall nx pdpe1gb rdtscp lm constant_tsc arch_perfmon pebs bts rep_good nopl xtopology nonstop_tsc aperfmperf eagerfpu pni pclmulqdq dtes64 monitor ds_cpl vmx est tm2 ssse3 sdbg fma cx16 xtpr pdcm pcid sse4_1 sse4_2 movbe popcnt tsc_deadline_timer aes xsave avx f16c rdrand lahf_lm abm epb tpr_shadow vnmi flexpriority ept vpid fsgsbase tsc_adjust bmi1 avx2 smep bmi2 erms invpcid xsaveopt dtherm ida arat pln pts
3. cpuid Command – Shows x86 CPU
The command cpuid dumps complete information about the CPU(s) collected from the CPUID instruction, and also discover the exact model of x86 CPU(s) from that information.
Make sure to install it before running it.
$ sudo apt install cpuid        #Debian/Ubuntu systems
$ sudo yum install cpuid	#RHEL/CentOS systems
$ sudo dnf install cpuid	#Fedora 22+
Once installed, run cpuid to collect information concerning the x86 CPU.
$ cpuid
CPU 0:
   vendor_id = "GenuineIntel"
   version information (1/eax):
      processor type  = primary processor (0)
      family          = Intel Pentium Pro/II/III/Celeron/Core/Core 2/Atom, AMD Athlon/Duron, Cyrix M2, VIA C3 (6)
      model           = 0x5 (5)
      stepping id     = 0x1 (1)
      extended family = 0x0 (0)
      extended model  = 0x4 (4)
      (simple synth)  = Intel Mobile Core i3-4000Y / Mobile Core i5-4000Y / Mobile Core i7-4000Y / Mobile Pentium 3500U/3600U/3500Y / Mobile Celeron 2900U (Mobile U/Y) (Haswell), 22nm
   miscellaneous (1/ebx):
      process local APIC physical ID = 0x0 (0)
      cpu count                      = 0x10 (16)
      CLFLUSH line size              = 0x8 (8)
      brand index                    = 0x0 (0)
   brand id = 0x00 (0): unknown
   feature information (1/edx):
      x87 FPU on chip                        = true
      virtual-8086 mode enhancement          = true
      debugging extensions                   = true
      page size extensions                   = true
      time stamp counter                     = true
      RDMSR and WRMSR support                = true
      physical address extensions            = true
....
4. dmidecode Command – Shows Linux Hardware Info
dmidecode is a tool for retrieving hardware information of any Linux system. It dumps a computer’s DMI (a.k.a SMBIOS) table contents in a human-readable format for easy retrieval. The SMBIOS specification defines various DMI types, for CPU, use “processor” as follows:
$ sudo dmidecode --type processor
# dmidecode 3.0
Getting SMBIOS data from sysfs.
SMBIOS 2.7 present.

Handle 0x0004, DMI type 4, 42 bytes
Processor Information
	Socket Designation: U3E1
	Type: Central Processor
	Family: Core i5
	Manufacturer: Intel(R) Corporation
	ID: 51 06 04 00 FF FB EB BF
	Signature: Type 0, Family 6, Model 69, Stepping 1
	Flags:
		FPU (Floating-point unit on-chip)
		VME (Virtual mode extension)
		DE (Debugging extension)
		PSE (Page size extension)
		TSC (Time stamp counter)
		MSR (Model specific registers)
		PAE (Physical address extension)
		MCE (Machine check exception)
		CX8 (CMPXCHG8 instruction supported)
		APIC (On-chip APIC hardware supported)
		SEP (Fast system call)
		MTRR (Memory type range registers)
		PGE (Page global enable)
		MCA (Machine check architecture)
.....
5. Inxi Tool – Shows Linux System Information
Inxi is a powerful command line system information script intended for both console and IRC (Internet Relay Chat). You can use it to instantly retrieve hardware information.
You can install like so:
$ sudo apt install inxi 	#Debian/Ubuntu systems
$ sudo yum install inxi		#RHEL/CentOS systems
$ sudo dnf install inxi		#Fedora 22+
To display complete CPU information, including per CPU clock-speed and CPU max speed (if available), use the -C flag as follows:
$ inxi -C
CPU:       Dual core Intel Core i5-4210U (-HT-MCP-) cache: 3072 KB
           clock speeds: max: 2700 MHz 1: 1958 MHz 2: 1993 MHz 3: 1775 MHz 4: 1714 MHz
6. lshw Tool – List Hardware Configuration
lshw is a minimal tool for gathering in-depth information on the hardware configuration of a computer. You can use the -C option to select the hardware class, CPU in this case:
$ sudo lshw -C CPU
*-cpu
       description: CPU
       product: Intel(R) Core(TM) i5-4210U CPU @ 1.70GHz
       vendor: Intel Corp.
       physical id: 4
       bus info: cpu@0
       version: Intel(R) Core(TM) i5-4210U CPU @ 1.70GHz
       serial: To Be Filled By O.E.M.
       slot: U3E1
       size: 2626MHz
       capacity: 2700MHz
       width: 64 bits
       clock: 100MHz
       capabilities: x86-64 fpu fpu_exception wp vme de pse tsc msr pae mce cx8 apic sep mtrr pge mca cmov pat pse36 clflush dts acpi mmx fxsr sse sse2 ss ht tm pbe syscall nx pdpe1gb rdtscp constant_tsc arch_perfmon pebs bts rep_good nopl xtopology nonstop_tsc aperfmperf eagerfpu pni pclmulqdq dtes64 monitor ds_cpl vmx est tm2 ssse3 sdbg fma cx16 xtpr pdcm pcid sse4_1 sse4_2 movbe popcnt tsc_deadline_timer aes xsave avx f16c rdrand lahf_lm abm epb tpr_shadow vnmi flexpriority ept vpid fsgsbase tsc_adjust bmi1 avx2 smep bmi2 erms invpcid xsaveopt dtherm ida arat pln pts cpufreq
       configuration: cores=2 enabledcores=2 threads=4
7. hardinfo – Shows Hardware Info in GTK+ Window
hardinfo displays hardware information in a GTK+ window, you can install it as follows:
$ sudo apt install hardinfo 	#Debian/Ubuntu systems
$ sudo yum install hardinfo	#RHEL/CentOS systems
$ sudo dnf install hardinfo	#Fedora 22+
Once you have it installed, type:
$ hardinfo
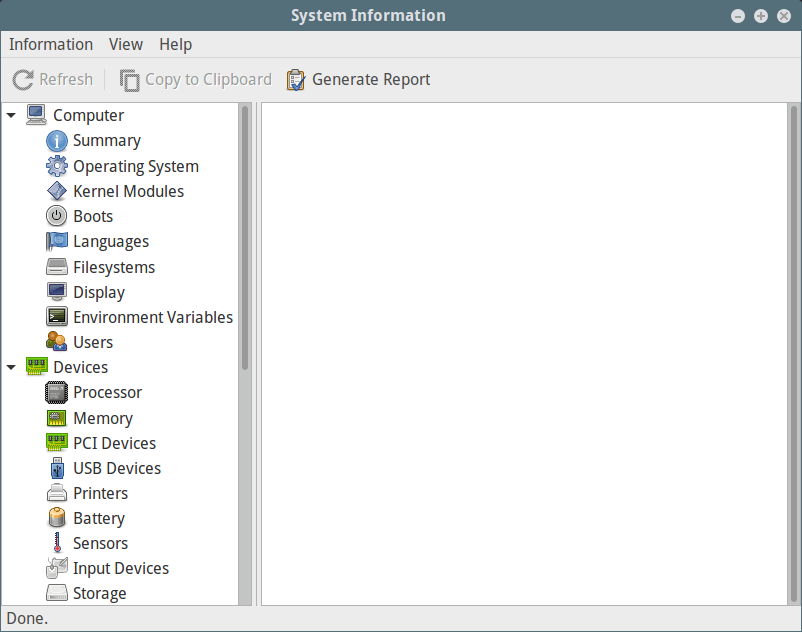
Linux System Information
It also enables you to generate a system hardware info report by clicking on the “Generate Report” button. From the interface below, click on “Generate” to proceed. Note that you can choose the hardware info category to be generated.
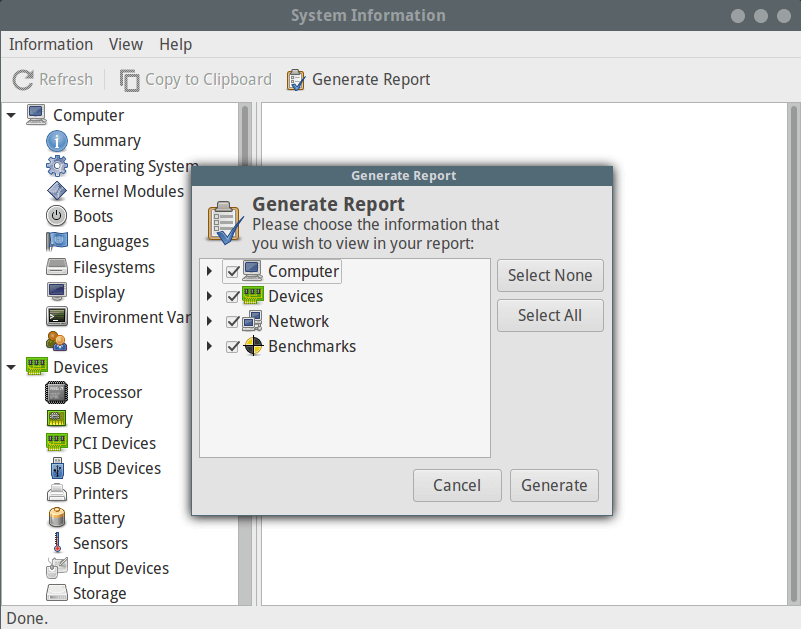
Generate System Information Report
Once you have generated the report in html format, you can view it from a web browser as shown below.
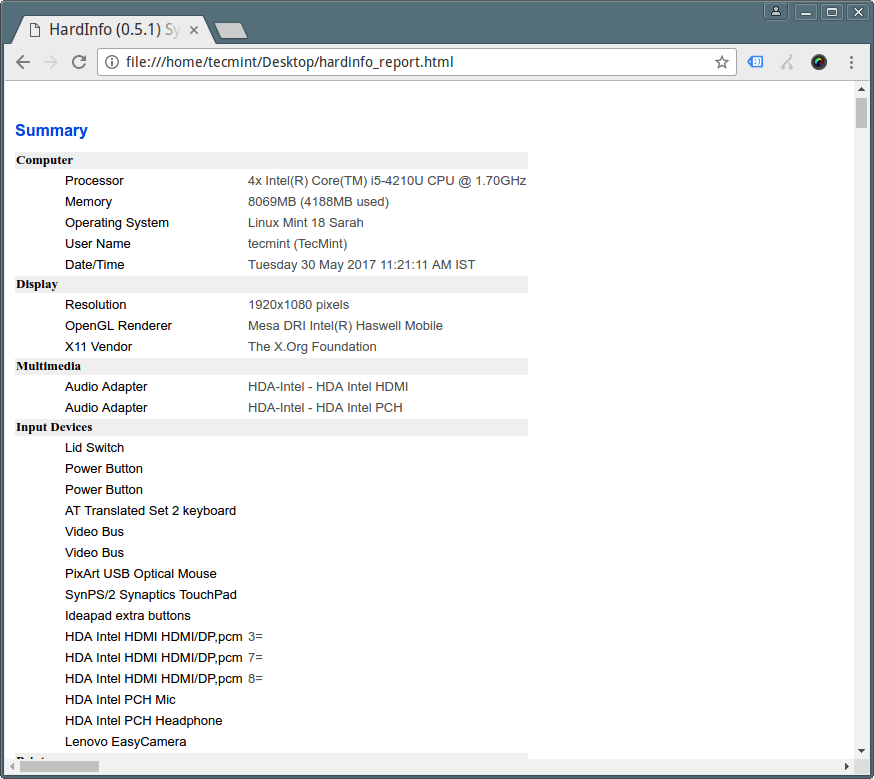
Linux System Detailed Information
8. hwinfo – Shows Present Hardware Info
hwinfo is used to extract info about hardware present in a Linux system. To display info about your CPU, use the --cpu
$ hwinfo --cpu
01: None 00.0: 10103 CPU
  [Created at cpu.460]
  Unique ID: rdCR.j8NaKXDZtZ6
  Hardware Class: cpu
  Arch: X86-64
  Vendor: "GenuineIntel"
  Model: 6.69.1 "Intel(R) Core(TM) i5-4210U CPU @ 1.70GHz"
  Features: fpu,vme,de,pse,tsc,msr,pae,mce,cx8,apic,sep,mtrr,pge,mca,cmov,pat,pse36,clflush,dts,acpi,mmx,fxsr,sse,sse2,ss,ht,tm,pbe,syscall,nx,pdpe1gb,rdtscp,lm,constant_tsc,arch_perfmon,pebs,bts,rep_good,nopl,xtopology,nonstop_tsc,aperfmperf,eagerfpu,pni,pclmulqdq,dtes64,monitor,ds_cpl,vmx,est,tm2,ssse3,sdbg,fma,cx16,xtpr,pdcm,pcid,sse4_1,sse4_2,movbe,popcnt,tsc_deadline_timer,aes,xsave,avx,f16c,rdrand,lahf_lm,abm,epb,tpr_shadow,vnmi,flexpriority,ept,vpid,fsgsbase,tsc_adjust,bmi1,avx2,smep,bmi2,erms,invpcid,xsaveopt,dtherm,ida,arat,pln,pts
  Clock: 2080 MHz
  BogoMips: 4788.92
  Cache: 3072 kb
  Units/Processor: 16
  Config Status: cfg=new, avail=yes, need=no, active=unknown
....
9. nproc – Print Number of Processing Units
nproc command is used to show the number of processing unit present on your computer:
$ nproc
For additional usage info and options, read through the man pages of these commands like this:
$ man commandname
Also check out:
That’s it for now! You can share with us additional ways of extracting CPU information in Linux via the feedback form below.