If you are a person who is, or has been in the past, in charge of inspecting and analyzing system logs in Linux, you know what a nightmare that task can become if multiple services are being monitored simultaneously.
In days past, that task had to be done mostly manually, with each log type being handled separately. Fortunately, the combination of Elasticsearch, Logstash, and Kibana on the server side, along with Filebeat on the client side, makes that once difficult task look like a walk in the park today.
The first three components form what is called an ELK stack, whose main purpose is to collect logs from multiple servers at the same time (also known as centralized logging).
Suggested Read: 4 Good Open Source Log Monitoring and Management Tools for Linux
A built-in java-based web interface allows you to inspect logs quickly at a glance for easier comparison and troubleshooting. These client logs are sent to a central server by Filebeat, which can be described as a log shipping agent.
Let’s see how all of these pieces fit together. Our test environment will consist of the following machines:
Central Server: CentOS 7 (IP address: 192.168.0.29). 2 GB of RAM.
Client #1: CentOS 7 (IP address: 192.168.0.100). 1 GB of RAM.
Client #2: Debian 8 (IP address: 192.168.0.101). 1 GB of RAM.
Please note that the RAM values provided here are not strict prerequisites, but recommended values for successful implementation of the ELK stack on the central server. Less RAM on clients will not make much difference, if any, at all.
Installing ELK Stack on the Server
Let’s begin by installing the ELK stack on the server, along with a brief explanation on what each component does:
- Elasticsearch stores the logs that are sent by the clients.
- Logstash processes those logs.
- Kibana provides the web interface that will help us to inspect and analyze the logs.
Install the following packages on the central server. First off, we will install Java JDK version 8 (update 102, the latest one at the time of this writing), which is a dependency of the ELK components.
You may want to check first in the Java downloads page here to see if there is a newer update available.
# yum update
# cd /opt
# wget --no-cookies --no-check-certificate --header "Cookie: gpw_e24=http%3A%2F%2Fwww.oracle.com%2F; oraclelicense=accept-securebackup-cookie" "http://download.oracle.com/otn-pub/java/jdk/8u102-b14/jre-8u102-linux-x64.rpm"
# rpm -Uvh jre-8u102-linux-x64.rpm
Time to check whether the installation completed successfully:
# java -version
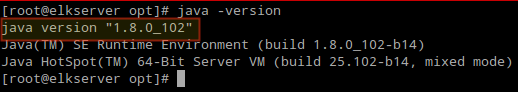
Check Java Version from Commandline
To install the latest versions of Elasticsearch, Logstash, and Kibana, we will have to create repositories for yummanually as follows:
Enable Elasticsearch Repository
1. Import the Elasticsearch public GPG key to the rpm package manager:
# rpm --import http://packages.elastic.co/GPG-KEY-elasticsearch
2. Insert the following lines to the repository configuration file elasticsearch.repo:
/etc/yum.repos.d/elasticsearch.repo
[elasticsearch]
name=Elasticsearch repository
baseurl=http://packages.elastic.co/elasticsearch/2.x/centos
gpgcheck=1
gpgkey=http://packages.elastic.co/GPG-KEY-elasticsearch
enabled=1
3. Install the Elasticsearch package.
# yum install elasticsearch
When the installation is complete, you will be prompted to start and enable elasticsearch:
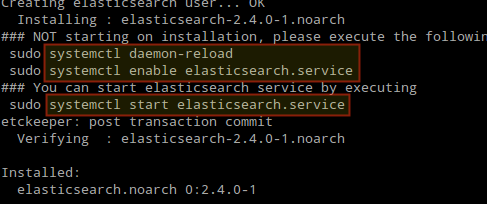
Install Elasticsearch in Linux
4. Start and enable the service.
# systemctl daemon-reload
# systemctl enable elasticsearch
# systemctl start elasticsearch
5. Allow traffic through TCP port 9200 in your firewall:
# firewall-cmd --add-port=9200/tcp
# firewall-cmd --add-port=9200/tcp --permanent
6. Check if Elasticsearch responds to simple requests over HTTP:
# curl -X GET http://localhost:9200
The output of the above command should be similar to:
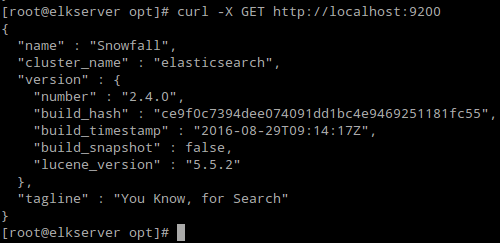
Verify Elasticsearch Installation
Make sure you complete the above steps and then proceed with Logstash. Since both Logstash and Kibanashare the Elasticsearch GPG key, there is no need to re-import it before installing the packages.
Suggested Read: Manage System Logs (Configure, Rotate and Import Into Database) in CentOS 7
Enable Logstash Repository
7. Insert the following lines to the repository configuration file logstash.repo:
/etc/yum.repos.d/logstash.repo
[logstash]
name=Logstash
baseurl=http://packages.elasticsearch.org/logstash/2.2/centos
gpgcheck=1
gpgkey=http://packages.elasticsearch.org/GPG-KEY-elasticsearch
enabled=1
8. Install the Logstash package:
# yum install logstash
9. Add a SSL certificate based on the IP address of the ELK server at the the following line below the [ v3_ca ] section in /etc/pki/tls/openssl.cnf:
[ v3_ca ]
subjectAltName = IP: 192.168.0.29
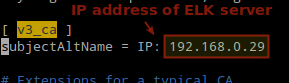
Add Elasticsearch Server IP Address
10. Generate a self-signed certificate valid for 365 days:
# cd /etc/pki/tls
# openssl req -config /etc/pki/tls/openssl.cnf -x509 -days 3650 -batch -nodes -newkey rsa:2048 -keyout private/logstash-forwarder.key -out certs/logstash-forwarder.crt
11. Configure Logstash input, output, and filter files:
Input: Create /etc/logstash/conf.d/input.conf and insert the following lines into it. This is necessary for Logstash to “learn” how to process beats coming from clients. Make sure the path to the certificate and key match the right paths as outlined in the previous step:
/etc/logstash/conf.d/input.conf
input {
  beats {
	port => 5044
	ssl => true
	ssl_certificate => "/etc/pki/tls/certs/logstash-forwarder.crt"
	ssl_key => "/etc/pki/tls/private/logstash-forwarder.key"
  }
}
Output (/etc/logstash/conf.d/output.conf) file:
/etc/logstash/conf.d/output.conf
output {
  elasticsearch {
	hosts => ["localhost:9200"]
	sniffing => true
	manage_template => false
	index => "%{[@metadata][beat]}-%{+YYYY.MM.dd}"
	document_type => "%{[@metadata][type]}"
  }
}
Filter (/etc/logstash/conf.d/filter.conf) file. We will log syslog messages for simplicity:
/etc/logstash/conf.d/filter.conf
filter {
if [type] == "syslog" {
	grok {
  	match => { "message" => "%{SYSLOGLINE}" }
	}

	date {
match => [ "timestamp", "MMM  d HH:mm:ss", "MMM dd HH:mm:ss" ]
}
  }
}
12. Verify the Logstash configuration files.
# service logstash configtest
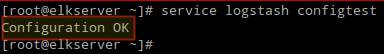
Verify Logstash Configuration
13. Start and enable logstash:
# systemctl daemon-reload
# systemctl start logstash
# systemctl enable logstash
14. Configure the firewall to allow Logstash to get the logs from the clients (TCP port 5044):
# firewall-cmd --add-port=5044/tcp
# firewall-cmd --add-port=5044/tcp --permanent
Enable Kibana Repository
14. Insert the following lines to the repository configuration file kibana.repo:
/etc/yum.repos.d/kibana.repo
[kibana]
name=Kibana repository
baseurl=http://packages.elastic.co/kibana/4.4/centos
gpgcheck=1
gpgkey=http://packages.elastic.co/GPG-KEY-elasticsearch
enabled=1
15. Install the Kibana package:
# yum install kibana
16. Start and enable Kibana.
# systemctl daemon-reload
# systemctl start kibana
# systemctl enable kibana
17. Make sure you can access access Kibana’s web interface from another computer (allow traffic on TCP port 5601):
# firewall-cmd --add-port=5601/tcp
# firewall-cmd --add-port=5601/tcp --permanent
18. Launch Kibana (http://192.168.0.29:5601) to verify that you can access the web interface:
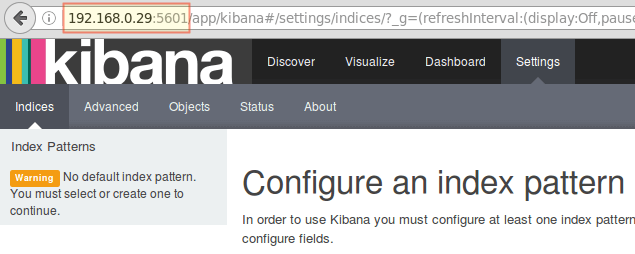
Access Kibana Web Interface
We will return here after we have installed and configured Filebeat on the clients.
Suggested Read: Monitor Server Logs in Real-Time with “Log.io” Tool in Linux
Install Filebeat on the Client Servers
We will show you how to do this for Client #1 (repeat for Client #2 afterwards, changing paths if applicable to your distribution).
1. Copy the SSL certificate from the server to the clients:
# scp /etc/pki/tls/certs/logstash-forwarder.crt root@192.168.0.100:/etc/pki/tls/certs/
2. Import the Elasticsearch public GPG key to the rpm package manager:
# rpm --import http://packages.elastic.co/GPG-KEY-elasticsearch
3. Create a repository for Filebeat (/etc/yum.repos.d/filebeat.repo) in CentOS based distributions:
/etc/yum.repos.d/filebeat.repo
[filebeat]
name=Filebeat for ELK clients
baseurl=https://packages.elastic.co/beats/yum/el/$basearch
enabled=1
gpgkey=https://packages.elastic.co/GPG-KEY-elasticsearch
gpgcheck=1
4. Configure the source to install Filebeat on Debian and its derivatives:
# aptitude install apt-transport-https
# echo "deb https://packages.elastic.co/beats/apt stable main" > /etc/apt/sources.list.d/filebeat.list
# aptitude update
5. Install the Filebeat package:
# yum install filebeat        [On CentOS and based Distros]
# aptitude install filebeat   [On Debian and its derivatives]
6. Start and enable Filebeat:
# systemctl start filebeat
# systemctl enable filebeat
Configure Filebeat
A word of caution here. Filebeat configuration is stored in a YAML file, which requires strict indentation. Be careful with this as you edit /etc/filebeat/filebeat.yml as follows:
- Under paths, indicate which log files should be “shipped” to the ELK server.
- Under prospectors:
input_type: log
document_type: syslog
- Under output:
- Uncomment the line that begins with logstash.
- Indicate the IP address of your ELK server and port where Logstash is listening in hosts.
- Make sure the path to the certificate points to the actual file you created in Step I (Logstash section) above.
The above steps are illustrated in the following image:
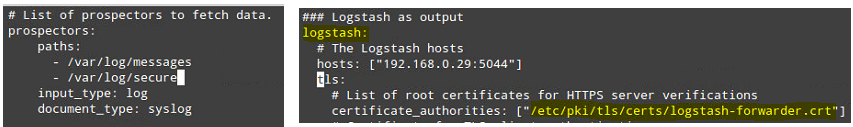
Configure Filebeat in Client Servers
Save changes, and then restart Filebeat on the clients:
# systemctl restart filebeat
Once we have completed the above steps on the clients, feel free to proceed.
Testing Filebeat
In order to verify that the logs from the clients can be sent and received successfully, run the following command on the ELK server:
# curl -XGET 'http://localhost:9200/filebeat-*/_search?pretty'
The output should be similar to (notice how messages from /var/log/messages and /var/log/secure are being received from client1 and client2):
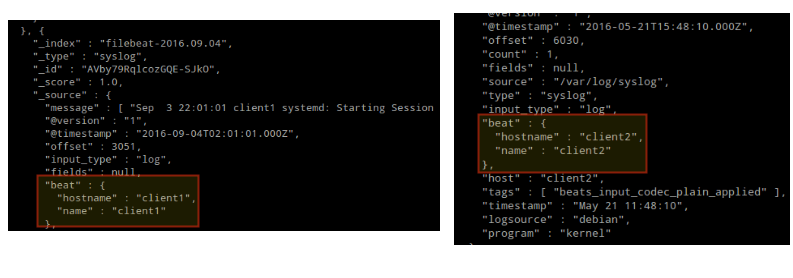
Testing Filebeat
Otherwise, check the Filebeat configuration file for errors.
# journalctl -xe
after attempting to restart Filebeat will point you to the offending line(s).
Testing Kibana
After we have verified that logs are being shipped by the clients and received successfully on the server. The first thing that we will have to do in Kibana is configuring an index pattern and set it as default.
You can describe an index as a full database in a relational database context. We will go with filebeat-* (or you can use a more precise search criteria as explained in the official documentation).
Enter filebeat-* in the Index name or pattern field and then click Create:
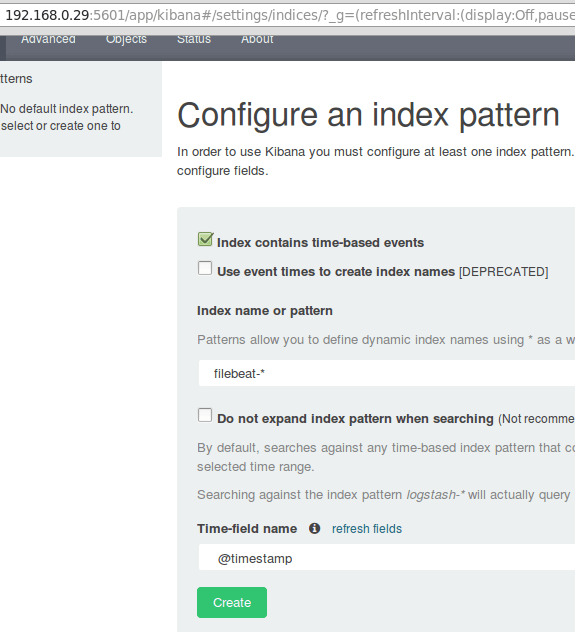
Testing Kibana
Please note that you will be allowed to enter a more fine-grained search criteria later. Next, click the star inside the green rectangle to configure it as the default index pattern:

Configure Default Kibana Index Pattern
Finally, in the Discover menu you will find several fields to add to the log visualization report. Just hover over them and click Add:
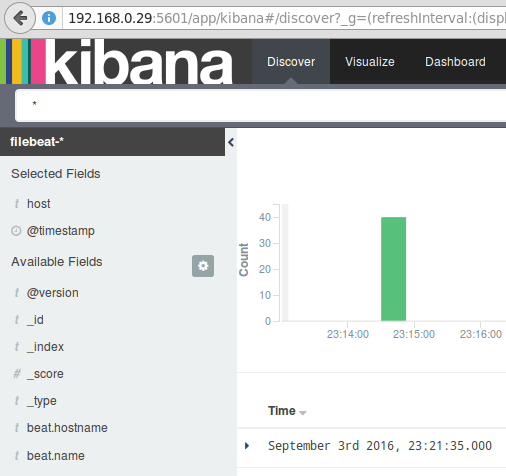
Add Log Visualization Report
The results will be shown in the central area of the screen as shown above. Feel free to play around (add and remove fields from the log report) to become familiar with Kibana.
By default, Kibana will display the records that were processed during the last 15 minutes (see upper right corner) but you can change that behavior by selecting another time frame:
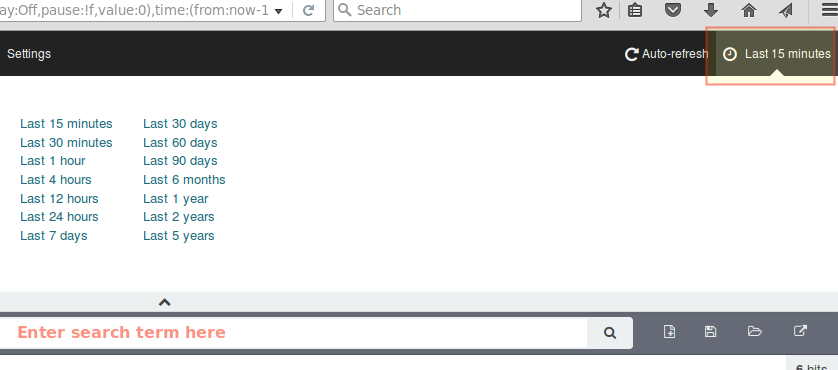
Kibana Log Reports
Summary
In this article we have explained how to set up an ELK stack to collect the system logs sent by two clients, a CentOS 7 and a Debian 8 machines.
Now you can refer to the official Elasticsearch documentation and find more details on how to use this setup to inspect and analyze your logs more efficiently.
If you have any questions, don’t hesitate to ask. We look forward to hearing from you.
Source