BCC (BPF Compiler Collection) is a powerful set of appropriate tools and example files for creating resourceful kernel tracing and manipulation programs. It utilizes extended BPF (Berkeley Packet Filters), initially known as eBPF which was one of the new features in Linux 3.15.
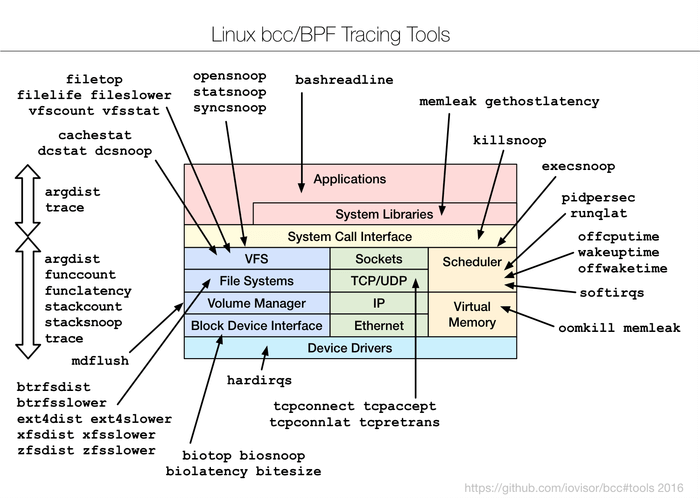
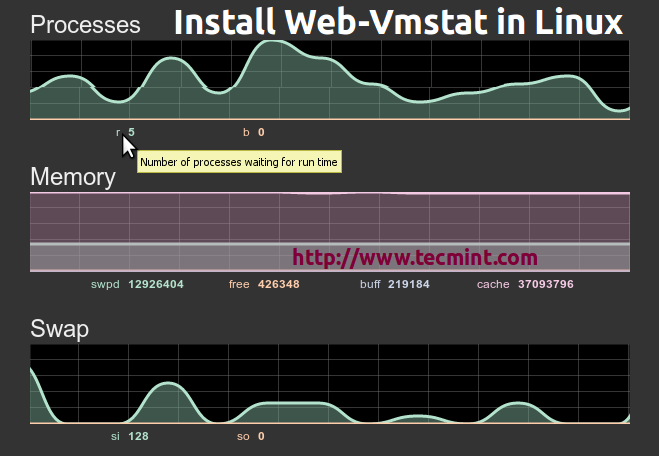
BCC/BPF – Dynamic Tracing Tools for Linux Performance Monitoring
Practically, most of the components used by BCC require Linux 4.1 or above, and its noteworthy features include:
- Requires no 3rd party kernel module, since all the tools work based on BPF which is built into the kernel and BCC uses features added in Linux 4.x series.
- Enables observation of software execution.
- Comprises of several performance analysis tools with example files and man pages.
Suggested Read: 20 Command Line Tools to Monitor Linux Performance
Best suited for advanced Linux users, BCC makes it easy to write BPF programs using kernel instrumentation in C, and front-ends in Python and lua. Additionally, it supports multiple tasks such as performance analysis, monitoring, network traffic control plus lots more.
How To Install BCC in Linux Systems
Remember that BCC uses features added in Linux kernel version 4.1 or above, and as a requirement, the kernel should have been compiled with the flags set below:
CONFIG_BPF=y
CONFIG_BPF_SYSCALL=y
# [optional, for tc filters]
CONFIG_NET_CLS_BPF=m
# [optional, for tc actions]
CONFIG_NET_ACT_BPF=m
CONFIG_BPF_JIT=y
CONFIG_HAVE_BPF_JIT=y
# [optional, for kprobes]
CONFIG_BPF_EVENTS=y
To check your kernel flags, view the file /proc/config.gz or run the commands as in the examples below:
tecmint@TecMint ~ $ grep CONFIG_BPF= /boot/config-`uname -r`
CONFIG_BPF=y
tecmint@TecMint ~ $ grep CONFIG_BPF_SYSCALL= /boot/config-`uname -r`
CONFIG_BPF_SYSCALL=y
tecmint@TecMint ~ $ grep CONFIG_NET_CLS_BPF= /boot/config-`uname -r`
CONFIG_NET_CLS_BPF=m
tecmint@TecMint ~ $ grep CONFIG_NET_ACT_BPF= /boot/config-`uname -r`
CONFIG_NET_ACT_BPF=m
tecmint@TecMint ~ $ grep CONFIG_BPF_JIT= /boot/config-`uname -r`
CONFIG_BPF_JIT=y
tecmint@TecMint ~ $ grep CONFIG_HAVE_BPF_JIT= /boot/config-`uname -r`
CONFIG_HAVE_BPF_JIT=y
tecmint@TecMint ~ $ grep CONFIG_BPF_EVENTS= /boot/config-`uname -r`
CONFIG_BPF_EVENTS=y
After verifying kernel flags, it’s time to install BCC tools in Linux systems.
On Ubuntu 16.04
Only the nightly packages are created for Ubuntu 16.04, but the installation instructions are very straightforward. No need of kernel upgrade or compile it from source.
$ echo "deb [trusted=yes] https://repo.iovisor.org/apt/xenial xenial-nightly main" | sudo tee /etc/apt/sources.list.d/iovisor.list
$ sudo apt-get update
$ sudo apt-get install bcc-tools
On Ubuntu 14.04
Begin by installing a 4.3+ Linux kernel, from http://kernel.ubuntu.com/~kernel-ppa/mainline.
As an example, write a small shell script “bcc-install.sh” with the content below.
Note: update PREFIX value to the latest date, and also browse the files in the PREFIX url provided to get the actual REL value, substitute them in the shell script.
#!/bin/bash
VER=4.5.1-040501
PREFIX=http://kernel.ubuntu.com/~kernel-ppa/mainline/v4.5.1-wily/
REL=201604121331
wget ${PREFIX}/linux-headers-${VER}-generic_${VER}.${REL}_amd64.deb
wget ${PREFIX}/linux-headers-${VER}_${VER}.${REL}_all.deb
wget ${PREFIX}/linux-image-${VER}-generic_${VER}.${REL}_amd64.deb
sudo dpkg -i linux-*${VER}.${REL}*.deb
Save the file and exit. Make it executable, then run it as shown:
$ chmod +x bcc-install.sh
$ sh bcc-install.sh
Afterwards, reboot your system.
$ reboot
Next, run the commands below to install signed BCC packages:
$ sudo apt-key adv --keyserver keyserver.ubuntu.com --recv-keys D4284CDD
$ echo "deb https://repo.iovisor.org/apt trusty main" | sudo tee /etc/apt/sources.list.d/iovisor.list
$ sudo apt-get update
$ sudo apt-get install binutils bcc bcc-tools libbcc-examples python-bcc
On Fedora 24-23
Install a 4.2+ kernel from http://alt.fedoraproject.org/pub/alt/rawhide-kernel-nodebug, if your system has a version lower than what is required. Below is an example of how to do that:
$ sudo dnf config-manager --add-repo=http://alt.fedoraproject.org/pub/alt/rawhide-kernel-nodebug/fedora-rawhide-kernel-nodebug.repo
$ sudo dnf update
$ reboot
After that, add the BBC tools repository, update your system and install the tools by executing the next series of commands:
$ echo -e '[iovisor]\nbaseurl=https://repo.iovisor.org/yum/nightly/f23/$basearch\nenabled=1\ngpgcheck=0' | sudo tee /etc/yum.repos.d/iovisor.repo
$ sudo dnf update
$ sudo dnf install bcc-tools
On Arch Linux – AUR
You should start by upgrading your kernel to at least version 4.3.1-1, subsequently install the packages below using any Arch package managers such as pacaur, yaourt, cower, etc.
bcc bcc-tools python-bcc python2-bcc
How To Use BCC Tools in Linux Systems
All the BCC tools are installed under /usr/share/bcc/tools directory. However, you can alternatively run them from the BCC Github repository under /tools where they end with a .py extension.
$ ls /usr/share/bcc/tools

argdist       capable     filetop         offwaketime  stackcount  vfscount
bashreadline  cpudist     funccount       old          stacksnoop  vfsstat
biolatency    dcsnoop     funclatency     oomkill      statsnoop   wakeuptime
biosnoop      dcstat      gethostlatency  opensnoop    syncsnoop   xfsdist
biotop        doc         hardirqs        pidpersec    tcpaccept   xfsslower
bitesize      execsnoop   killsnoop       profile      tcpconnect  zfsdist
btrfsdist     ext4dist    mdflush         runqlat      tcpconnlat  zfsslower
btrfsslower   ext4slower  memleak         softirqs     tcpretrans
cachestat     filelife    mysqld_qslower  solisten     tplist
cachetop      fileslower  offcputime      sslsniff     trace
We shall cover a few examples under – monitoring general Linux system performance and networking.
Trace open() syscalls
Let’s start by tracing all open() syscalls using opensnoop. This enable us tell us how various applications work by identifying their data files, config files and many more:
$ cd /usr/share/bcc/tools
$ sudo ./opensnoop

PID    COMM               FD ERR PATH
1      systemd            35   0 /proc/self/mountinfo
2797   udisksd            13   0 /proc/self/mountinfo
1      systemd            35   0 /sys/devices/pci0000:00/0000:00:0d.0/ata3/host2/target2:0:0/2:0:0:0/block/sda/sda1/uevent
1      systemd            35   0 /run/udev/data/b8:1
1      systemd            -1   2 /etc/systemd/system/sys-kernel-debug-tracing.mount
1      systemd            -1   2 /run/systemd/system/sys-kernel-debug-tracing.mount
1      systemd            -1   2 /run/systemd/generator/sys-kernel-debug-tracing.mount
1      systemd            -1   2 /usr/local/lib/systemd/system/sys-kernel-debug-tracing.mount
2247   systemd            15   0 /proc/self/mountinfo
1      systemd            -1   2 /lib/systemd/system/sys-kernel-debug-tracing.mount
1      systemd            -1   2 /usr/lib/systemd/system/sys-kernel-debug-tracing.mount
1      systemd            -1   2 /run/systemd/generator.late/sys-kernel-debug-tracing.mount
1      systemd            -1   2 /etc/systemd/system/sys-kernel-debug-tracing.mount.wants
1      systemd            -1   2 /etc/systemd/system/sys-kernel-debug-tracing.mount.requires
1      systemd            -1   2 /run/systemd/system/sys-kernel-debug-tracing.mount.wants
1      systemd            -1   2 /run/systemd/system/sys-kernel-debug-tracing.mount.requires
1      systemd            -1   2 /run/systemd/generator/sys-kernel-debug-tracing.mount.wants
1      systemd            -1   2 /run/systemd/generator/sys-kernel-debug-tracing.mount.requires
1      systemd            -1   2 /usr/local/lib/systemd/system/sys-kernel-debug-tracing.mount.wants
1      systemd            -1   2 /usr/local/lib/systemd/system/sys-kernel-debug-tracing.mount.requires
1      systemd            -1   2 /lib/systemd/system/sys-kernel-debug-tracing.mount.wants
1      systemd            -1   2 /lib/systemd/system/sys-kernel-debug-tracing.mount.requires
1      systemd            -1   2 /usr/lib/systemd/system/sys-kernel-debug-tracing.mount.wants
1      systemd            -1   2 /usr/lib/systemd/system/sys-kernel-debug-tracing.mount.requires
1      systemd            -1   2 /run/systemd/generator.late/sys-kernel-debug-tracing.mount.wants
1      systemd            -1   2 /run/systemd/generator.late/sys-kernel-debug-tracing.mount.requires
1      systemd            -1   2 /etc/systemd/system/sys-kernel-debug-tracing.mount.d
1      systemd            -1   2 /run/systemd/system/sys-kernel-debug-tracing.mount.d
1      systemd            -1   2 /run/systemd/generator/sys-kernel-debug-tracing.mount.d
....
Summarize Block Device I/O Latency
In this example, it shows a summarized distribution of disk I/O latency using biolatecncy. After executing the command, wait for a few minutes and hit Ctrl-C to end it and view the output.
$ sudo ./biolatecncy

Tracing block device I/O... Hit Ctrl-C to end.
^C
     usecs               : count     distribution
         0 -> 1          : 0        |                                        |
         2 -> 3          : 0        |                                        |
         4 -> 7          : 0        |                                        |
         8 -> 15         : 0        |                                        |
        16 -> 31         : 0        |                                        |
        32 -> 63         : 0        |                                        |
        64 -> 127        : 0        |                                        |
       128 -> 255        : 3        |****************************************|
       256 -> 511        : 3        |****************************************|
       512 -> 1023       : 1        |*************                           |
Trace New Processes via exec() Syscalls
In this section, we shall move to tracing new processes in execution using execsnoop tool. Each time a process is forked by fork() and exec() syscalls, it is shown in the output. However, not all processes are captured.
$ sudo ./execsnoop

PCOMM            PID    PPID   RET ARGS
gnome-screensho  14882  14881    0 /usr/bin/gnome-screenshot --gapplication-service
systemd-hostnam  14892  1        0 /lib/systemd/systemd-hostnamed
nautilus         14897  2767    -2 /home/tecmint/bin/net usershare info
nautilus         14897  2767    -2 /home/tecmint/.local/bin/net usershare info
nautilus         14897  2767    -2 /usr/local/sbin/net usershare info
nautilus         14897  2767    -2 /usr/local/bin/net usershare info
nautilus         14897  2767    -2 /usr/sbin/net usershare info
nautilus         14897  2767    -2 /usr/bin/net usershare info
nautilus         14897  2767    -2 /sbin/net usershare info
nautilus         14897  2767    -2 /bin/net usershare info
nautilus         14897  2767    -2 /usr/games/net usershare info
nautilus         14897  2767    -2 /usr/local/games/net usershare info
nautilus         14897  2767    -2 /snap/bin/net usershare info
compiz           14899  14898   -2 /home/tecmint/bin/libreoffice --calc
compiz           14899  14898   -2 /home/tecmint/.local/bin/libreoffice --calc
compiz           14899  14898   -2 /usr/local/sbin/libreoffice --calc
compiz           14899  14898   -2 /usr/local/bin/libreoffice --calc
compiz           14899  14898   -2 /usr/sbin/libreoffice --calc
libreoffice      14899  2252     0 /usr/bin/libreoffice --calc
dirname          14902  14899    0 /usr/bin/dirname /usr/bin/libreoffice
basename         14903  14899    0 /usr/bin/basename /usr/bin/libreoffice
...
Trace Slow ext4 Operations
Using ext4slower to trace the ext4 file system common operations that are slower than 10ms, to help us identify independently slow disk I/O via the file system.
Suggested Read: 13 Linux Performance Monitoring Tools
It only outputs those operations that exceed a threshold:
$ sudo ./execslower

Tracing ext4 operations slower than 10 ms
TIME     COMM           PID    T BYTES   OFF_KB   LAT(ms) FILENAME
11:59:13 upstart        2252   W 48      1          10.76 dbus.log
11:59:13 gnome-screensh 14993  R 144     0          10.96 settings.ini
11:59:13 gnome-screensh 14993  R 28      0          16.02 gtk.css
11:59:13 gnome-screensh 14993  R 3389    0          18.32 gtk-main.css
11:59:25 rs:main Q:Reg  1826   W 156     60         31.85 syslog
11:59:25 pool           15002  R 208     0          14.98 .xsession-errors
11:59:25 pool           15002  R 644     0          12.28 .ICEauthority
11:59:25 pool           15002  R 220     0          13.38 .bash_logout
11:59:27 dconf-service  2599   S 0       0          22.75 user.BHDKOY
11:59:33 compiz         2548   R 4096    0          19.03 firefox.desktop
11:59:34 compiz         15008  R 128     0          27.52 firefox.sh
11:59:34 firefox        15008  R 128     0          36.48 firefox
11:59:34 zeitgeist-daem 2988   S 0       0          62.23 activity.sqlite-wal
11:59:34 zeitgeist-fts  2996   R 8192    40         15.67 postlist.DB
11:59:34 firefox        15008  R 140     0          18.05 dependentlibs.list
11:59:34 zeitgeist-fts  2996   S 0       0          25.96 position.tmp
11:59:34 firefox        15008  R 4096    0          10.67 libplc4.so
11:59:34 zeitgeist-fts  2996   S 0       0          11.29 termlist.tmp
...
Trace Block Device I/O with PID and Latency
Next off, let’s dive into printing a line per disk I/O each second, with details such as process ID, sector, bytes, latency among others using biosnoop:
$ sudo ./biosnoop

TIME(s)        COMM           PID    DISK    T  SECTOR    BYTES   LAT(ms)
0.000000000    ?              0              R  -1        8          0.26
2.047897000    ?              0              R  -1        8          0.21
3.280028000    kworker/u4:0   14871  sda     W  30552896  4096       0.24
3.280271000    jbd2/sda1-8    545    sda     W  29757720  12288      0.40
3.298318000    jbd2/sda1-8    545    sda     W  29757744  4096       0.14
4.096084000    ?              0              R  -1        8          0.27
6.143977000    ?              0              R  -1        8          0.27
8.192006000    ?              0              R  -1        8          0.26
8.303938000    kworker/u4:2   15084  sda     W  12586584  4096       0.14
8.303965000    kworker/u4:2   15084  sda     W  25174736  4096       0.14
10.239961000   ?              0              R  -1        8          0.26
12.292057000   ?              0              R  -1        8          0.20
14.335990000   ?              0              R  -1        8          0.26
16.383798000   ?              0              R  -1        8          0.17
...
Trace Page Cache hit/miss Ratio
Thereafter, we proceed to using cachestat to displays one line of summarized statistics from the system cache every second. This enables for system tuning operations by pointing out low cache hit ratio and high rate of misses:
$ sudo ./cachestat

 HITS   MISSES  DIRTIES  READ_HIT% WRITE_HIT%   BUFFERS_MB  CACHED_MB
       0        0        0       0.0%       0.0%           19        544
       4        4        2      25.0%      25.0%           19        544
    1321       33        4      97.3%       2.3%           19        545
    7476        0        2     100.0%       0.0%           19        545
    6228       15        2      99.7%       0.2%           19        545
       0        0        0       0.0%       0.0%           19        545
    7391      253      108      95.3%       2.7%           19        545
   33608     5382       28      86.1%      13.8%           19        567
   25098       37       36      99.7%       0.0%           19        566
   17624      239      416      96.3%       0.5%           19        520
...
Trace TCP Active Connections
Monitoring TCP connections every second using tcpconnect. Its output includes source and destination address, and port number. This tool is useful for tracing unexpected TCP connections, thereby helping us to identify inefficiencies in application configurations or an attacker.
$ sudo ./tcpconnect

PID    COMM         IP SADDR            DADDR            DPORT
15272  Socket Threa 4  10.0.2.15        91.189.89.240    80
15272  Socket Threa 4  10.0.2.15        216.58.199.142   443
15272  Socket Threa 4  10.0.2.15        216.58.199.142   80
15272  Socket Threa 4  10.0.2.15        216.58.199.174   443
15272  Socket Threa 4  10.0.2.15        54.200.62.216    443
15272  Socket Threa 4  10.0.2.15        54.200.62.216    443
15272  Socket Threa 4  10.0.2.15        117.18.237.29    80
15272  Socket Threa 4  10.0.2.15        216.58.199.142   80
15272  Socket Threa 4  10.0.2.15        216.58.199.131   80
15272  Socket Threa 4  10.0.2.15        216.58.199.131   443
15272  Socket Threa 4  10.0.2.15        52.222.135.52    443
15272  Socket Threa 4  10.0.2.15        216.58.199.131   443
15272  Socket Threa 4  10.0.2.15        54.200.62.216    443
15272  Socket Threa 4  10.0.2.15        54.200.62.216    443
15272  Socket Threa 4  10.0.2.15        216.58.199.132   443
15272  Socket Threa 4  10.0.2.15        216.58.199.131   443
15272  Socket Threa 4  10.0.2.15        216.58.199.142   443
15272  Socket Threa 4  10.0.2.15        54.69.17.198     443
15272  Socket Threa 4  10.0.2.15        54.69.17.198     443
...
All the tools above can also be used with various options, to enable the help page for a given tool, make use of the -h option, for example:
$ sudo ./tcpconnect -h

usage: tcpconnect [-h] [-t] [-p PID] [-P PORT]

Trace TCP connects

optional arguments:
  -h, --help            show this help message and exit
  -t, --timestamp       include timestamp on output
  -p PID, --pid PID     trace this PID only
  -P PORT, --port PORT  comma-separated list of destination ports to trace.

examples:
    ./tcpconnect           # trace all TCP connect()s
    ./tcpconnect -t        # include timestamps
    ./tcpconnect -p 181    # only trace PID 181
    ./tcpconnect -P 80     # only trace port 80
    ./tcpconnect -P 80,81  # only trace port 80 and 81
Trace Failed exec()s Syscalls
To trace failed exec()s syscalls, employ the -x option with opensnoop as below:
$ sudo ./opensnoop -x

PID    COMM               FD ERR PATH
15414  pool               -1   2 /home/.hidden
15415  (ostnamed)         -1   2 /sys/fs/cgroup/cpu/system.slice/systemd-hostnamed.service/cgroup.procs
15415  (ostnamed)         -1   2 /sys/fs/cgroup/cpu/system.slice/cgroup.procs
15415  (ostnamed)         -1   2 /sys/fs/cgroup/cpuacct/system.slice/systemd-hostnamed.service/cgroup.procs
15415  (ostnamed)         -1   2 /sys/fs/cgroup/cpuacct/system.slice/cgroup.procs
15415  (ostnamed)         -1   2 /sys/fs/cgroup/blkio/system.slice/systemd-hostnamed.service/cgroup.procs
15415  (ostnamed)         -1   2 /sys/fs/cgroup/blkio/system.slice/cgroup.procs
15415  (ostnamed)         -1   2 /sys/fs/cgroup/memory/system.slice/systemd-hostnamed.service/cgroup.procs
15415  (ostnamed)         -1   2 /sys/fs/cgroup/memory/system.slice/cgroup.procs
15415  (ostnamed)         -1   2 /sys/fs/cgroup/pids/system.slice/systemd-hostnamed.service/cgroup.procs
2548   compiz             -1   2
15416  systemd-cgroups    -1   2 /run/systemd/container
15416  systemd-cgroups    -1   2 /sys/fs/kdbus/0-system/bus
15415  systemd-hostnam    -1   2 /run/systemd/container
15415  systemd-hostnam    -1  13 /proc/1/environ
15415  systemd-hostnam    -1   2 /sys/fs/kdbus/0-system/bus
1695   dbus-daemon        -1   2 /run/systemd/users/0
15415  systemd-hostnam    -1   2 /etc/machine-info
15414  pool               -1   2 /home/tecmint/.hidden
15414  pool               -1   2 /home/tecmint/Binary/.hidden
2599   dconf-service      -1   2 /run/user/1000/dconf/user
...
Trace Particular Process Functions
The last example below demonstrates how to execute a custom trace operation. We are tracing a particular process using its PID.
Suggested Read: Netdata – A Real-Time Performance Monitoring Tool for Linux
First determine the process ID:
$ pidof firefox

15437
Later on, run the custom trace command. In the command below: -p specifies the process ID, do_sys_open() is a kernel function that is traced dynamically including its second argument as a string.
$ sudo ./trace -p 4095 'do_sys_open "%s", arg2'

TIME     PID    COMM         FUNC             -
12:17:14 15437  firefox      do_sys_open      /run/user/1000/dconf/user
12:17:14 15437  firefox      do_sys_open      /home/tecmint/.config/dconf/user
12:18:07 15437  firefox      do_sys_open      /run/user/1000/dconf/user
12:18:07 15437  firefox      do_sys_open      /home/tecmint/.config/dconf/user
12:18:13 15437  firefox      do_sys_open      /sys/devices/system/cpu/present
12:18:13 15437  firefox      do_sys_open      /dev/urandom
12:18:13 15437  firefox      do_sys_open      /dev/urandom
12:18:14 15437  firefox      do_sys_open      /usr/share/fonts/truetype/liberation/LiberationSans-Italic.ttf
12:18:14 15437  firefox      do_sys_open      /usr/share/fonts/truetype/liberation/LiberationSans-Italic.ttf
12:18:14 15437  firefox      do_sys_open      /usr/share/fonts/truetype/liberation/LiberationSans-Italic.ttf
12:18:14 15437  firefox      do_sys_open      /sys/devices/system/cpu/present
12:18:14 15437  firefox      do_sys_open      /dev/urandom
12:18:14 15437  firefox      do_sys_open      /dev/urandom
12:18:14 15437  firefox      do_sys_open      /dev/urandom
12:18:14 15437  firefox      do_sys_open      /dev/urandom
12:18:15 15437  firefox      do_sys_open      /sys/devices/system/cpu/present
12:18:15 15437  firefox      do_sys_open      /dev/urandom
12:18:15 15437  firefox      do_sys_open      /dev/urandom
12:18:15 15437  firefox      do_sys_open      /sys/devices/system/cpu/present
12:18:15 15437  firefox      do_sys_open      /dev/urandom
12:18:15 15437  firefox      do_sys_open      /dev/urandom
....
Summary
BCC is a powerful and easy-to-use toolkit for various System administration tasks such as tracing system performance monitoring, tracing block device I/O, TCP functions, file system operations, syscalls, Node.js probes, plus lots more. Importantly, it ships in with several example files and man pages for the tools to guide you, making it user friendly and reliable.
Last but not least, you can get back to us by sharing your thoughts about the subject, ask questions, make useful suggestions or any constructive feedback via the comment section below.
Source