One important task in a network is control and manage staffs web surfing traffics, there are many solutions that can handles this issue, one of the best solutions is using squid cache on a Linux machine. Squid can inspect, limit and cache web traffics flow from one network to another network for example from a LAN to the Internet.
Traffic Control Using Squid and Cisco Router in CentOS
There is a few ways for redirecting client’s web requests to squid machine, in this article we will show you how to redirect web traffic from a CISCO router to a Squid Cache machine using WCCP protocol.
The picture below is an example of a basic scenario.
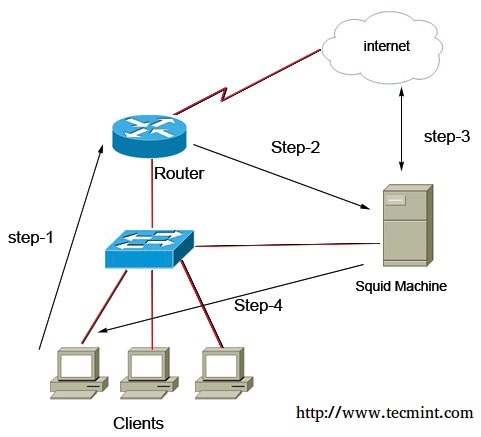
Control Web Traffic Using Squid Cisco Router
As you see in above picture all client’s web traffics first goes to Cisco Router (That is their default gateway), then router silently redirect packets to squid machine, now squid can play it’s roles, the main roles is caching web contents, limit access based on domains, time intervals, ip addresses, size of files, etc..
We review this scenario’s configuration in two Major steps, first we should install and configure squid and Linux, then configure router to redirecting web traffic packets into squid using WCCP protocol.
Testing Environment
In this scenario I use CENTOS 6.5 as my LINUX server and Cisco 2691 as my Router system.
Operating System: CENTOS 6.5
Application: Squid
Router: Cisco 2691
Step 1: Installing Squid Cache
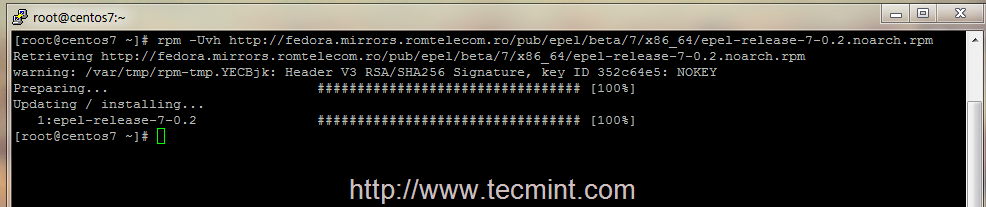
Squid is available on default repository of CENTOS, we first install it using lovely yum command and then start their services and finally set automatic starting of squid service.
# yum -y install squid
# service squid start
# chkconfig squid on
Step 2: Preparing Squid Cache
Now we must change some default behaviors of centos operation system, we need to enable packet forwarding and disable reverse Path filter (RPF), we enable packet forwarding to let the centos acting as a transparent forwarder (like a router).
Let me explain in more detail, when traffics gets in centos it have their source and destination addresses, for example when a client enter www.example.com on his/her browser a http request packet generates and it have source ip address of client machine (like 192.168.1.20) and destination ip address of example.com server (like 2.2.2.2).
So, when packet received by centos it detect as an wrong packet because centos ip address is not as destination address of the packet, for security reasons centos drop the packet, but we want from squid to act in transparent mode. We tell this situation to centos by enabling packet forwarding potion.
Next we should disable Reverse path Filtering to let the centos accepting packets that not accessible by squid machine or it packets that do not have ip address in the same subnet of squid machine.
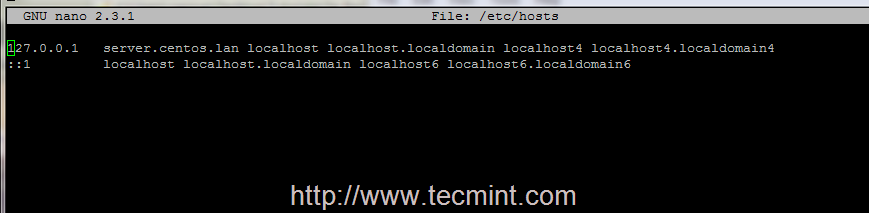
# nano /etc/sysctl.conf
net.ipv4.ip_forward = 1 #set to 1 for enable the packet forwarding feature
net.ipv4.conf.default.rp_filter = 0 # set to 0 for disable the reverse path filter behavior
Next we need to create a GRE interface on CENTOS machine, for what?? Let me explain more, the WCCPprotocol works through a GRE Tunnel, it means the language between router and Squid is GRE, so centos need to have a GRE interface for De-encapsulate GRE packets.
We should create the configuration file for GRE interface in “/etc/sysconfig/network-script/ifcfg-gre0” path.
Enter below codes in ifcfg-gre0 configuration file.
DEVICE=gre0
BOOTPROTO=static
IPADDR=10.0.0.2         #unused ip address in your network
NETMASK=255.255.255.252
ONBOOT=yes
IPV6INIT=no
After creating a GRE interface we need to restart network service.
# service network restart
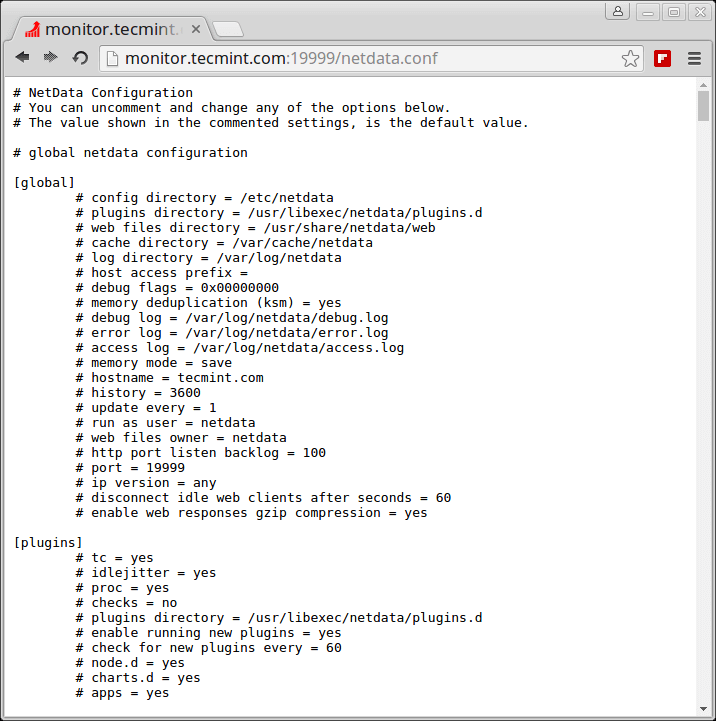
Step 3: Configuring Squid Cache
We need to tell squid accepting WCCP packets from router. Enter below codes in /etc/squid/squid.conf file.
http_port 3128 intercept                 # Define SQUID listening port
wccp2_router 192.168.1.254          #ip address of the router
wccp2_forwarding_method gre
wccp2_return_method gre
wccp2_service standard 0
Save the configuration file and restart squid service.
# service squid restart
Squid listen for packets in 3128 port, but our packet’s destination port number is 80, so for changing destination port 80 to 3128, we need to create a NAT rule on CENTOS integrated firewall (that named iptable).
# iptables -t nat -A PREROUTING -i gre0 -p tcp --dport 80 -j REDIRECT --to-port 3128
# iptables -t nat -A POSTROUTING -j MASQUERADE
Step 4: Cisco Router Configurations
First we should enable WCCP on cisco router.
R1(config)# ip wccp version 2
Then we must use an ACL for introducing SQUID cache machine to router
R1(config)# ip access-list standard SQUID-MACHINE
R1(config-std-nacl)# permit host 192.168.1.10
Next we define another access list for two different purpose first we should except SQUID traffics from redirecting by WCCP protocol (if not we fall into an infinite loop!!) second we define which LAN traffics we want to passing through WCCP and SQUID.
R1(config)#ip access-list LAN-TRAFFICS
R1(config-ext-nacl)#deny ip host 192.168.1.10 any                            #Prevent SQUID to get in loop
R1(config-ext-nacl)#permit tcp 192.168.1.0 0.0.0.255 any equal www           #define LAN Traffics
After creating our access-list we must configure WCCP protocol on router.
R1(config)# ip wccp web-cache redirect-list LAN-TRAFFIC group-list SQUID-MACHINE
Every things is ready for final step, we must tell the router that in which interface/interfaces it must redirect traffics using their WCCP configuration.
R1(config)#interface fastEthernet 0/0
R1((config-if)# ip wccp web-cache redirect in
Summary
It’s time to summarize all commands and texts in a few lines for better understanding, according to the scenario we redirect staffs web surfing packets (that is on TCP port 80) from the ROUTER (that is default gateway of the clients) toward the squid cache machine using WCCP protocol.
All these process happened silently and there is no additional configuration on client side. So we can control and set policies on web traffics in the LAN. For example, we can gain web surfing access just in a limited time, limit maximum download size, define our custom blacklist and whitelist, generate full reports of internet activity usage and etc.
One of the interesting facts in this scenario is when squid machine goes down router detect this issue and stop redirecting packets toward it, so you can enjoy from zero-downtime in your network.
If you have any questions regarding to this article please leave a reply through below comment box.
Source