30 Useful ‘ps Command’ Examples for Linux Process Monitoring

ps (processes status) is a native Unix/Linux utility for viewing information concerning a selection of running processes on a system: it reads this information from the virtual files in /proc filesystem. It is one of the important utilities for system administration specifically under process monitoring, to help you understand whats is going on a Linux system.

It has numerous options for manipulating its output, however you’ll find a small number of them practically useful for daily usage.

Read AlsoAll You Need To Know About Processes in Linux [Comprehensive Guide]

In this article, we’ll look at 30 useful examples of ps commands for monitoring active running processes on a Linux system.

Note that ps produces output with a heading line, which represents the meaning of each column of information, you can find the meaning of all the labels in the ps man page.

List All Processes in Current Shell

1. If you run ps command without any arguments, it displays processes for the current shell.

$ ps 

List Current Running Processes

List Current Running Processes

Print All Processes in Different Formats

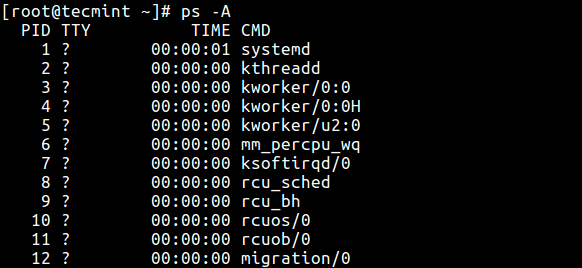
2. Display every active process on a Linux system in generic (Unix/Linux) format.

$ ps -A
OR
$ ps -e

List Processes in Standard Format

List Processes in Standard Format

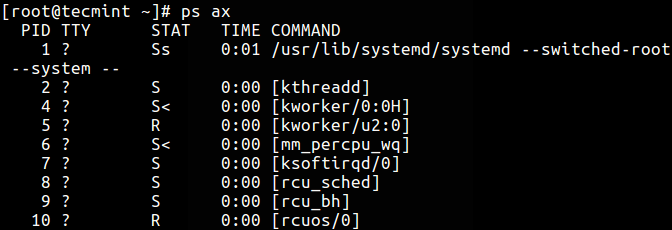
3. Display all processes in BSD format.

$ ps au
OR
$ ps axu

List Processes in BSD Format

List Processes in BSD Format

4. To perform a full-format listing, add the -f or -F flag.

$ ps -ef
OR
$ ps -eF

List Processes in Long List Format

List Processes in Long List Format

Display User Running Processes

5. You can select all processes owned by you (runner of the ps command, root in this case), type:

$ ps -x 

6. To display a user’s processes by real user ID (RUID) or name, use the -U flag.

$ ps -fU tecmint
OR
$ ps -fu 1000

List User Processes by ID

List User Processes by ID

7. To select a user’s processes by effective user ID (EUID) or name, use the -u option.

$ ps -fu tecmint
OR
$ ps -fu 1000

Print All Processes Running as Root (Real and Effecitve ID)

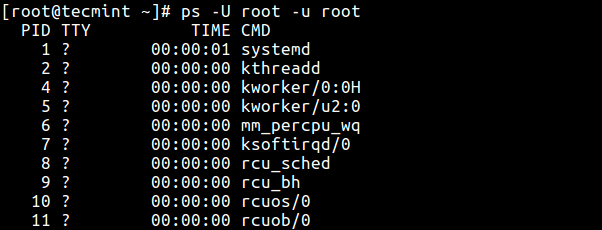
8. The command below enables you to view every process running with root user privileges (real & effective ID) in user format.

$ ps -U root -u root 

Display Root User Running Processes

Display Root User Running Processes

Display Group Processes

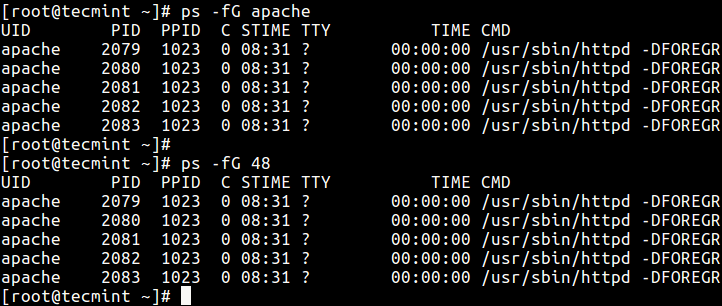
9. If you want to list all processes owned by a certain group (real group ID (RGID) or name), type.

$ ps -fG apache
OR
$ ps -fG 48

Display Group Processes

Display Group Processes

10. To list all processes owned by effective group name (or session), type.

$ ps -fg apache

Display Processes by PID and PPID

11. You can list processes by PID as follows.

$ ps -fp 1178

List Processes by PID

List Processes by PID

12. To select process by PPID, type.

$ ps -f --ppid 1154

List Process by PPID

List Process by PPID

13. Make selection using PID list.

$ ps -fp 2226,1154,1146

List Processes by PIDs

List Processes by PIDs

Display Processes by TTY

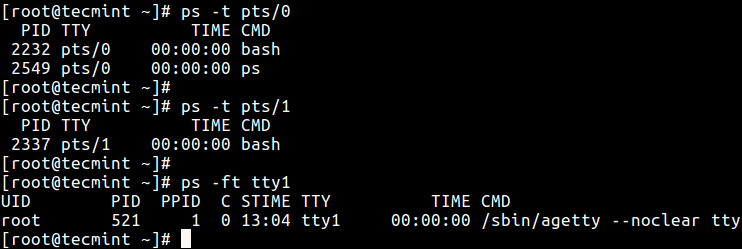
14. To select processes by tty, use the -t flag as follows.

$ ps -t pst/0
$ ps -t pst/1
$ ps -ft tty1

List Processes by TTY

List Processes by TTY

Print Process Tree

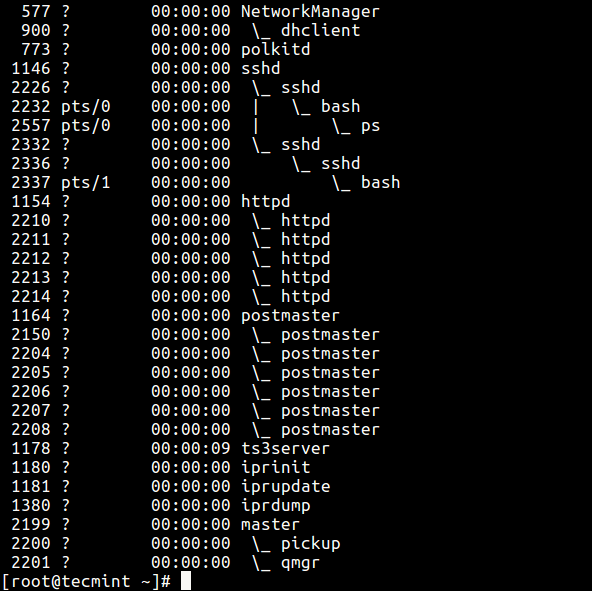
15. A process tree shows how processes on the system are linked to each other; processes whose parents have been killed are adopted by the init (or systemd).

$ ps -e --forest 

List Process Tree

List Process Tree

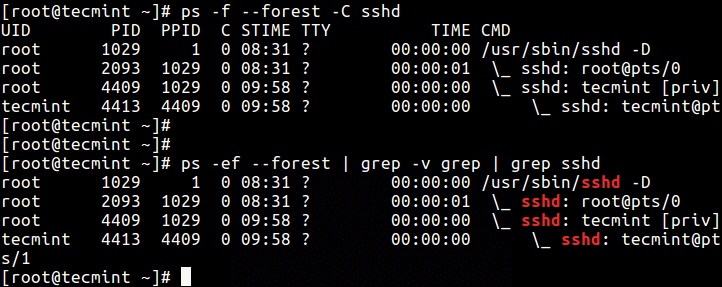
16. You can also print a process tree for a given process like this.

$ ps -f --forest -C sshd
OR
$ ps -ef --forest | grep -v grep | grep sshd 

List Tree View of Process

List Tree View of Process

Print Process Threads

17. To print all threads of a process, use the -H flag, this will show the LWP (light weight process) as well as NLWP (number of light weight process) columns.

$ ps -fL -C httpd

List Process Threads

List Process Threads

Specify Custom Output Format

Using the -o or –format options, ps allows you to build user-defined output formats as shown below.

18. To list all format specifiers, include the L flag.

$ ps L

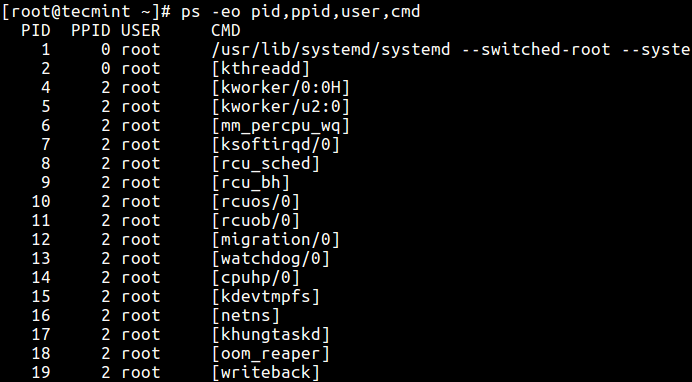
19. The command below allows you to view the PIDPPID, user name and command of a process.

$ ps -eo pid,ppid,user,cmd

List Processes with Names

List Processes with Names

20. Below is another example of a custom output format showing file system group, nice value, start time and elapsed time of a process.

$ ps -p 1154 -o pid,ppid,fgroup,ni,lstart,etime

List Process ID Information

List Process ID Information

21. To find a process name using its PID.

$ ps -p 1154 -o comm=

Find Process using PID

Find Process using PID

Display Parent and Child Processes

22. To select a specific process by its name, use the -C flag, this will also display all its child processes.

$ ps -C sshd

Find Parent Child Process

Find Parent Child Process

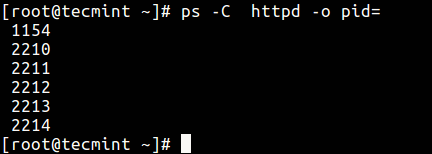
23. Find all PIDs of all instances of a process, useful when writing scripts that need to read PIDs from a std output or file.

$ ps -C httpd -o pid=

Find All Process PIDs

Find All Process PIDs

24. Check execution time of a process.

$ ps -eo comm,etime,user | grep httpd

The output below shows the HTTPD service has been running for 1 hours, 48 minutes and 17 seconds.

Find Process Uptime

Find Process Uptime

Troubleshoot Linux System Performance

If your system isn’t working as it should be, for instance if it’s unusually slow, you can perform some system troubleshooting as follows.

26. Find top running processes by highest memory and CPU usage in Linux.

$ ps -eo pid,ppid,cmd,%mem,%cpu --sort=-%mem | head
OR
$ ps -eo pid,ppid,cmd,%mem,%cpu --sort=-%cpu | head

Find Top Running Processes

Find Top Running Processes

27. To kill an Linux processes/unresponsive applications or any process that is consuming high CPU time.

First, find the PID of the unresponsive process or application.

$ ps -A | grep -i stress

Then use the kill command to terminate it immediately.

$ kill -9 2583 2584

Find and Kill a Process

Find and Kill a Process

Print Security Information

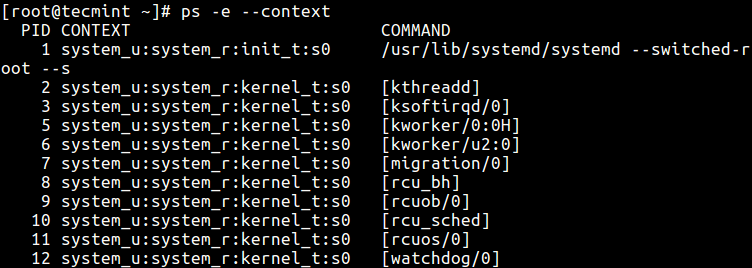
28. Show security context (specifically for SELinux) like this.

$ ps -eM
OR
$ ps --context

Find SELinux Context

Find SELinux Context

29. You can also display security information in user-defined format with this command.

$ ps -eo  euser,ruser,suser,fuser,f,comm,label

List SELinux Context by Users

List SELinux Context by Users

Perform Real-time Process Monitoring Using Watch Utility

30. Finally, since ps displays static information, you can employ the watch utility to perform real-time process monitoring with repetitive output, displayed after every second as in the command below (specify a custom ps command to achieve your objective).

$ watch -n 1 'ps -eo pid,ppid,cmd,%mem,%cpu --sort=-%mem | head'

Real Time Process Monitoring

Real Time Process Monitoring

Important: ps only shows static information, to view frequently updated output you can use tools such as htoptop and glances: the last two are in fact Linux system performance monitoring tool.

You might also like to read these following related articles.

  1. How to Find a Process Name Using PID Number in Linux
  2. Find Top Running Processes by Highest Memory and CPU Usage in Linux
  3. A Guide to Kill, Pkill and Killall Commands to Terminate a Process in Linux
  4. How to Find and Kill Running Processes in Linux
  5. How to Start Linux Command in Background and Detach Process in Terminal

That’s all for now. If you have any useful ps command example(s) to share (not forgetting to explain what it does), use the comment form below.

Source

10 Useful Commands to Collect System and Hardware Information in Linux

It is always a good practice to know the hardware components of your Linux system is running on, this helps you to deal with compatibility issues when it comes to installing packages, drivers on your system.

Therefore in this tips and tricks, we shall look at some useful commands that can help you to extract information about your Linux system and hardware components.

1. How to View Linux System Information

To know only system name, you can use uname command without any switch will print system information or uname -s command will print the kernel name of your system.

tecmint@tecmint ~ $ uname

Linux

To view your network hostname, use ‘-n’ switch with uname command as shown.

tecmint@tecmint ~ $ uname -n

tecmint.com

To get information about kernel-version, use ‘-v’ switch.

tecmint@tecmint ~ $ uname -v

#64-Ubuntu SMP Mon Sep 22 21:28:38 UTC 2014

To get the information about your kernel release, use ‘-r’ switch.

tecmint@tecmint ~ $ uname -r

3.13.0-37-generic

To print your machine hardware name, use ‘-m’ switch:

tecmint@tecmint ~ $ uname -m

x86_64

All this information can be printed at once by running ‘uname -a’ command as shown below.

tecmint@tecmint ~ $ uname -a

Linux tecmint.com 3.13.0-37-generic #64-Ubuntu SMP Mon Sep 22 21:28:38 UTC 2014 x86_64 x86_64 x86_64 GNU/Linux

2. How to View Linux System Hardware Information

Here you can use the lshw tool to gather vast information about your hardware components such as cpudisksmemoryusb controllers etc.

lshw is a relatively small tool and there are few options that you can use with it while extracting information. The information provided by lshw gathered form different /proc files.

Note: Do remember that the lshw command executed by superuser (root) or sudo user.

Read AlsoDifference Between su and sudo User in Linux

To print information about your Linux system hardware, run this command.

tecmint@tecmint ~ $ sudo lshw

tecmint.com               
    description: Notebook
    product: 20354 (LENOVO_MT_20354_BU_idea_FM_Lenovo Z50-70)
    vendor: LENOVO
    version: Lenovo Z50-70
    serial: 1037407803441
    width: 64 bits
    capabilities: smbios-2.7 dmi-2.7 vsyscall32
    configuration: administrator_password=disabled boot=normal chassis=notebook family=IDEAPAD frontpanel_password=disabled keyboard_password=disabled power-on_password=disabled sku=LENOVO_MT_20354_BU_idea_FM_Lenovo Z50-70 uuid=E4B1D229-D237-E411-9F6E-28D244EBBD98
  *-core
       description: Motherboard
       product: Lancer 5A5
       vendor: LENOVO
       physical id: 0
       version: 31900059WIN
       serial: YB06377069
       slot: Type2 - Board Chassis Location
     *-firmware
          description: BIOS
          vendor: LENOVO
          physical id: 0
          version: 9BCN26WW
          date: 07/31/2014
          size: 128KiB
          capacity: 4032KiB
          capabilities: pci upgrade shadowing cdboot bootselect edd int13floppynec int13floppytoshiba int13floppy360 int13floppy1200 int13floppy720 int13floppy2880 int9keyboard int10video acpi usb biosbootspecification uefi
......

You can print a summary of your hardware information by using the -short option.

tecmint@tecmint ~ $ sudo lshw -short

H/W path       Device      Class          Description
=====================================================
                           system         20354 (LENOVO_MT_20354_BU_idea_FM_Lenovo Z50-70)
/0                         bus            Lancer 5A5
/0/0                       memory         128KiB BIOS
/0/4                       processor      Intel(R) Core(TM) i5-4210U CPU @ 1.70GHz
/0/4/b                     memory         32KiB L1 cache
/0/4/c                     memory         256KiB L2 cache
/0/4/d                     memory         3MiB L3 cache
/0/a                       memory         32KiB L1 cache
/0/12                      memory         8GiB System Memory
/0/12/0                    memory         DIMM [empty]
/0/12/1                    memory         DIMM [empty]
/0/12/2                    memory         8GiB SODIMM DDR3 Synchronous 1600 MHz (0.6 ns)
/0/12/3                    memory         DIMM [empty]
/0/100                     bridge         Haswell-ULT DRAM Controller
/0/100/2                   display        Haswell-ULT Integrated Graphics Controller
/0/100/3                   multimedia     Haswell-ULT HD Audio Controller
...

If you wish to generate output as a html file, you can use the option -html.

tecmint@tecmint ~ $ sudo lshw -html > lshw.html

Generate Linux Hardware Information in HTML

Generate Linux Hardware Information in HTML

3. How to View Linux CPU Information

To view information about your CPU, use the lscpu command as it shows information about your CPU architecture such as number of CPU’s, cores, CPU family model, CPU caches, threads, etc from sysfs and /proc/cpuinfo.

tecmint@tecmint ~ $ lscpu

Architecture:          x86_64
CPU op-mode(s):        32-bit, 64-bit
Byte Order:            Little Endian
CPU(s):                4
On-line CPU(s) list:   0-3
Thread(s) per core:    2
Core(s) per socket:    2
Socket(s):             1
NUMA node(s):          1
Vendor ID:             GenuineIntel
CPU family:            6
Model:                 69
Stepping:              1
CPU MHz:               768.000
BogoMIPS:              4788.72
Virtualization:        VT-x
L1d cache:             32K
L1i cache:             32K
L2 cache:              256K
L3 cache:              3072K
NUMA node0 CPU(s):     0-3

4. How to Collect Linux Block Device Information

Block devices are storage devices such as hard disks, flash drives etc. lsblk command is used to report information about block devices as follows.

tecmint@tecmint ~ $ lsblk

NAME    MAJ:MIN RM   SIZE RO TYPE MOUNTPOINT
sda       8:0    0 931.5G  0 disk 
├─sda1    8:1    0  1000M  0 part 
├─sda2    8:2    0   260M  0 part /boot/efi
├─sda3    8:3    0  1000M  0 part 
├─sda4    8:4    0   128M  0 part 
├─sda5    8:5    0 557.1G  0 part 
├─sda6    8:6    0    25G  0 part 
├─sda7    8:7    0  14.7G  0 part 
├─sda8    8:8    0     1M  0 part 
├─sda9    8:9    0 324.5G  0 part /
└─sda10   8:10   0   7.9G  0 part [SWAP]
sr0      11:0    1  1024M  0 rom  

If you want to view all block devices on your system then include the -a option.

tecmint@tecmint ~ $ lsblk -a

NAME    MAJ:MIN RM   SIZE RO TYPE MOUNTPOINT
sda       8:0    0 931.5G  0 disk 
├─sda1    8:1    0  1000M  0 part 
├─sda2    8:2    0   260M  0 part /boot/efi
├─sda3    8:3    0  1000M  0 part 
├─sda4    8:4    0   128M  0 part 
├─sda5    8:5    0 557.1G  0 part 
├─sda6    8:6    0    25G  0 part 
├─sda7    8:7    0  14.7G  0 part 
├─sda8    8:8    0     1M  0 part 
├─sda9    8:9    0 324.5G  0 part /
└─sda10   8:10   0   7.9G  0 part [SWAP]
sdb       8:16   1         0 disk 
sr0      11:0    1  1024M  0 rom  
ram0      1:0    0    64M  0 disk 
ram1      1:1    0    64M  0 disk 
ram2      1:2    0    64M  0 disk 
ram3      1:3    0    64M  0 disk 
ram4      1:4    0    64M  0 disk 
ram5      1:5    0    64M  0 disk 
ram6      1:6    0    64M  0 disk 
ram7      1:7    0    64M  0 disk 
ram8      1:8    0    64M  0 disk 
ram9      1:9    0    64M  0 disk 
loop0     7:0    0         0 loop 
loop1     7:1    0         0 loop 
loop2     7:2    0         0 loop 
loop3     7:3    0         0 loop 
loop4     7:4    0         0 loop 
loop5     7:5    0         0 loop 
loop6     7:6    0         0 loop 
loop7     7:7    0         0 loop 
ram10     1:10   0    64M  0 disk 
ram11     1:11   0    64M  0 disk 
ram12     1:12   0    64M  0 disk 
ram13     1:13   0    64M  0 disk 
ram14     1:14   0    64M  0 disk 
ram15     1:15   0    64M  0 disk 

5. How to Print USB Controllers Information

The lsusb command is used to report information about USB controllers and all the devices that are connected to them.

tecmint@tecmint ~ $ lsusb

Bus 001 Device 002: ID 8087:8000 Intel Corp. 
Bus 001 Device 001: ID 1d6b:0002 Linux Foundation 2.0 root hub
Bus 003 Device 001: ID 1d6b:0003 Linux Foundation 3.0 root hub
Bus 002 Device 005: ID 0bda:b728 Realtek Semiconductor Corp. 
Bus 002 Device 004: ID 5986:0249 Acer, Inc 
Bus 002 Device 003: ID 0bda:0129 Realtek Semiconductor Corp. RTS5129 Card Reader Controller
Bus 002 Device 002: ID 045e:00cb Microsoft Corp. Basic Optical Mouse v2.0
Bus 002 Device 001: ID 1d6b:0002 Linux Foundation 2.0 root hub

You can use the -v option to generate a detailed information about each USB device.

tecmint@tecmint ~ $ lsusb -v

6. How to Print PCI Devices Information

PCI devices may included usb ports, graphics cards, network adapters etc. The lspci tool is used to generate information concerning all PCI controllers on your system plus the devices that are connected to them.

To print information about PCI devices run the following command.

tecmint@tecmint ~ $ lspci

00:00.0 Host bridge: Intel Corporation Haswell-ULT DRAM Controller (rev 0b)
00:02.0 VGA compatible controller: Intel Corporation Haswell-ULT Integrated Graphics Controller (rev 0b)
00:03.0 Audio device: Intel Corporation Haswell-ULT HD Audio Controller (rev 0b)
00:14.0 USB controller: Intel Corporation Lynx Point-LP USB xHCI HC (rev 04)
00:16.0 Communication controller: Intel Corporation Lynx Point-LP HECI #0 (rev 04)
00:1b.0 Audio device: Intel Corporation Lynx Point-LP HD Audio Controller (rev 04)
00:1c.0 PCI bridge: Intel Corporation Lynx Point-LP PCI Express Root Port 3 (rev e4)
00:1c.3 PCI bridge: Intel Corporation Lynx Point-LP PCI Express Root Port 4 (rev e4)
00:1c.4 PCI bridge: Intel Corporation Lynx Point-LP PCI Express Root Port 5 (rev e4)
00:1d.0 USB controller: Intel Corporation Lynx Point-LP USB EHCI #1 (rev 04)
00:1f.0 ISA bridge: Intel Corporation Lynx Point-LP LPC Controller (rev 04)
00:1f.2 SATA controller: Intel Corporation Lynx Point-LP SATA Controller 1 [AHCI mode] (rev 04)
00:1f.3 SMBus: Intel Corporation Lynx Point-LP SMBus Controller (rev 04)
01:00.0 Ethernet controller: Realtek Semiconductor Co., Ltd. RTL8111/8168/8411 PCI Express Gigabit Ethernet Controller (rev 10)
02:00.0 Network controller: Realtek Semiconductor Co., Ltd. RTL8723BE PCIe Wireless Network Adapter
03:00.0 3D controller: NVIDIA Corporation GM108M [GeForce 840M] (rev a2)

Use the -t option to produce output in a tree format.

tecmint@tecmint ~ $ lspci -t

-[0000:00]-+-00.0
           +-02.0
           +-03.0
           +-14.0
           +-16.0
           +-1b.0
           +-1c.0-[01]----00.0
           +-1c.3-[02]----00.0
           +-1c.4-[03]----00.0
           +-1d.0
           +-1f.0
           +-1f.2
           \-1f.3

Use the -v option to produce detailed information about each connected device.

tecmint@tecmint ~ $ lspci -v

00:00.0 Host bridge: Intel Corporation Haswell-ULT DRAM Controller (rev 0b)
	Subsystem: Lenovo Device 3978
	Flags: bus master, fast devsel, latency 0
	Capabilities: 

00:02.0 VGA compatible controller: Intel Corporation Haswell-ULT Integrated Graphics Controller (rev 0b) (prog-if 00 [VGA controller])
	Subsystem: Lenovo Device 380d
	Flags: bus master, fast devsel, latency 0, IRQ 62
	Memory at c3000000 (64-bit, non-prefetchable) [size=4M]
	Memory at d0000000 (64-bit, prefetchable) [size=256M]
	I/O ports at 6000 [size=64]
	Expansion ROM at  [disabled]
	Capabilities: 
	Kernel driver in use: i915
.....

7. How to Print SCSI Devices Information

To view all your scsi/sata devices, use the lsscsi command as follows. If you do not have lsscsi tool installed, run the following command to install it.

$ sudo apt-get install lsscsi        [on Debian derivatives]
# yum install lsscsi                 [On RedHat based systems]
# dnf install lsscsi                 [On Fedora 21+ Onwards]

After install, run the lsscsi command as shown:

tecmint@tecmint ~ $ lsscsi

[0:0:0:0]    disk    ATA      ST1000LM024 HN-M 2BA3  /dev/sda 
[1:0:0:0]    cd/dvd  PLDS     DVD-RW DA8A5SH   RL61  /dev/sr0 
[4:0:0:0]    disk    Generic- xD/SD/M.S.       1.00  /dev/sdb 

Use the -s option to show device sizes.

tecmint@tecmint ~ $ lsscsi -s

[0:0:0:0]    disk    ATA      ST1000LM024 HN-M 2BA3  /dev/sda   1.00TB
[1:0:0:0]    cd/dvd  PLDS     DVD-RW DA8A5SH   RL61  /dev/sr0        -
[4:0:0:0]    disk    Generic- xD/SD/M.S.       1.00  /dev/sdb        -

8. How to Print Information about SATA Devices

You can find some information about sata devices on your system as follows using the hdparm utility. In the example below, I used the block device /dev/sda1 which the harddisk on my system.

tecmint@tecmint ~ $ sudo hdparm /dev/sda1

/dev/sda1:
 multcount     =  0 (off)
 IO_support    =  1 (32-bit)
 readonly      =  0 (off)
 readahead     = 256 (on)
 geometry      = 56065/255/63, sectors = 2048000, start = 2048

To print information about device geometry interms of cylinders, heads, sectors, size and the starting offset of the device, use the -g option.

tecmint@tecmint ~ $ sudo hdparm -g /dev/sda1

/dev/sda1:
 geometry      = 56065/255/63, sectors = 2048000, start = 2048

9. How to Print Linux File System Information

To gather information about file system partitions, you can use fdisk command. Although the main functionality of fdisk command is to modify file system partitions, it can also be used to view information about the different partitions on your file system.

You can print partition information as follows. Remember to run the command as a superuser or else you may not see any output.

tecmint@tecmint ~ $ sudo fdisk -l

WARNING: GPT (GUID Partition Table) detected on '/dev/sda'! The util fdisk doesn't support GPT. Use GNU Parted.


Disk /dev/sda: 1000.2 GB, 1000204886016 bytes
255 heads, 63 sectors/track, 121601 cylinders, total 1953525168 sectors
Units = sectors of 1 * 512 = 512 bytes
Sector size (logical/physical): 512 bytes / 4096 bytes
I/O size (minimum/optimal): 4096 bytes / 4096 bytes
Disk identifier: 0xcee8ad92

   Device Boot      Start         End      Blocks   Id  System
/dev/sda1               1  1953525167   976762583+  ee  GPT
Partition 1 does not start on physical sector boundary.

10. How to Extract Information about Hardware Components

You can also use the dmidecode utility to extract hardware information by reading data from the DMI tables.

To print information about memory, run this command as a superuser.

tecmint@tecmint ~ $ sudo dmidecode -t memory

# dmidecode 2.12
# SMBIOS entry point at 0xaaebef98
SMBIOS 2.7 present.

Handle 0x0005, DMI type 5, 24 bytes
Memory Controller Information
	Error Detecting Method: None
	Error Correcting Capabilities:
		None
	Supported Interleave: One-way Interleave
	Current Interleave: One-way Interleave
	Maximum Memory Module Size: 8192 MB
	Maximum Total Memory Size: 32768 MB
	Supported Speeds:
		Other
	Supported Memory Types:
		Other
	Memory Module Voltage: Unknown
	Associated Memory Slots: 4
		0x0006
		0x0007
		0x0008
		0x0009
	Enabled Error Correcting Capabilities:
		None
...

To print information about system, run this command.

tecmint@tecmint ~ $ sudo dmidecode -t system

# dmidecode 2.12
# SMBIOS entry point at 0xaaebef98
SMBIOS 2.7 present.

Handle 0x0001, DMI type 1, 27 bytes
System Information
	Manufacturer: LENOVO
	Product Name: 20354
	Version: Lenovo Z50-70
	Serial Number: 1037407803441
	UUID: 29D2B1E4-37D2-11E4-9F6E-28D244EBBD98
	Wake-up Type: Power Switch
	SKU Number: LENOVO_MT_20354_BU_idea_FM_Lenovo Z50-70
	Family: IDEAPAD
...

To print information about BIOS, run this command.

tecmint@tecmint ~ $ sudo dmidecode -t bios

# dmidecode 2.12
# SMBIOS entry point at 0xaaebef98
SMBIOS 2.7 present.

Handle 0x0000, DMI type 0, 24 bytes
BIOS Information
	Vendor: LENOVO
	Version: 9BCN26WW
	Release Date: 07/31/2014
	Address: 0xE0000
	Runtime Size: 128 kB
	ROM Size: 4096 kB
	Characteristics:
		PCI is supported
		BIOS is upgradeable
		BIOS shadowing is allowed
		Boot from CD is supported
		Selectable boot is supported
		EDD is supported
		Japanese floppy for NEC 9800 1.2 MB is supported (int 13h)
		Japanese floppy for Toshiba 1.2 MB is supported (int 13h)
		5.25"/360 kB floppy services are supported (int 13h)
		5.25"/1.2 MB floppy services are supported (int 13h)
		3.5"/720 kB floppy services are supported (int 13h)
		3.5"/2.88 MB floppy services are supported (int 13h)
		8042 keyboard services are supported (int 9h)
		CGA/mono video services are supported (int 10h)
		ACPI is supported
		USB legacy is supported
		BIOS boot specification is supported
		Targeted content distribution is supported
		UEFI is supported
	BIOS Revision: 0.26
	Firmware Revision: 0.26
...

To print information about processor, run this command.

tecmint@tecmint ~ $ sudo dmidecode -t processor

# dmidecode 2.12
# SMBIOS entry point at 0xaaebef98
SMBIOS 2.7 present.

Handle 0x0004, DMI type 4, 42 bytes
Processor Information
	Socket Designation: U3E1
	Type: Central Processor
	Family: Core i5
	Manufacturer: Intel(R) Corporation
	ID: 51 06 04 00 FF FB EB BF
	Signature: Type 0, Family 6, Model 69, Stepping 1
	Flags:
...

Summary

There are many other ways you can use to obtain information about your system hardware components. Most of these commands use files in the /proc directory to extract system information.

Source

3 Ways to List All Installed Packages in RHEL, CentOS and Fedora

One of the several duties of a system administrator is to install and manage software on a computer system-Linux in this case and in order keep track of installed/available software packages on your system, you can learn, and/or keep in mind a few quick commands.

In this article, we will explain how to list all installed rpm packages on CentOS, RHEL and Fedora distributions using four different ways.

1. Using RPM Package Manager

RPM (RPM Package Manager) formerly known as Red-Hat Package Manager is an open source, low-level package manager, which runs on Red Hat Enterprise Linux (RHEL) as well as other Linux such as CentOS, Fedora and UNIX systems.

You can compare it to DPKG Package Manager, the default packaging system for Debian and it’s derivatives such as Ubuntu, Kali Linux etc.

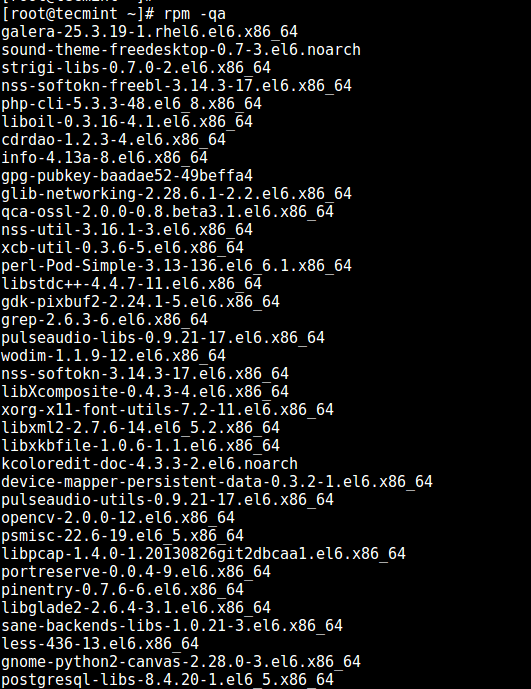
The following command will print a list of all installed packages on your Linux system, the flag -q meaning query and -a enables listing of all installed packages:

# rpm -qa

List All Installed Packages in CentOS

List All Installed Packages in CentOS

2. Using YUM Package Manager

YUM (Yellowdog Updater, Modified) is an interactive, front-end rpm based, package manager.

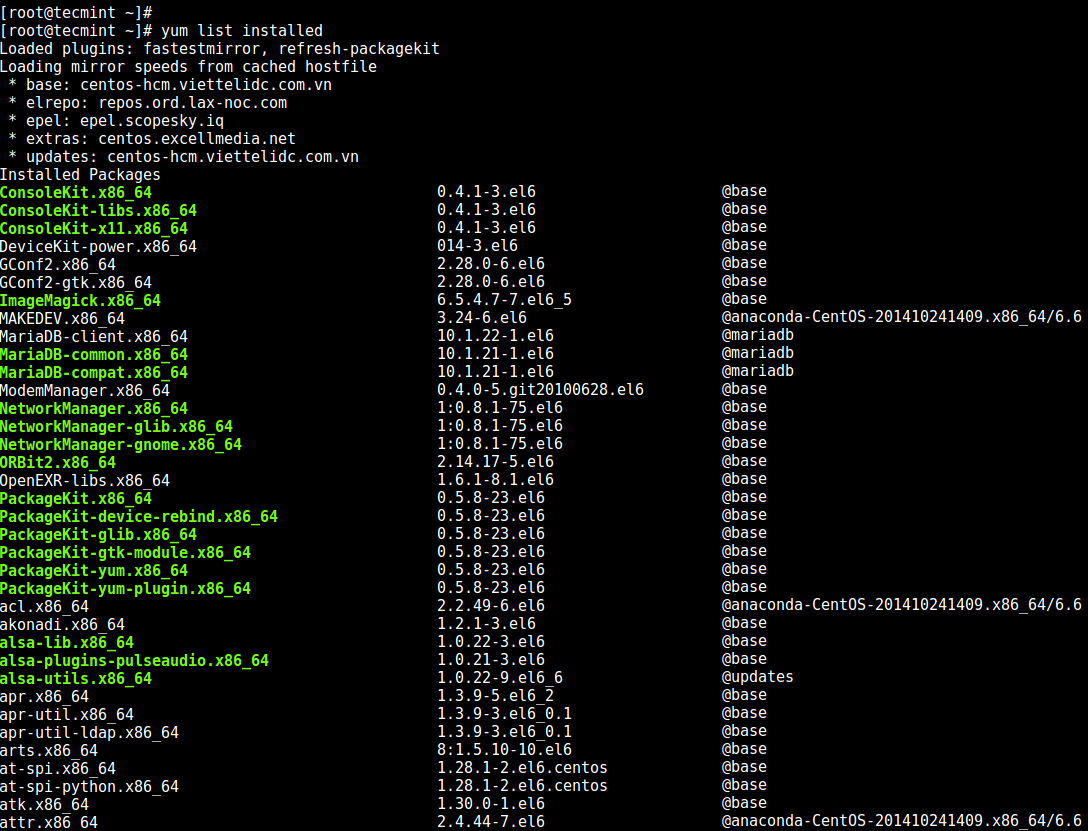
You can use the yum command below to list all installed packages on your system, one advantage with this method is, it includes the repository from which a package was installed:

# yum list installed

Yum - List All Installed Packages

Yum – List All Installed Packages

3. Using YUM-Utils

Yum-utils is an assortment of tools and programs for managing yum repositories, installing debug packages, source packages, extended information from repositories and administration.

To install it, run the command below as root, otherwise, use sudo command:

# yum update && yum install yum-utils

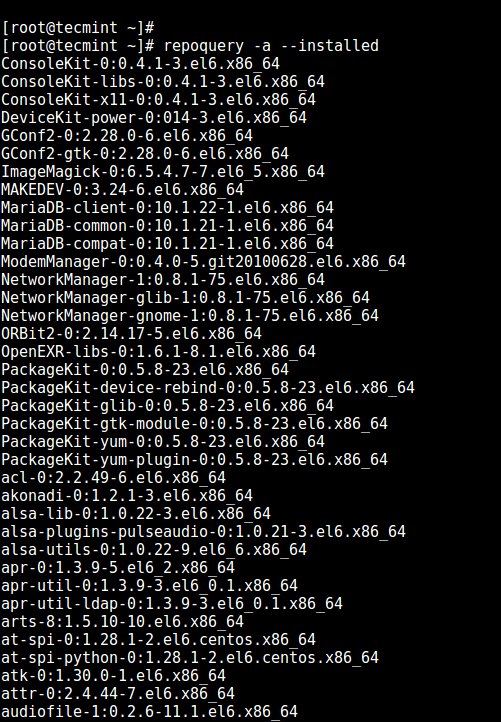
Once you have it installed, type the repoquery command below to list all installed packages on your system:

# repoquery -a --installed 

Repoquery - List All Installed Packages

Repoquery – List All Installed Packages

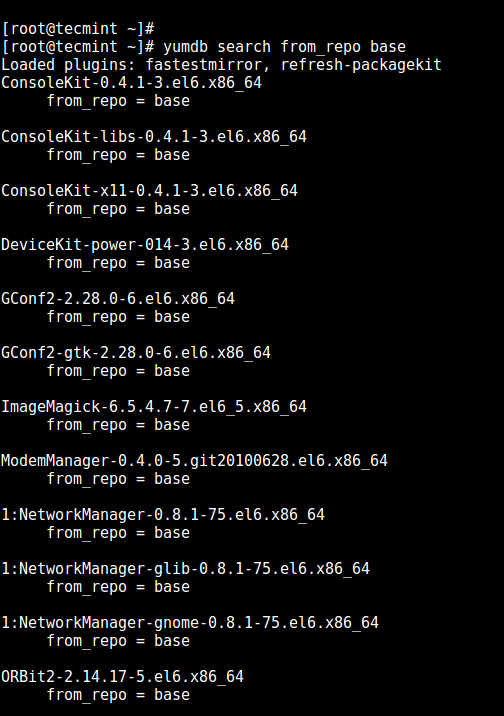
To list installed packages from a particular repository, use the yumdb program in the form below:

# yumdb search from_repo base

List All Installed Packages from Repository

List All Installed Packages from Repository

Read more about package management in Linux:

  1. Linux Package Management with Yum, RPM, Apt, Dpkg, Aptitude and Zypper
  2. 5 Best Linux Package Managers for Linux Newbies
  3. 20 Useful ‘Yum’ Commands for Package Management
  4. 27 ‘DNF’ (Fork of Yum) Commands for RPM Package Management in Fedora

In this article, we showed you how to list all installed packages on CentOS or RHEL four different ways.

Source

How to Add a New Disk to an Existing Linux Server

As system administrators, we would have got requirements wherein we need to configure raw hard disks to the existing servers as part of upgrading server capacity or sometimes disk replacement in case of disk failure.

In this article, I will take you through the steps by which we can add the new raw hard disk to an existing Linux server such as RHEL/CentOS or Debian/Ubuntu.

Suggested Read: How to Add a New Disk Larger Than 2TB to An Existing Linux

Important: Please note that the purpose of this article is to show only how to create a new partition and doesn’t include partition extension or any other switches.

I am using fdisk utility to do this configuration.

I have added a hard disk of 20GB capacity to be mounted as a /data partition.

fdisk is a command line utility to view and manage hard disks and partitions on Linux systems.

# fdisk -l

This will list the current partitions and configurations.

Find Linux Partition Details

Find Linux Partition Details

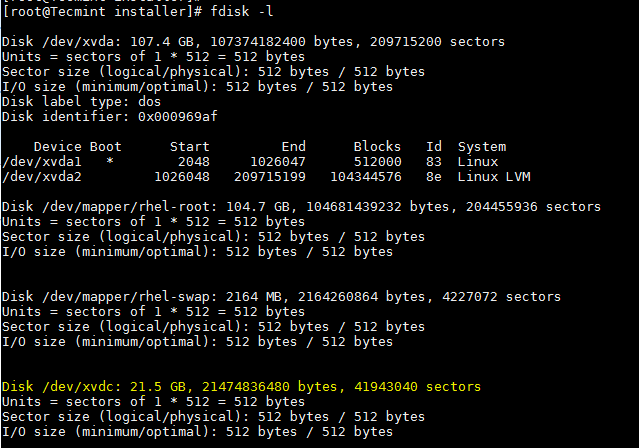
After attaching the hard disk of 20GB capacity, the fdisk -l will give the below output.

# fdisk -l

Find New Partition Details

Find New Partition Details

New disk added is shown as /dev/xvdc. If we are adding physical disk it will show as /dev/sda based of the disk type. Here I used a virtual disk.

To partition a particular hard disk, for example /dev/xvdc.

# fdisk /dev/xvdc

Commonly used fdisk commands.

  • n – Create partition
  • p – print partition table
  • d – delete a partition
  • q – exit without saving the changes
  • w – write the changes and exit.

Here since we are creating a partition use n option.

Create New Partition in Linux

Create New Partition in Linux

Create either primary/extended partitions. By default we can have upto 4 primary partitions.

Create Primary Partition

Create Primary Partition

Give the partition number as desired. Recommended to go for the default value 1.

Assign a Partition Number

Assign a Partition Number

Give the value of the first sector. If it is a new disk, always select default value. If you are creating a second partition on the same disk, we need to add 1 to the last sector of the previous partition.

Assign Sector to Partition

Assign Sector to Partition

Give the value of the last sector or the partition size. Always recommended to give the size of the partition. Always prefix + to avoid value out of range error.

Assign Partition Size

Assign Partition Size

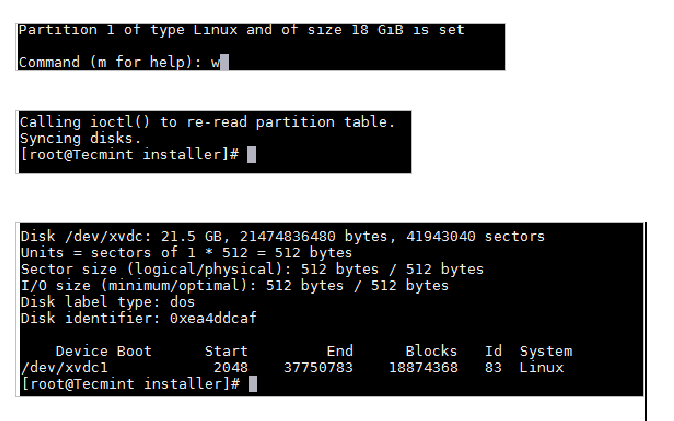
Save the changes and exit.

Save Partition Changes

Save Partition Changes

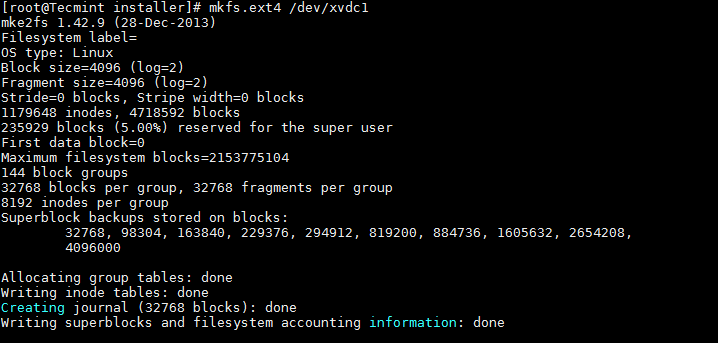
Now format the disk with mkfs command.

# mkfs.ext4 /dev/xvdc1

Format New Partition

Format New Partition

Once formatting has been completed, now mount the partition as shown below.

# mount /dev/xvdc1 /data

Make an entry in /etc/fstab file for permanent mount at boot time.

/dev/xvdc1	/data	ext4	defaults     0   0
Conclusion

Now you know how to partition a raw disk using fdisk command and mount the same.

We need to be extra cautious while working with the partitions especially when you are editing the configured disks.

Source

12 TOP Command Examples in Linux

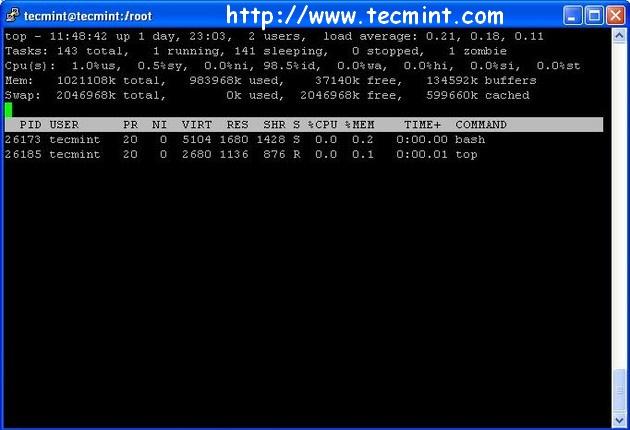
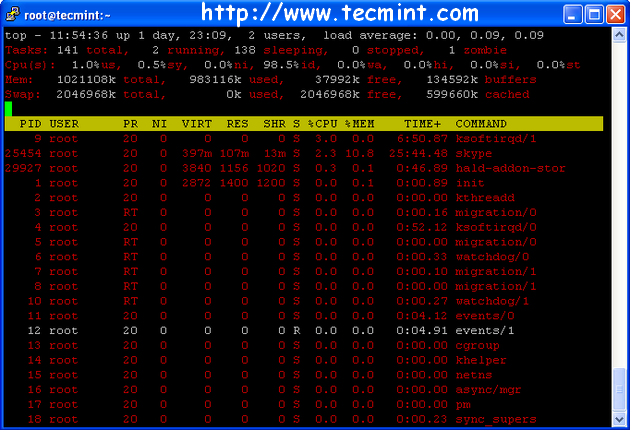
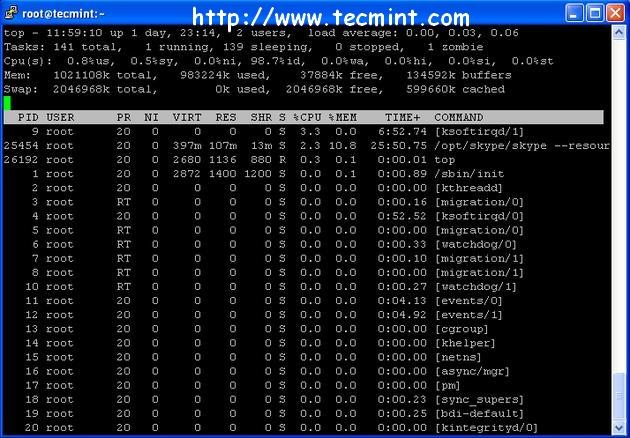
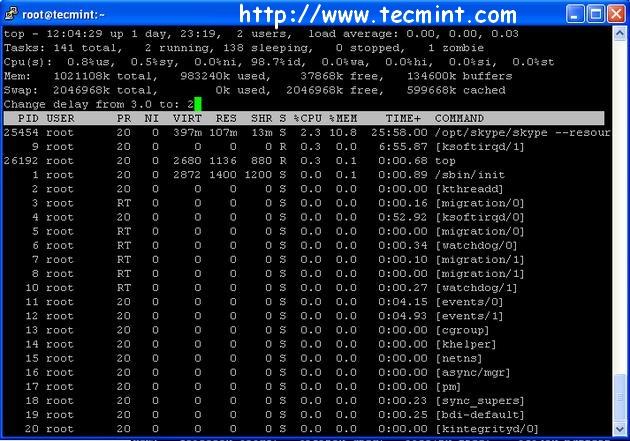
This is the part of our on-going series of commands in Linux. We have covered basic ls command and cat command. In this article, we are trying to explore top command which is one of the most frequently used commands in our daily system administrative jobs. top command displays processor activity of your Linux box and also displays tasks managed by kernel in real-time. It’ll show processor and memory are being used and other information like running processes. This may help you to take correct action. top command found in UNIX-like operating systems.

Linux Top Command Examples

Linux Top Command Examples

You might also be interested in following tutorials :

  1. Htop (Linux Process Monitoring) tool for RHEL, CentOS & Fedora
  2. Iotop (Monitor Linux Disk I/O) in RHEL, CentOS and Fedora

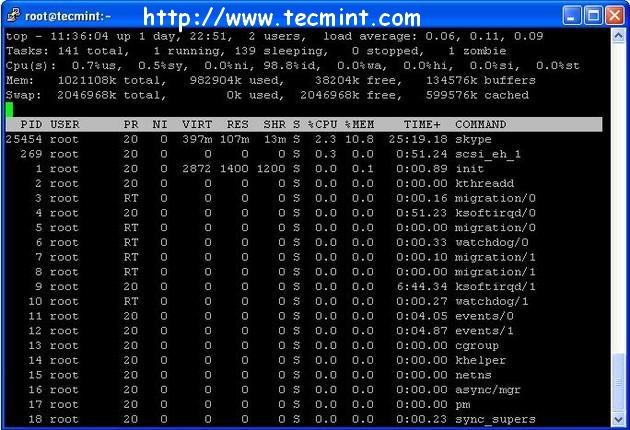
1. Display of Top Command

In this example, it will show information like tasksmemorycpu and swap. Press ‘q‘ to quit window.

# top

Linux Top Command

Linux Top Command

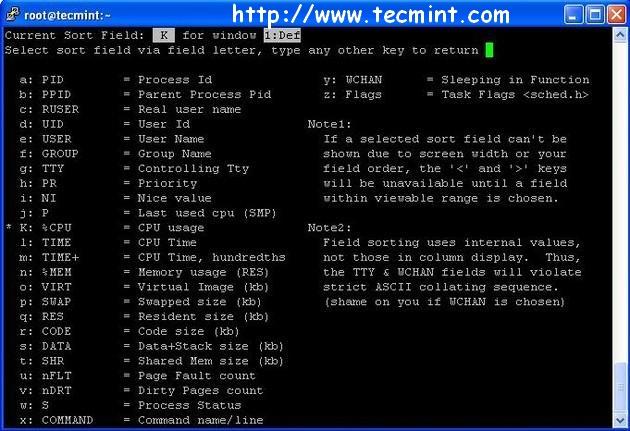
2. Sorting with -O (Uppercase Letter ‘O’).

Press (Shift+O) to Sort field via field letter, for example press ‘a‘ letter to sort process with PID (Process ID).

Sorting Process ID's with Top

Sorting Process ID’s with Top

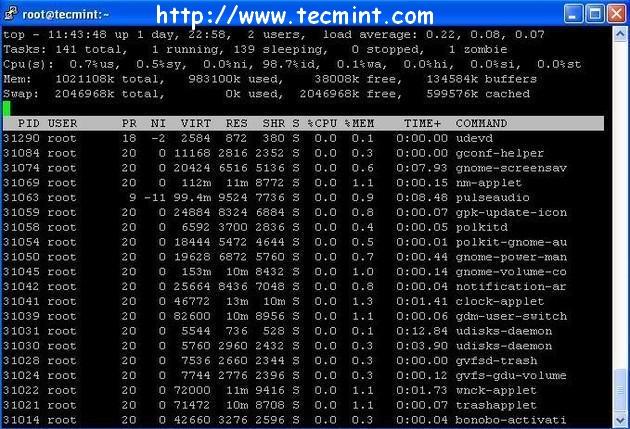
Type any key to return to main top window with sorted PID order as shown in below screen. Press ‘q‘ to quit exit the window.

Sorting Process ID's

Sorting Process ID’s

3. Display Specific User Process

Use top command with ‘u‘ option will display specific User process details.

# top -u tecmint

Top with Specific User Processes

Top with Specific User Processes

4. Highlight Running Process in Top

Press ‘z‘ option in running top command will display running process in color which may help you to identified running process easily.

Top Process with Colorful

Top Process with Colorful

5. Shows Absolute Path of Processes

Press ‘c‘ option in running top command, it will display absolute path of running process.

Top with Specific Process Path

Top with Specific Process Path

6. Change Delay or Set ‘Screen Refresh Interval’ in Top

By default screen refresh interval is 3.0 seconds, same can be change pressing ‘d‘ option in running top command and change it as desired as shown below.

Top - Set Refresh Time

Top – Set Refresh Time

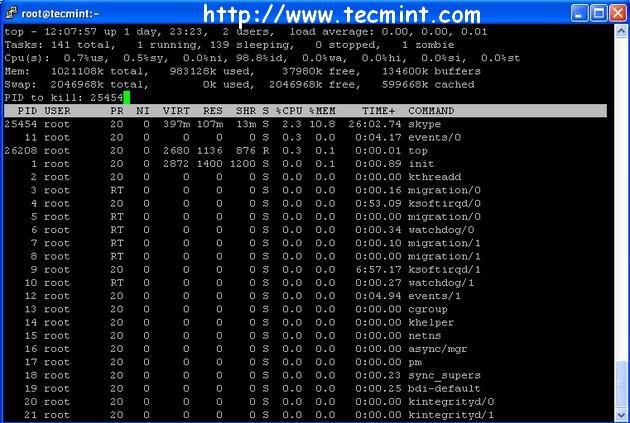
7. Kill running process with argument ‘k’

You can kill a process after finding PID of process by pressing ‘k‘ option in running top command without exiting from top window as shown below.

Top - Kill Process ID

Top – Kill Process ID

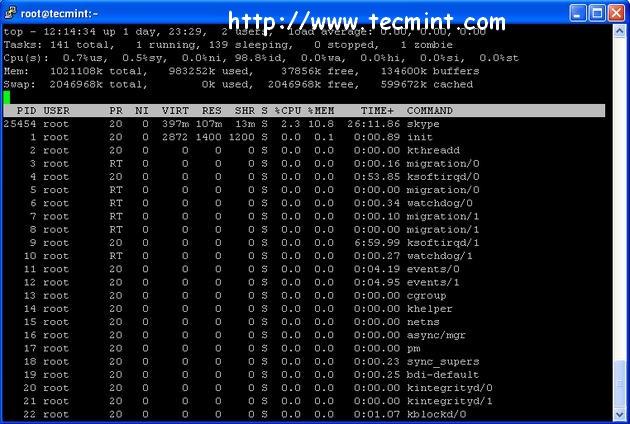
8. Sort by CPU Utilisation

Press (Shift+P) to sort processes as per CPU utilization. See screenshot below.

Top - High CPU Utilization

Top – High CPU Utilization

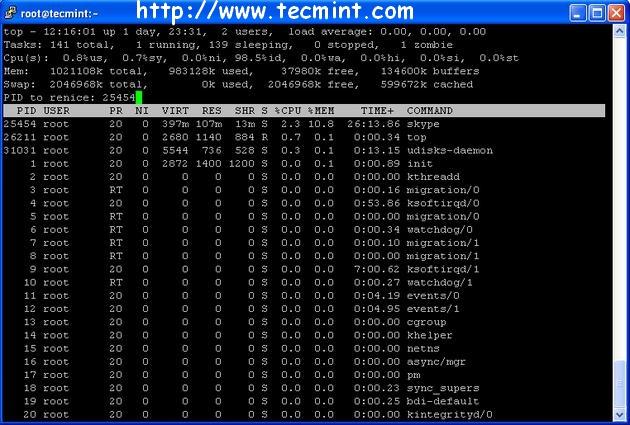
9. Renice a Process

You can use ‘r‘ option to change the priority of the process also called Renice.

Top - Renice Process

Top – Renice Process

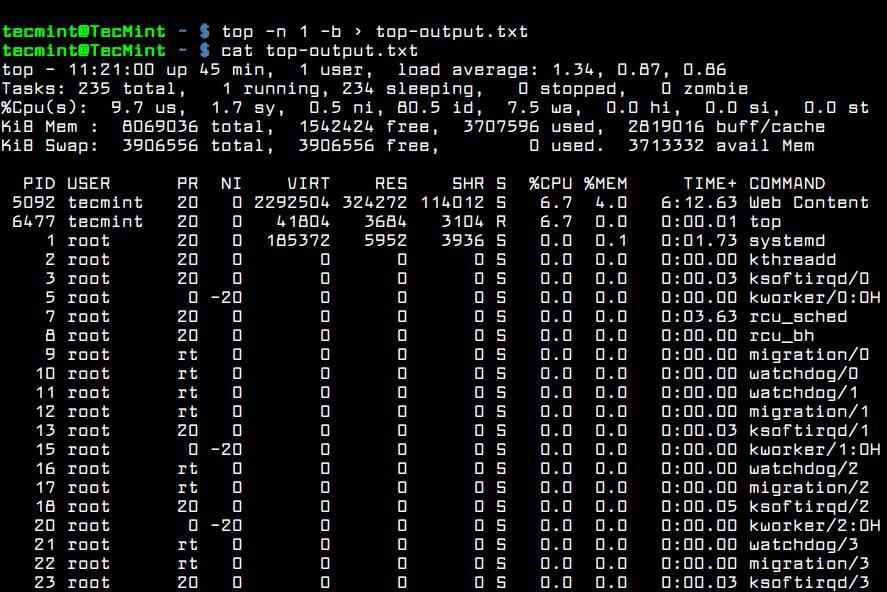
10. Save Top Command Results

To save the running top command results output to a file /root/.toprc use the following command.

# top -n 1 -b > top-output.txt

Top Command Save Results

Top Command Save Results

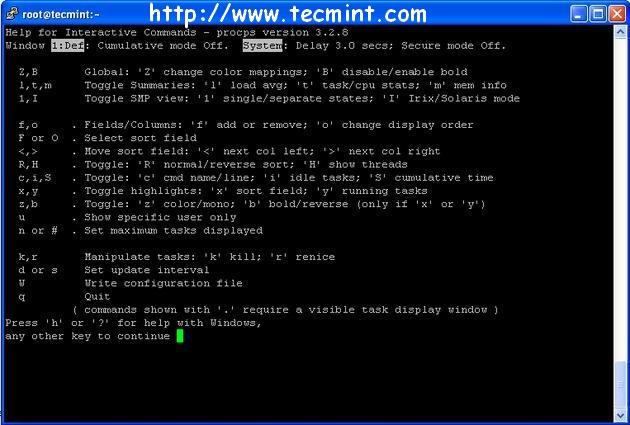
11. Getting Top Command Help

Press ‘h‘ option to obtain the top command help.

Top Command Help

Top Command Help

12. Exit Top Command After Specific repetition

Top output keep refreshing until you press ‘q‘. With below command top command will automatically exit after 10 number of repetition.

# top -n 10

There are number of arguments to know more about top command you may refer man page of top command.

Source

10 Cool Command Line Tools For Your Linux Terminal

In this article, we will share a number of cool command-line programs that you can use in a Linux terminal. By the end of this article, you will learn about some free, open source, and exciting, text-based tools to help you do more with boredom on the Command line.

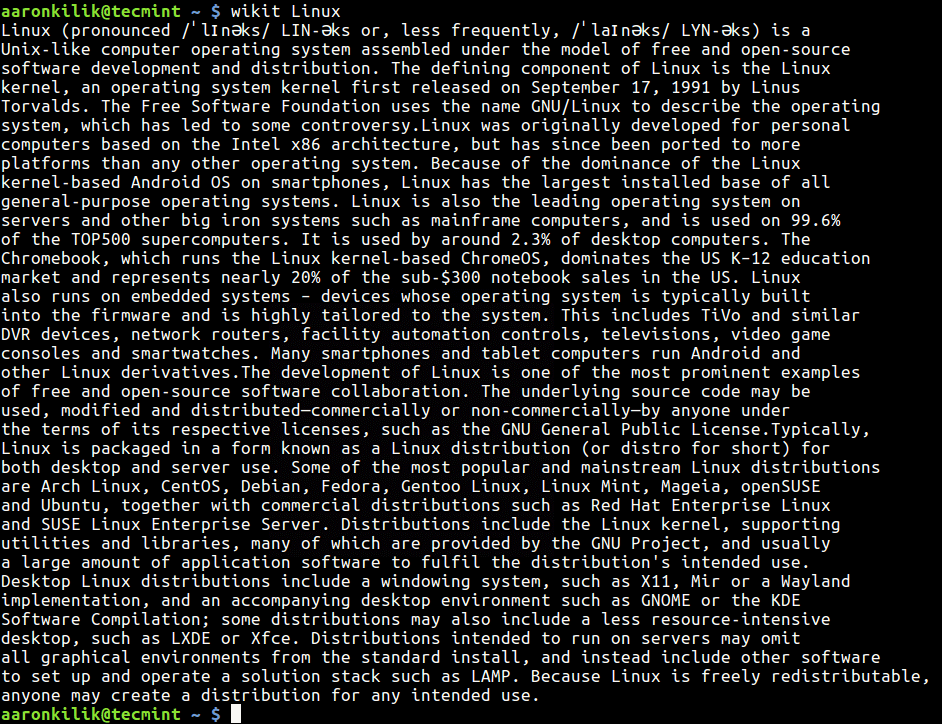
1. Wikit

Wikit is a command line utility to search Wikipedia in Linux. It basically displays Wikipedia summaries. Once you have it installed, simply provide the search term as an argument (for example wikit linux).

Wikipedia Command Line View

Wikipedia Command Line View

2. Googler

Googler is a full-featured Python-based command line tool for accessing Google (Web & News) and Google Site Search within the Linux terminal. It is fast and clean with custom colors and no ads, stray URLs or clutter included. It supports navigation of search result pages from omniprompt.

In addition, it supports fetching of number of results in a go, users can start at the nth result, and supports limiting of search by attributes such as duration, country/domain specific search (default: .com), language preference.

Google Search from Linux Terminal

Google Search from Linux Terminal

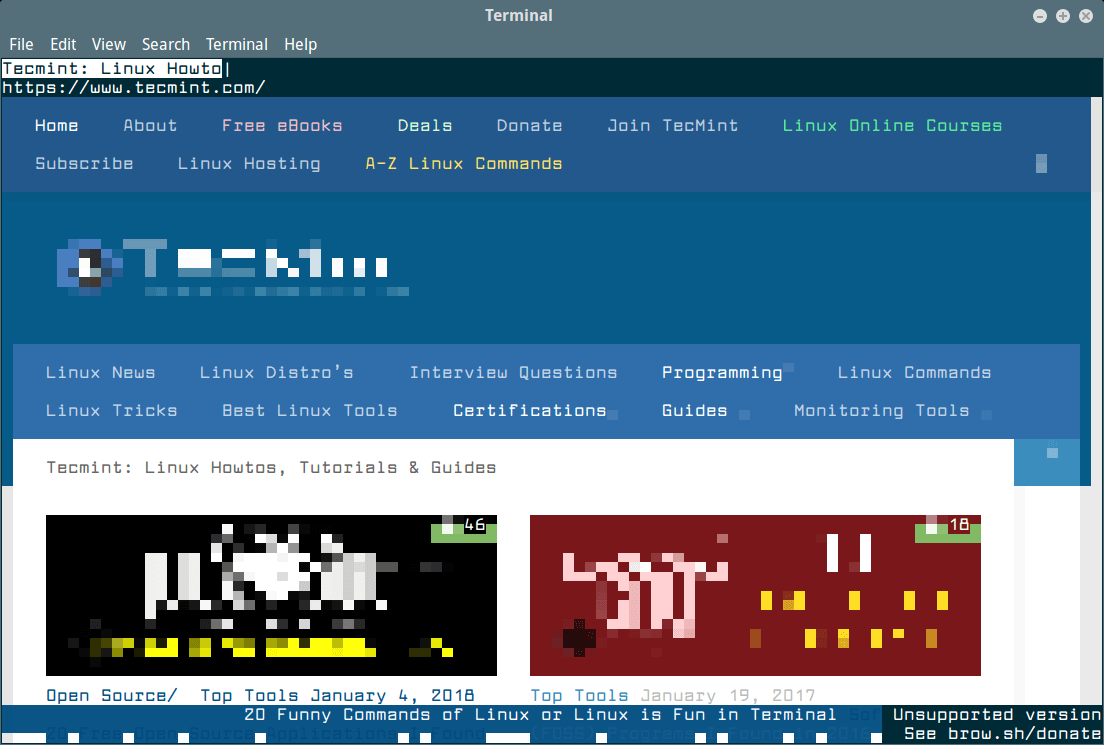
3. Browsh

Browsh is a small, modern text based browser that play videos and render anything that a modern browser can, in TTY terminal environments.

It supports HTML5, CSS3, JS, video as well as WebGL. It is a bandwidth-saver, designed to run on a remote server and accessed via SSH/Mosh or the in-browser HTML service so as to notably reduce bandwidth.

It is practically useful when you don’t have good Internet connection.

Browsh Web Browsing

Browsh Web Browsing

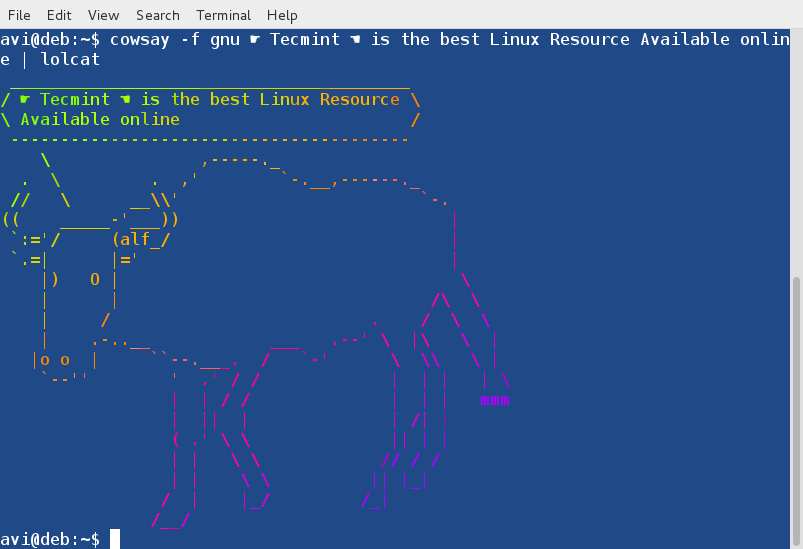
4. Lolcat

Lolcat is a command-line program to output rainbow of colors in the Linux terminal. It concatenates the output of a command in a similar way as cat command and adds rainbow coloring to the final output.

To use lolcat, simply pipe the output of any command to lolcat.

Cowsay with Lolcat

Cowsay with Lolcat

5. Boxes

Boxes is a configurable program and text filter which can draw ASCII art boxes around its input text in a Linux terminal. It comes with a number of pre-configured box designs in example config file. It comes with several command-line options and supports regular expression substitutions on input text.

You can use it to: draws ASCII art boxes and shapes, generate regional comments in source code and more.

Boxes - Draw ASCII Art in Terminal

Boxes – Draw ASCII Art in Terminal

6. Figlet and Toilet

FIGlet is a useful command-line utility for creating ASCII text banners or large letters out of ordinary text. Toiletis a sub-command under figlet for creating colorful large characters from ordinary text.

Figlet - Create ASCII Text Banners in Terminal

Figlet – Create ASCII Text Banners in Terminal

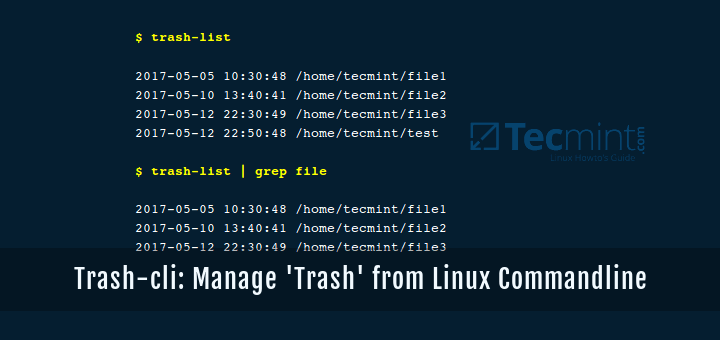
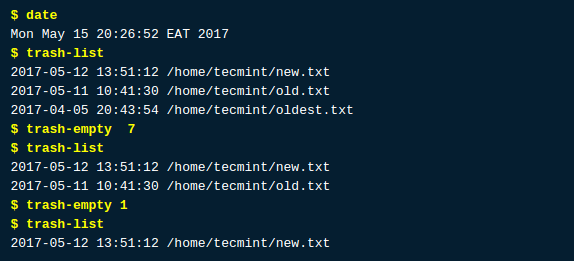
7. Trash-cli

Trash-cli is a program that trashes files recording the original path, deletion date, and permissions. It is an interface to the freedesktop.org trashcan.

Manage ‘Trash’ from Linux Command Line

Manage ‘Trash’ from Linux Command Line

Trash-cli – A Trashcan Tool

Trash-cli – A Trashcan Tool

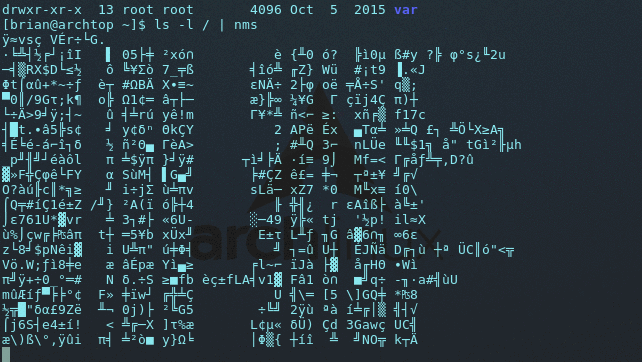
8. No More Secrets

No More Secrets is a text-based program recreates the famous data decryption effect seen in the 1992 movie Sneakers. It provides a command-line utility called nms, that you can use in a similar way as lolcat – simply pipe the out of another command to nms, and see the magic.

No More Secrets - Recreates Data Decryption Effect

No More Secrets – Recreates Data Decryption Effect

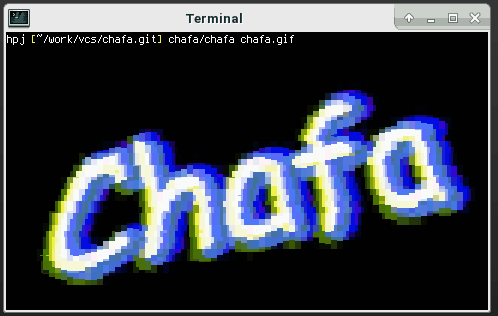
9. Chafa

Chafa is a another cool, fast and highly configurable terminal program that provides terminal graphics for the 21st century.

It works with most modern and classic terminals and terminal emulators. It converts all types of images (including animated GIFs), into ANSI/Unicode character output that can be displayed in a terminal.

Chafa supports for alpha transparency and multiple color modes (including Truecolor, 256-color, 16-color and simple FG/BG.) and color spaces, combining selectable ranges of Unicode characters to produce the desired output.

It is suitable for terminal graphics, ANSI art composition as well as even black and white print.

Chafa - Converts to ANSI Unicode Character

Chafa – Converts to ANSI Unicode Character

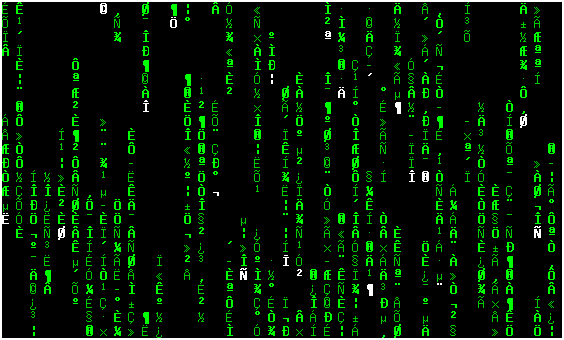
10. CMatrix

CMatrix is a simple command-line utility that shows a scrolling ‘Matrix‘ like screen in a Linux terminal.

It displays random text flying in and out in a terminal, in a similar way as seen in popular Sci-fi movie “The Matrix“. It can scroll lines all at the same rate or asynchronously and at a user-defined speed. One downside of Cmatrix is that it is very CPU intensive.

The Matrix in Linux Terminal

The Matrix in Linux Terminal

Here you have seen few cool command-line tools, but there is plenty more to explore. If you want to know more about such cool or funny Linux command-line tools, you can checkout our guides here:

  1. 20 Funny Commands for Your Linux Terminal
  2. 6 Interesting Funny Commands for Your Linux Terminal
  3. 10 Mysterious Commands for Your Linux Terminal
  4. 51 Useful Lesser Known Linux Commands

That’s all!

Source

10 Useful Chaining Operators in Linux with Practical Examples

Chaining of Linux commands means, combining several commands and make them execute based upon the behaviour of operator used in between them. Chaining of commands in Linux, is something like you are writing short shell scripts at the shell itself, and executing them from the terminal directly. Chaining makes it possible to automate the process. Moreover, an unattended machine can function in a much systematic way with the help of chaining operators.

Chaining Operators in Linux

10 Chaining Operators in Linux

Read Also: How to Use Awk and Regular Expressions to Filter Text in Files

This Article aims at throwing light on frequently used command­-chaining operators, with short descriptions and corresponding examples which surely will increase your productivity and lets you write short and meaningful codes beside reducing system load, at times.

1. Ampersand Operator (&)

The function of ‘&‘ is to make the command run in background. Just type the command followed with a white space and ‘&‘. You can execute more than one command in the background, in a single go.

Run one command in the background:

tecmint@localhost:~$ ping ­c5 www.tecmint.com &

Run two command in background, simultaneously:

root@localhost:/home/tecmint# apt-get update & apt-get upgrade &

2. semi-colon Operator (;)

The semi-colon operator makes it possible to run, several commands in a single go and the execution of command occurs sequentially.

root@localhost:/home/tecmint# apt-get update ; apt-get upgrade ; mkdir test

The above command combination will first execute update instruction, then upgrade instruction and finally will create a ‘test‘ directory under the current working directory.

3. AND Operator (&&)

The AND Operator (&&) would execute the second command only, if the execution of first command SUCCEEDS, i.e., the exit status of the first command is 0. This command is very useful in checking the execution status of last command.

For example, I want to visit website tecmint.com using links command, in terminal but before that I need to check if the host is live or not.

root@localhost:/home/tecmint# ping -c3 www.tecmint.com && links www.tecmint.com

4. OR Operator (||)

The OR Operator (||) is much like an ‘else‘ statement in programming. The above operator allow you to execute second command only if the execution of first command fails, i.e., the exit status of first command is ‘1‘.

For example, I want to execute ‘apt-get update‘ from non-root account and if the first command fails, then the second ‘links www.tecmint.com‘ command will execute.

tecmint@localhost:~$ apt-get update || links tecmint.com

In the above command, since the user was not allowed to update system, it means that the exit status of first command is ‘1’ and hence the last command ‘links tecmint.com‘ gets executed.

What if the first command is executed successfully, with an exit status ‘0‘? Obviously! Second command won’t execute.

tecmint@localhost:~$ mkdir test || links tecmint.com

Here, the user creates a folder ‘test‘ in his home directory, for which user is permitted. The command executed successfully giving an exit status ‘0‘ and hence the last part of the command is not executed.

5. NOT Operator (!)

The NOT Operator (!) is much like an ‘except‘ statement. This command will execute all except the condition provided. To understand this, create a directory ‘tecmint‘ in your home directory and ‘cd‘ to it.

tecmint@localhost:~$ mkdir tecmint 
tecmint@localhost:~$ cd tecmint

Next, create several types of files in the folder ‘tecmint‘.

tecmint@localhost:~/tecmint$ touch a.doc b.doc a.pdf b.pdf a.xml b.xml a.html b.html

See we’ve created all the new files within the folder ‘tecmint‘.

tecmint@localhost:~/tecmint$ ls 

a.doc  a.html  a.pdf  a.xml  b.doc  b.html  b.pdf  b.xml

Now delete all the files except ‘html‘ file all at once, in a smart way.

tecmint@localhost:~/tecmint$ rm -r !(*.html)

Just to verify, last execution. List all of the available files using ls command.

tecmint@localhost:~/tecmint$ ls a.html  b.html

6. AND – OR operator (&& – ||)

The above operator is actually a combination of ‘AND‘ and ‘OR‘ Operator. It is much like an ‘if-else‘ statement.

For example, let’s do ping to tecmint.com, if success echo ‘Verified‘ else echo ‘Host Down‘.

tecmint@localhost:~/tecmint$ ping -c3 www.tecmint.com && echo "Verified" || echo "Host Down"
Sample Output
PING www.tecmint.com (212.71.234.61) 56(84) bytes of data. 
64 bytes from www.tecmint.com (212.71.234.61): icmp_req=1 ttl=55 time=216 ms 
64 bytes from www.tecmint.com (212.71.234.61): icmp_req=2 ttl=55 time=224 ms 
64 bytes from www.tecmint.com (212.71.234.61): icmp_req=3 ttl=55 time=226 ms 

--- www.tecmint.com ping statistics --- 
3 packets transmitted, 3 received, 0% packet loss, time 2001ms 
rtt min/avg/max/mdev = 216.960/222.789/226.423/4.199 ms 
Verified

Now, disconnect your internet connection, and try same command again.

tecmint@localhost:~/tecmint$ ping -c3 www.tecmint.com && echo "verified" || echo "Host Down"
Sample Output
ping: unknown host www.tecmint.com 
Host Down

7. PIPE Operator (|)

This PIPE operator is very useful where the output of first command acts as an input to the second command. For example, pipeline the output of ‘ls -l‘ to ‘less‘ and see the output of the command.

tecmint@localhost:~$ ls -l | less

8. Command Combination Operator {}

Combine two or more commands, the second command depends upon the execution of the first command.

For example, check if a directory ‘bin‘ is available or not, and output corresponding output.

tecmint@localhost:~$ [ -d bin ] || { echo Directory does not exist, creating directory now.; mkdir bin; } && echo Directory exists.

9. Precedence Operator ()

The Operator makes it possible to execute command in precedence order.

Command_x1 &&Command_x2 || Command_x3 && Command_x4.

In the above pseudo command, what if the Command_x1 fails? Neither of the Command_x2Command_x3Command_x4 would executed, for this we use Precedence Operator, as:

(Command_x1 &&Command_x2) || (Command_x3 && Command_x4)

In the above pseudo command, if Command_x1 fails, Command_x2 also fails but Still Command_x3 and Command_x4 executes depends upon exit status of Command_x3.

10. Concatenation Operator (\)

The Concatenation Operator (\) as the name specifies, is used to concatenate large commands over several lines in the shell. For example, The below command will open text file test(1).txt.

tecmint@localhost:~/Downloads$ nano test\(1\).txt

Source

Linux Performance Monitoring with Vmstat and Iostat Commands

This is our on-going series of commands and performance monitoring in LinuxVmstat and Iostat both commands are available on all major Unix-like (Linux/Unix/FreeBSD/Solaris) Operating Systems.

If vmstat and iostat commands are not available on your box, please install sysstat package. The vmstatsarand iostat commands are the collection of package included in sysstat – the system monitoring tools. The iostat generates reports of CPU & all device statistics. You may download and install sysstat using source tarball from link sysstat, but we recommend installing through YUM command.

Linux Vmstat and Iostat Commands

Linux Performance Monitoring with Vmstat and Iostat

Install Sysstat in Linux

# yum -y install sysstat
  1. vmstat – Summary information of MemoryProcessesPaging etc.
  2. iostat – Central Processing Unit (CPU) statistics and input/output statistics for devices and partitions.
6 Vmstat Command Examples in Linux

1. List Active and Inactive Memory

In the below example, there are six columns. The significant of the columns are explained in man page of vmstat in details. Most important fields are free under memory and si, so under swap column.

[root@tecmint ~]# vmstat -a

procs -----------memory---------- ---swap-- -----io---- --system-- -----cpu-----
 r  b   swpd   free  inact active   si   so    bi    bo   in   cs us sy id wa st
 1  0      0 810420  97380  70628    0    0   115     4   89   79  1  6 90  3  0
    1. Free – Amount of free/idle memory spaces.
    2. si – Swaped in every second from disk in Kilo Bytes.
    3. so – Swaped out every second to disk in Kilo Bytes.

Note: If you run vmstat without parameters it’ll displays summary report since system boot.

2. Execute vmstat ‘X’ seconds and (‘N’number of times)

With this command, vmstat execute every two seconds and stop automatically after executing six intervals.

[root@tecmint ~]# vmstat 2 6

procs -----------memory---------- ---swap-- -----io---- --system-- -----cpu-----
 r  b   swpd   free   buff  cache   si   so    bi    bo   in   cs us sy id wa st
 0  0      0 810420  22064 101368    0    0    56     3   50   57  0  3 95  2  0
 0  0      0 810412  22064 101368    0    0     0     0   16   35  0  0 100  0  0
 0  0      0 810412  22064 101368    0    0     0     0   14   35  0  0 100  0  0
 0  0      0 810412  22064 101368    0    0     0     0   17   38  0  0 100  0  0
 0  0      0 810412  22064 101368    0    0     0     0   17   35  0  0 100  0  0
 0  0      0 810412  22064 101368    0    0     0     0   18   36  0  1 100  0  0

3. Vmstat with timestamps

vmstat command with -t parameter shows timestamps with every line printed as shown below.

[tecmint@tecmint ~]$ vmstat -t 1 5

procs -----------memory---------- ---swap-- -----io---- --system-- -----cpu------ ---timestamp---
 r  b   swpd   free   buff  cache   si   so    bi    bo   in   cs us sy id wa st
 0  0      0 632028  24992 192244    0    0    70     5   55   78  1  3 95  1  0        2012-09-02 14:57:18 IST
 1  0      0 632028  24992 192244    0    0     0     0  171  514  1  5 94  0  0        2012-09-02 14:57:19 IST
 1  0      0 631904  24992 192244    0    0     0     0  195  600  0  5 95  0  0        2012-09-02 14:57:20 IST
 0  0      0 631780  24992 192244    0    0     0     0  156  524  0  5 95  0  0        2012-09-02 14:57:21 IST
 1  0      0 631656  24992 192244    0    0     0     0  189  592  0  5 95  0  0        2012-09-02 14:57:22 IST

4. Statistics of Various Counter

vmstat command and -s switch displays summary of various event counters and memory statistics.

[tecmint@tecmint ~]$ vmstat -s

      1030800  total memory
       524656  used memory
       277784  active memory
       185920  inactive memory
       506144  free memory
        26864  buffer memory
       310104  swap cache
      2064376  total swap
            0  used swap
      2064376  free swap
         4539 non-nice user cpu ticks
            0 nice user cpu ticks
        11569 system cpu ticks
       329608 idle cpu ticks
         5012 IO-wait cpu ticks
           79 IRQ cpu ticks
           74 softirq cpu ticks
            0 stolen cpu ticks
       336038 pages paged in
        67945 pages paged out
            0 pages swapped in
            0 pages swapped out
       258526 interrupts
       392439 CPU context switches
   1346574857 boot time
         2309 forks

5. Disks Statistics

vmstat with -d option display all disks statistics.

[tecmint@tecmint ~]$ vmstat -d

disk- ------------reads------------ ------------writes----------- -----IO------
       total merged sectors      ms  total merged sectors      ms    cur    sec
ram0       0      0       0       0      0      0       0       0      0      0
ram1       0      0       0       0      0      0       0       0      0      0
ram2       0      0       0       0      0      0       0       0      0      0
ram3       0      0       0       0      0      0       0       0      0      0
ram4       0      0       0       0      0      0       0       0      0      0
ram5       0      0       0       0      0      0       0       0      0      0
ram6       0      0       0       0      0      0       0       0      0      0
ram7       0      0       0       0      0      0       0       0      0      0
ram8       0      0       0       0      0      0       0       0      0      0
ram9       0      0       0       0      0      0       0       0      0      0
ram10      0      0       0       0      0      0       0       0      0      0
ram11      0      0       0       0      0      0       0       0      0      0
ram12      0      0       0       0      0      0       0       0      0      0
ram13      0      0       0       0      0      0       0       0      0      0
ram14      0      0       0       0      0      0       0       0      0      0
ram15      0      0       0       0      0      0       0       0      0      0
loop0      0      0       0       0      0      0       0       0      0      0
loop1      0      0       0       0      0      0       0       0      0      0
loop2      0      0       0       0      0      0       0       0      0      0
loop3      0      0       0       0      0      0       0       0      0      0
loop4      0      0       0       0      0      0       0       0      0      0
loop5      0      0       0       0      0      0       0       0      0      0
loop6      0      0       0       0      0      0       0       0      0      0
loop7      0      0       0       0      0      0       0       0      0      0
sr0        0      0       0       0      0      0       0       0      0      0
sda     7712   5145  668732  409619   3282  28884  257402  644566      0    126
dm-0   11578      0  659242 1113017  32163      0  257384 8460026      0    126
dm-1     324      0    2592    3845      0      0       0       0      0      2

6. Display Statistics in Megabytes

The vmstat displays in Megabytes with parameters -S and M(Uppercase & megabytes). By default vmstatdisplays statistics in kilobytes.

[root@tecmint ~]# vmstat -S M 1 5

procs -----------memory---------- ---swap-- -----io---- --system-- -----cpu-----
 r  b   swpd   free   buff  cache   si   so    bi    bo   in   cs us sy id wa st
 0  0      0    346     53    476    0    0    95     8   42   55  0  2 96  2  0
 0  0      0    346     53    476    0    0     0     0   12   15  0  0 100  0  0
 0  0      0    346     53    476    0    0     0     0   32   62  0  0 100  0  0
 0  0      0    346     53    476    0    0     0     0   15   13  0  0 100  0  0
 0  0      0    346     53    476    0    0     0     0   34   61  0  1 99  0  0
6 Iostat Command Examples in Linux

7. Display CPU and I/O statistics

iostat without arguments displays CPU and I/O statistics of all partitions as shown below.

[root@tecmint ~]# iostat

Linux 2.6.32-279.el6.i686 (tecmint.com)         09/03/2012      _i686_  (1 CPU)

avg-cpu:  %user   %nice %system %iowait  %steal   %idle
           0.12    0.01    1.54    2.08    0.00   96.24

Device:            tps   Blk_read/s   Blk_wrtn/s   Blk_read   Blk_wrtn
sda               3.59       161.02        13.48    1086002      90882
dm-0              5.76       159.71        13.47    1077154      90864
dm-1              0.05         0.38         0.00       2576          0

8. Shows only CPU Statistics

iostat with -c arguments displays only CPU statistics as shown below.

[root@tecmint ~]# iostat -c

Linux 2.6.32-279.el6.i686 (tecmint.com)         09/03/2012      _i686_  (1 CPU)

avg-cpu:  %user   %nice %system %iowait  %steal   %idle
           0.12    0.01    1.47    1.98    0.00   96.42

9. Shows only Disks I/O Statistics

iostat with -d arguments displays only disks I/O statistics of all partitions as shown.

[root@tecmint ~]# iostat -d

Linux 2.6.32-279.el6.i686 (tecmint.com)         09/03/2012      _i686_  (1 CPU)

Device:            tps   Blk_read/s   Blk_wrtn/s   Blk_read   Blk_wrtn
sda               3.35       149.81        12.66    1086002      91746
dm-0              5.37       148.59        12.65    1077154      91728
dm-1              0.04         0.36         0.00       2576          0

10. Shows I/O statistics only of a single device.

By default it displays statistics of all partitions, with -p and device name arguments displays only disks I/Ostatistics for specific device only as shown.

[root@tecmint ~]# iostat -p sda

Linux 2.6.32-279.el6.i686 (tecmint.com)         09/03/2012      _i686_  (1 CPU)

avg-cpu:  %user   %nice %system %iowait  %steal   %idle
           0.11    0.01    1.44    1.92    0.00   96.52

Device:            tps   Blk_read/s   Blk_wrtn/s   Blk_read   Blk_wrtn
sda               3.32       148.52        12.55    1086002      91770
sda1              0.07         0.56         0.00       4120         18
sda2              3.22       147.79        12.55    1080650      91752

11. Display LVM Statistics

With -N (Uppercase) parameter displays only LVM statistics as shown.

[root@tecmint ~]# iostat -N

Linux 2.6.32-279.el6.i686 (tecmint.com)         09/03/2012      _i686_  (1 CPU)

avg-cpu:  %user   %nice %system %iowait  %steal   %idle
           0.11    0.01    1.39    1.85    0.00   96.64

Device:            tps   Blk_read/s   Blk_wrtn/s   Blk_read   Blk_wrtn
sda               3.20       142.84        12.16    1086002      92466
vg_tecmint-lv_root     5.13       141.68        12.16    1077154      92448
vg_tecmint-lv_swap     0.04         0.34         0.00       2576          0

12. iostat version.

With -V (Uppercase) parameter displays version of iostat as shown.

[root@tecmint ~]# iostat -V

sysstat version 9.0.4
(C) Sebastien Godard (sysstat  orange.fr)

Note: vmstat and iostat contains number of columns and flags which may not possible to explain in details. If you want to know more about it you may refer man page of vmstat and iostat. Please share it if you find this article is useful through our comment box below.

Source

Inxi – A Powerful Feature-Rich Commandline System Information Tool for Linux

Inxi is a powerful and remarkable command line-system information script designed for both console and IRC(Internet Relay Chat). It can be employed to instantly deduce user system configuration and hardware information, and also functions as a debugging, and forum technical support tool.

It displays handy information concerning system hardware (hard disk, sound cards, graphic card, network cards, CPU, RAM, and more), together with system information about drivers, Xorg, desktop environment, kernel, GCC version(s), processes, uptime, memory, and a wide array of other useful information.

However, it’s output slightly differs between the command line and IRC, with a few default filters and color options applicable to IRC usage. The supported IRC clients include: BitchX, Gaim/Pidgin, ircII, Irssi, Konversation, Kopete, KSirc, KVIrc, Weechat, and Xchat plus any others that are capable of showing either built in or external Inxi output.

How to Install Inxi in Linux System

Inix is available in most mainstream Linux distribution repositories, and runs on BSDs as well.

$ sudo apt-get install inxi   [On Debian/Ubuntu/Linux Mint]
$ sudo yum install inxi       [On CentOs/RHEL/Fedora]
$ sudo dnf install inxi       [On Fedora 22+]

Before we start using it, we can run the command that follows to check all application dependencies plus recommends, and various directories, and display what package(s) we need to install to add support for a given feature.

$ inxi --recommends 
Inxi Checking
inxi will now begin checking for the programs it needs to operate. First a check of the main languages and tools
inxi uses. Python is only for debugging data collection.
---------------------------------------------------------------------------
Bash version: 4.3.42(1)-release
Gawk version: 4.1.3,
Sed version: 
Sudo version: 1.8.16
Python version: 2.7.12
---------------------------------------------------------------------------
Test One: Required System Directories (Linux Only).
If one of these system directories is missing, inxi cannot operate:

/proc....................................................................... Present
/sys........................................................................ Present

All the  directories are present.
---------------------------------------------------------------------------
Test Two: Required Core Applications.
If one of these applications is missing, inxi cannot operate:

df (info: partition data)................................................... /bin/df
gawk (info: core tool)...................................................... /usr/bin/gawk
grep (info: string search).................................................. /bin/grep
lspci (info: hardware data)................................................. /usr/bin/lspci
ps (info: process data)..................................................... /bin/ps
readlink.................................................................... /bin/readlink
sed (info: string replace).................................................. /bin/sed
tr (info: character replace)................................................ /usr/bin/tr
uname (info: kernel data)................................................... /bin/uname
wc (info: word character count)............................................. /usr/bin/wc

All the  applications are present.
---------------------------------------------------------------------------
Test Three: Script Recommends for Graphics Features.
NOTE: If you do not use X these do not matter (like a headless server). Otherwise, if one of these applications
is missing, inxi will have incomplete output:

glxinfo (info: -G glx info)................................................. /usr/bin/glxinfo
xdpyinfo (info: -G multi screen resolution)................................. /usr/bin/xdpyinfo
xprop (info: -S desktop data)............................................... /usr/bin/xprop
xrandr (info: -G single screen resolution).................................. /usr/bin/xrandr

All the  applications are present.
---------------------------------------------------------------------------
Test Four: Script Recommends for Remaining Features.
If one of these applications is missing, inxi will have incomplete output:

dig (info: -i first wlan ip default test)................................... /usr/bin/dig
dmidecode (info: -M if no sys machine data; -m memory)...................... /usr/sbin/dmidecode
file (info: -o unmounted file system)....................................... /usr/bin/file
hciconfig (info: -n -i bluetooth data)...................................... /bin/hciconfig
hddtemp (info: -Dx show hdd temp)........................................... /usr/sbin/hddtemp
ifconfig (info: -i ip lan-deprecated)....................................... /sbin/ifconfig
ip (info: -i ip lan)........................................................ /sbin/ip
sensors (info: -s sensors output)........................................... /usr/bin/sensors
strings (info: -I sysvinit version)......................................... /usr/bin/strings
lsusb (info: -A usb audio;-N usb networking)................................ /usr/bin/lsusb
modinfo (info: -Ax,-Nx module version)...................................... /sbin/modinfo
runlevel (info: -I runlevel)................................................ /sbin/runlevel
sudo (info: -Dx hddtemp-user;-o file-user).................................. /usr/bin/sudo
uptime (info: -I uptime (check which package owns Debian)).................. /usr/bin/uptime

All the  applications are present.
---------------------------------------------------------------------------
Test Five: Script Recommends for Remaining Features.
One of these downloaders needed for options -i/-w/-W (-U/-! [11-15], if supported):

wget (info: -i wan ip;-w/-W;-U/-! [11-15] (if supported))................... /usr/bin/wget
curl (info: -i wan ip;-w/-W;-U/-! [11-15] (if supported))................... /usr/bin/curl

All the  applications are present.
---------------------------------------------------------------------------
Test Six: System Directories for Various Information.
(Unless otherwise noted, these are for GNU/Linux systems)
If one of these directories is missing, inxi may have incomplete output:

/sys/class/dmi/id (info: -M system, motherboard, bios)...................... Present
/dev (info: -l,-u,-o,-p,-P,-D disk partition data).......................... Present
/dev/disk/by-label (info: -l,-o,-p,-P partition labels)..................... Present
/dev/disk/by-uuid (info: -u,-o,-p,-P partition uuid)........................ Present

All the  directories are present.
---------------------------------------------------------------------------
Test Seven: System Files for Various Information.
(Unless otherwise noted, these are for GNU/Linux systems)
If one of these files is missing, inxi may have incomplete output:

/proc/asound/cards (info: -A sound card data)............................... Present
/proc/asound/version (info: -A ALSA data)................................... Present
/proc/cpuinfo (info: -C cpu data)........................................... Present
/etc/lsb-release (info: -S distro version data [deprecated])................ Present
/proc/mdstat (info: -R mdraid data)......................................... Present
/proc/meminfo (info: -I memory data)........................................ Present
/etc/os-release (info: -S distro version data).............................. Present
/proc/partitions (info: -p,-P partitions data).............................. Present
/proc/modules (info: -G module data)........................................ Present
/proc/mounts (info: -P,-p partition advanced data).......................... Present
/var/run/dmesg.boot (info: -D,-d disk data [BSD only])...................... Missing
/proc/scsi/scsi (info: -D Advanced hard disk data [used rarely])............ Present
/var/log/Xorg.0.log (info: -G graphics driver load status).................. Present

The following files are missing from your system:
File: /var/run/dmesg.boot
---------------------------------------------------------------------------
All tests completed.

Basic Usage of Inxi Tool in Linux

Below are some basic Inxi options we can use to collect machine plus system information.

Show Linux System Information

When run without any flags, Inxi will produce output to do with system CPU, kernel, uptime, memory size, hard disk size, number of processes, client used and inxi version:

$ inxi

CPU~Dual core Intel Core i5-4210U (-HT-MCP-) speed/max~2164/2700 MHz Kernel~4.4.0-21-generic x86_64 Up~3:15 Mem~3122.0/7879.9MB HDD~1000.2GB(20.0% used) Procs~234 Client~Shell inxi~2.2.35

Show Linux Kernel and Distribution Info

The command below will show sample system info (hostname, kernel info, desktop environment and disto) using the -S flag:

$ inxi -S

System: Host: TecMint Kernel: 4.4.0-21-generic x86_64 (64 bit) Desktop: Cinnamon 3.0.7
        Distro: Linux Mint 18 Sarah

Find Linux Laptop or PC Model Information

To print machine data-same as product details (system, product id, version, Mobo, model, BIOS etc), we can use the option -M as follows:

$ inxi -M

Machine:   System: LENOVO (portable) product: 20354 v: Lenovo Z50-70
           Mobo: LENOVO model: Lancer 5A5 v: 31900059WIN Bios: LENOVO v: 9BCN26WW date: 07/31/2014

Find Linux CPU and CPU Speed Information

We can display complete CPU information, including per CPU clock-speed and CPU max speed (if available) with the -C flag as follows:

$ inxi -C

CPU:       Dual core Intel Core i5-4210U (-HT-MCP-) cache: 3072 KB 
           clock speeds: max: 2700 MHz 1: 1942 MHz 2: 1968 MHz 3: 1734 MHz 4: 1710 MHz

Find Graphic Card Information in Linux

The option -G can be used to show graphics card info (card type, display server, resolution, GLX renderer and GLX version) like so:

$ inxi -G

Graphics:  Card-1: Intel Haswell-ULT Integrated Graphics Controller
           Card-2: NVIDIA GM108M [GeForce 840M]
           Display Server: X.Org 1.18.4 drivers: intel (unloaded: fbdev,vesa) Resolution: 1920x1080@60.05hz
           GLX Renderer: Mesa DRI Intel Haswell Mobile GLX Version: 3.0 Mesa 11.2.0

Find Audio/Sound Card Information in Linux

To get info about system audio/sound card, we use the -A flag:

$ inxi -A

Audio:     Card-1 Intel 8 Series HD Audio Controller driver: snd_hda_intel Sound: ALSA v: k4.4.0-21-generic
           Card-2 Intel Haswell-ULT HD Audio Controller driver: snd_hda_intel

Find Linux Network Card Information

To display network card info, we can make use of -N flag:

$ inxi -N

Network:   Card-1: Realtek RTL8111/8168/8411 PCI Express Gigabit Ethernet Controller driver: r8169
           Card-2: Realtek RTL8723BE PCIe Wireless Network Adapter driver: rtl8723be

Find Linux Hard Disk Information

To view full hard disk information,(size, id, model) we can use the flag -D:

$ inxi -D

Drives:    HDD Total Size: 1000.2GB (20.0% used) ID-1: /dev/sda model: ST1000LM024_HN size: 1000.2GB

Summarize Full Linux System Information Together

To show a summarized system information; combining all the information above, we need to use the -b flag as below:

$ inxi -b 

System:    Host: TecMint Kernel: 4.4.0-21-generic x86_64 (64 bit) Desktop: Cinnamon 3.0.7
           Distro: Linux Mint 18 Sarah
Machine:   System: LENOVO (portable) product: 20354 v: Lenovo Z50-70
           Mobo: LENOVO model: Lancer 5A5 v: 31900059WIN Bios: LENOVO v: 9BCN26WW date: 07/31/2014
CPU:       Dual core Intel Core i5-4210U (-HT-MCP-) speed/max: 2018/2700 MHz
Graphics:  Card-1: Intel Haswell-ULT Integrated Graphics Controller
           Card-2: NVIDIA GM108M [GeForce 840M]
           Display Server: X.Org 1.18.4 drivers: intel (unloaded: fbdev,vesa) Resolution: 1920x1080@60.05hz
           GLX Renderer: Mesa DRI Intel Haswell Mobile GLX Version: 3.0 Mesa 11.2.0
Network:   Card-1: Realtek RTL8111/8168/8411 PCI Express Gigabit Ethernet Controller driver: r8169
           Card-2: Realtek RTL8723BE PCIe Wireless Network Adapter driver: rtl8723be
Drives:    HDD Total Size: 1000.2GB (20.0% used)
Info:      Processes: 233 Uptime: 3:23 Memory: 3137.5/7879.9MB Client: Shell (bash) inxi: 2.2.35  

Find Linux Hard Disk Partition Details

The next command will enable us view complete list of hard disk partitions in relation to size, used and available space, filesystem as well as filesystem type on each partition with the -p flag:

$ inxi -p

Partition: ID-1: / size: 324G used: 183G (60%) fs: ext4 dev: /dev/sda10
           ID-2: swap-1 size: 4.00GB used: 0.00GB (0%) fs: swap dev: /dev/sda9

Shows Full Linux System Information

In order to show complete Inxi output, we use the -F flag as below (note that certain data is filtered for security reasons such as WAN IP):

$ inxi -F 

System:    Host: TecMint Kernel: 4.4.0-21-generic x86_64 (64 bit) Desktop: Cinnamon 3.0.7
           Distro: Linux Mint 18 Sarah
Machine:   System: LENOVO (portable) product: 20354 v: Lenovo Z50-70
           Mobo: LENOVO model: Lancer 5A5 v: 31900059WIN Bios: LENOVO v: 9BCN26WW date: 07/31/2014
CPU:       Dual core Intel Core i5-4210U (-HT-MCP-) cache: 3072 KB 
           clock speeds: max: 2700 MHz 1: 1716 MHz 2: 1764 MHz 3: 1776 MHz 4: 1800 MHz
Graphics:  Card-1: Intel Haswell-ULT Integrated Graphics Controller
           Card-2: NVIDIA GM108M [GeForce 840M]
           Display Server: X.Org 1.18.4 drivers: intel (unloaded: fbdev,vesa) Resolution: 1920x1080@60.05hz
           GLX Renderer: Mesa DRI Intel Haswell Mobile GLX Version: 3.0 Mesa 11.2.0
Audio:     Card-1 Intel 8 Series HD Audio Controller driver: snd_hda_intel Sound: ALSA v: k4.4.0-21-generic
           Card-2 Intel Haswell-ULT HD Audio Controller driver: snd_hda_intel
Network:   Card-1: Realtek RTL8111/8168/8411 PCI Express Gigabit Ethernet Controller driver: r8169
           IF: enp1s0 state: up speed: 100 Mbps duplex: full mac: 28:d2:44:eb:bd:98
           Card-2: Realtek RTL8723BE PCIe Wireless Network Adapter driver: rtl8723be
           IF: wlp2s0 state: down mac: 38:b1:db:7c:78:c7
Drives:    HDD Total Size: 1000.2GB (20.0% used) ID-1: /dev/sda model: ST1000LM024_HN size: 1000.2GB
Partition: ID-1: / size: 324G used: 183G (60%) fs: ext4 dev: /dev/sda10
           ID-2: swap-1 size: 4.00GB used: 0.00GB (0%) fs: swap dev: /dev/sda9
RAID:      No RAID devices: /proc/mdstat, md_mod kernel module present
Sensors:   System Temperatures: cpu: 56.0C mobo: N/A
           Fan Speeds (in rpm): cpu: N/A
Info:      Processes: 234 Uptime: 3:26 Memory: 3188.9/7879.9MB Client: Shell (bash) inxi: 2.2.35 

Linux System Monitoring with Inxi Tool

Following are few options used to monitor Linux system processes, uptime, memory etc.

Monitor Linux Processes Memory Usage

Get summarized system info in relation to total number of processes, uptime and memory usage:

$ inxi -I

Info:      Processes: 232 Uptime: 3:35 Memory: 3256.3/7879.9MB Client: Shell (bash) inxi: 2.2.35 

Monitoring Processes by CPU and Memory Usage

By default, it can help us determine the top 5 processes consuming CPU or memory. The -t option used together with c (CPU) and/or m (memory) options lists the top 5 most active processes eating up CPU and/or memory as shown below:

----------------- Linux CPU Usage ----------------- 
$ inxi -t c 
Processes: CPU: % used - top 5 active
           1: cpu: 53.7% command: plugin-container pid: 3066
           2: cpu: 20.0% command: java pid: 1527
           3: cpu: 19.7% command: firefox pid: 3018
           4: cpu: 4.6% command: Xorg pid: 2114
           5: cpu: 3.0% command: cinnamon pid: 2835
----------------- Linux Memoery Usage ----------------- 
$ inxi -t m
Processes: Memory: MB / % used - Used/Total: 3212.5/7879.9MB - top 5 active
           1: mem: 980.51MB (12.4%) command: plugin-container pid: 3066
           2: mem: 508.96MB (6.4%) command: java pid: 1527
           3: mem: 507.89MB (6.4%) command: firefox pid: 3018
           4: mem: 244.05MB (3.0%) command: chrome pid: 7405
           5: mem: 211.46MB (2.6%) command: chrome pid: 6146
----------------- Linux CPU and Memory Usage ----------------- 
$ inxi -t cm
Processes: CPU: % used - top 5 active
           1: cpu: 53.7% command: plugin-container pid: 3066
           2: cpu: 20.0% command: java pid: 1527
           3: cpu: 19.7% command: firefox pid: 3018
           4: cpu: 4.6% command: Xorg pid: 2114
           5: cpu: 3.0% command: cinnamon pid: 2835
           Memory: MB / % used - Used/Total: 3223.6/7879.9MB - top 5 active
           1: mem: 991.93MB (12.5%) command: plugin-container pid: 3066
           2: mem: 508.96MB (6.4%) command: java pid: 1527
           3: mem: 507.86MB (6.4%) command: firefox pid: 3018
           4: mem: 244.45MB (3.1%) command: chrome pid: 7405
           5: mem: 211.68MB (2.6%) command: chrome pid: 6146

We can use cm number (number can be 1-20) to specify a number other than 5, the command below will show us the top 10 most active processes eating up CPU and memory.

$ inxi -t cm10

Processes: CPU: % used - top 10 active
           1: cpu: 53.4% command: plugin-container pid: 3066
           2: cpu: 19.8% command: java pid: 1527
           3: cpu: 19.5% command: firefox pid: 3018
           4: cpu: 4.5% command: Xorg pid: 2114
           5: cpu: 3.0% command: cinnamon pid: 2835
           6: cpu: 2.8% command: chrome pid: 7405
           7: cpu: 1.1% command: pulseaudio pid: 2733
           8: cpu: 1.0% command: soffice.bin pid: 7799
           9: cpu: 0.9% command: chrome pid: 5763
           10: cpu: 0.5% command: chrome pid: 6179
           Memory: MB / % used - Used/Total: 3163.1/7879.9MB - top 10 active
           1: mem: 976.82MB (12.3%) command: plugin-container pid: 3066
           2: mem: 511.70MB (6.4%) command: java pid: 1527
           3: mem: 466.01MB (5.9%) command: firefox pid: 3018
           4: mem: 244.40MB (3.1%) command: chrome pid: 7405
           5: mem: 203.71MB (2.5%) command: chrome pid: 6146
           6: mem: 199.74MB (2.5%) command: chrome pid: 5763
           7: mem: 168.30MB (2.1%) command: cinnamon pid: 2835
           8: mem: 165.51MB (2.1%) command: soffice.bin pid: 7799
           9: mem: 158.91MB (2.0%) command: chrome pid: 6179
           10: mem: 151.83MB (1.9%) command: mysqld pid: 1259

Monitor Linux Network Interfaces

The command that follows will show us advanced network card information including interface, speed, mac id, state, IPs, etc:

$ inxi -Nni

Network:   Card-1: Realtek RTL8111/8168/8411 PCI Express Gigabit Ethernet Controller driver: r8169
           IF: enp1s0 state: up speed: 100 Mbps duplex: full mac: 28:d2:44:eb:bd:98
           Card-2: Realtek RTL8723BE PCIe Wireless Network Adapter driver: rtl8723be
           IF: wlp2s0 state: down mac: 38:b1:db:7c:78:c7
           WAN IP: 111.91.115.195 IF: wlp2s0 ip-v4: N/A
           IF: enp1s0 ip-v4: 192.168.0.103

Monitor Linux CPU Temperature and Fan Speed

We can keep track of the hardware installed/configured sensors output by using the -s option:

$ inxi -s

Sensors:   System Temperatures: cpu: 53.0C mobo: N/A
           Fan Speeds (in rpm): cpu: N/A

Find Weather Report in Linux

We can also view whether info (though API used is unreliable) for the current location with the -w or -W<different_location> to set a different location.

$ inxi -w
Weather:   Conditions: 93 F (34 C) - smoke Time: February 20, 1:38 PM IST

$ inxi -W Mumbai,India
Weather:   Conditions: 93 F (34 C) - smoke Time: February 20, 1:38 PM IST

$ inxi -W Nairobi,Kenya
Weather:   Conditions: 70 F (21 C) - Mostly Cloudy Time: February 20, 11:08 AM EAT

Find All Linux Repsitory Information

We can additionally view a distro repository data with the -r flag:

$ inxi -r 

Repos:     Active apt sources in file: /etc/apt/sources.list.d/dawidd0811-neofetch-xenial.list
           deb http://ppa.launchpad.net/dawidd0811/neofetch/ubuntu xenial main
           deb-src http://ppa.launchpad.net/dawidd0811/neofetch/ubuntu xenial main
           Active apt sources in file: /etc/apt/sources.list.d/dhor-myway-xenial.list
           deb http://ppa.launchpad.net/dhor/myway/ubuntu xenial main
           deb-src http://ppa.launchpad.net/dhor/myway/ubuntu xenial main
           Active apt sources in file: /etc/apt/sources.list.d/official-package-repositories.list
           deb http://packages.linuxmint.com sarah main upstream import backport
           deb http://archive.ubuntu.com/ubuntu xenial main restricted universe multiverse
           deb http://archive.ubuntu.com/ubuntu xenial-updates main restricted universe multiverse
           deb http://archive.ubuntu.com/ubuntu xenial-backports main restricted universe multiverse
           deb http://security.ubuntu.com/ubuntu/ xenial-security main restricted universe multiverse
           deb http://archive.canonical.com/ubuntu/ xenial partner
           Active apt sources in file: /etc/apt/sources.list.d/qbittorrent-team-qbittorrent-stable-xenial.list
           deb http://ppa.launchpad.net/qbittorrent-team/qbittorrent-stable/ubuntu xenial main
           deb-src http://ppa.launchpad.net/qbittorrent-team/qbittorrent-stable/ubuntu xenial main
           Active apt sources in file: /etc/apt/sources.list.d/slgobinath-safeeyes-xenial.list
           deb http://ppa.launchpad.net/slgobinath/safeeyes/ubuntu xenial main
           deb-src http://ppa.launchpad.net/slgobinath/safeeyes/ubuntu xenial main
           Active apt sources in file: /etc/apt/sources.list.d/snwh-pulp-xenial.list
           deb http://ppa.launchpad.net/snwh/pulp/ubuntu xenial main
           deb-src http://ppa.launchpad.net/snwh/pulp/ubuntu xenial main
           Active apt sources in file: /etc/apt/sources.list.d/twodopeshaggy-jarun-xenial.list
           deb http://ppa.launchpad.net/twodopeshaggy/jarun/ubuntu xenial main
           deb-src http://ppa.launchpad.net/twodopeshaggy/jarun/ubuntu xenial main
           Active apt sources in file: /etc/apt/sources.list.d/ubuntu-mozilla-security-ppa-xenial.list
           deb http://ppa.launchpad.net/ubuntu-mozilla-security/ppa/ubuntu xenial main
           deb-src http://ppa.launchpad.net/ubuntu-mozilla-security/ppa/ubuntu xenial main

To view it’s current installed version, a quick help, and open the man page for a full list of options and detailed usage info plus lots more, type:

$ inxi -v   #show version
$ inxi -h   #quick help
$ man inxi  #open man page

For more information, visit official GitHub Repository: https://github.com/smxi/inxi

That’s all for now! In this article, we reviewed Inxi, a full featured and remarkable command line tool for collecting machine hardware and system info. This is one of the best CLI based hardware/system information collection tools for Linux, I have ever used.

 
Source

How to Test Network Throughput Using iperf3 Tool in Linux

iperf3 is a free open source, cross-platform command line based program for performing real time network throughput measurements. It is one of the poweful tools for testing the maximum achievable bandwidth in IP networks (supports IPv4 and IPv6).

Read Also16 Bandwidth Monitoring Tools to Analyze Network Usage in Linux

With iperf, you can tune several parameters associated with timing, buffers and protocols such as TCP, UDP, SCTP. It comes in handy for network performance tuning operations.

In order to acquire maximum or rather improved network performance, you need to increase the throughput as well as latency of your network’s receiving and sending capabilities. However, before you can go into actual tuning, you need to perform some test to gather overall network performance statistics that will guide your tuning process.

Its results include time interval in seconds, data transfered, bandwidth (transfer rate), loss, and other useful network performance parameters. It is primarily intended to assist in tuning TCP connections over a particular path and this is what we will focus on in this guide.

Requirements:

  • Two networked computers which both have iperf3 installed.

How to Install iperf3 in Linux Systems

Before you start using iperf3, you need to install it on the two machines you will use for benchmarking. Since iperf3 is available in the official software repositories of most common Linux distributions, installing it should be easy, using a package manager as shown.

$ sudo apt install iperf3	#Debian/Ubuntu
$ sudo yum install iperf3	#RHEL/CentOS
$ sudo dnf install iperf3	#Fedora 22+ 

Once you have iperf3 installed on your both machines, you can start testing network throughput.

How to Test Network Throughput Between Linux Servers

Firt connect to the remote machine which you will use as the server and fireup iperf3 in server mode using -sflag, it will listen on port 5201 by default.

You can specify the format (kmg for KbitsMbitsGbits or KMG for KBytesMbytesGbytes) to report in, using the -f switch as shown.

$ iperf3 -s -f K 

If port 5201 is being used by another program on your server, you can specify a different port (e.g 3000) using the -p switch as shown.

$ iperf 3 -s -p 3000

Optionally, you can run the server as a daemon, using the -D flag and write server messages to a log file, as follows.

$ iperf 3 -s -D > iperf3log 

Then on your local machine which we will treat as the client (where the actual benchmarking takes place), run iperf3 in client mode using -c flag and specify the host on which the server is running on (either using its IP address or domain or hostname).

$ iperf 3 -c 192.168.10.1 -f K

After about 18 to 20 seconds, the client should terminate and produce results indicating the average throughput for the benchmark, as shown in the following screenshot.

Test Network Throughput Between Servers

Test Network Throughput Between Servers

Important: From the benchmark results, as shown in the above screenshot, there is a variation in values from the server and client. But, you should always consider using the results obtained from the iperf client machine in every test you carry out.

How to Peform Advance Network Test Throughput in Linux

There are a number of client specific options for performing advanced test, as explained below.

One of the important factors that determines the amount of data in the network a given time is the TCP window size – it is important in tuning TCP connections. You can set the window size/socket buffer size using the -wflag as shown.

$ iperf 3 -c 192.168.10.1 -f K -w 500K	

To run it in reverse mode where the server sends and client receives, add the -R switch.

$ iperf 3 -c 192.168.10.1 -f K -w 500K -R	

To run a bi-directional test, meaning you measure bandwidth in both directions simultaneously, use the -doption.

$ iperf 3 -c 192.168.10.1 -f K -w 500K -d

If you want to get server results in the client output, use the --get-server-output option.

$ iperf 3 -c 192.168.10.1 -f K -w 500K -R --get-server-output

Get Server Network Results in Client

Get Server Network Results in Client

It is also possible to set the number of parallel client streams (two in this example), which run at the same time, using the -P options.

$ iperf 3 -c 192.168.10.1 -f K -w 500K -P 2

For more information, see the iperf3 man page.

$ man iperf3

iperf3 Homepagehttps://iperf.fr/

That’s all! Remember to always perform network performance tests before going for actual network performance tuning. iperf3 is a powerful tool, that comes in handy for running network throughput tests. Do you have any thoughts to share or questions to ask, use the comment form below.

Source

WP2Social Auto Publish Powered By : XYZScripts.com