A Modern HTTP Client Similar to Curl and Wget Commands

HTTPie (pronounced aitch-tee-tee-pie) is a cURL-like, modern, user-friendly, and cross-platform command line HTTP client written in Python. It is designed to make CLI interaction with web services easy and as user-friendly as possible.

HTTPie - A Command Line HTTP Client

HTTPie – A Command Line HTTP Client

It has a simple http command that enables users to send arbitrary HTTP requests using a straightforward and natural syntax. It is used primarily for testing, trouble-free debugging, and mainly interacting with HTTP servers, web services and RESTful APIs.

  • HTTPie comes with an intuitive UI and supports JSON.
  • Expressive and intuitive command syntax.
  • Syntax highlighting, formatted and colorized terminal output.
  • HTTPS, proxies, and authentication support.
  • Support for forms and file uploads.
  • Support for arbitrary request data and headers.
  • Wget-like downloads and extensions.
  • Supports ython 2.7 and 3.x.

In this article, we will show how to install and use httpie with some basic examples in Linux.

How to Install and Use HTTPie in Linux

Most Linux distributions provide a HTTPie package that can be easily installed using the default system package manager, for example:

# apt-get install httpie  [On Debian/Ubuntu]
# dnf install httpie      [On Fedora]
# yum install httpie      [On CentOS/RHEL]
# pacman -S httpie        [On Arch Linux]

Once installed, the syntax for using httpie is:

$ http [options] [METHOD] URL [ITEM [ITEM]]

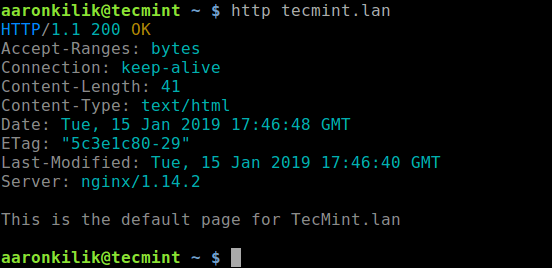
The most basic usage of httpie is to provide it a URL as an argument:

$ http example.com
Basic HTTPie Usage

Basic HTTPie Usage

Now let’s see some basic usage of httpie command with examples.

Send a HTTP Method

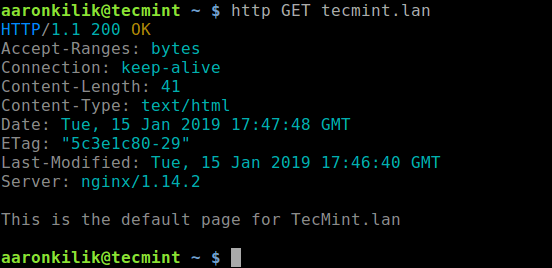
You can send a HTTP method in the request, for example, we will send the GET method which is used to request data from a specified resource. Note that the name of the HTTP method comes right before the URL argument.

$ http GET tecmint.lan
Send GET HTTP Method

Send GET HTTP Method

Upload a File

This example shows how to upload a file to transfer.sh using input redirection.

$ http https://transfer.sh < file.txt

Download a File

You can download a file as shown.

$ http https://transfer.sh/Vq3Kg/file.txt > file.txt		#using output redirection
OR
$ http --download https://transfer.sh/Vq3Kg/file.txt  	        #using wget format

Submit a Form

You can also submit data to a form as shown.

$ http --form POST tecmint.lan date='Hello World'

View Request Details

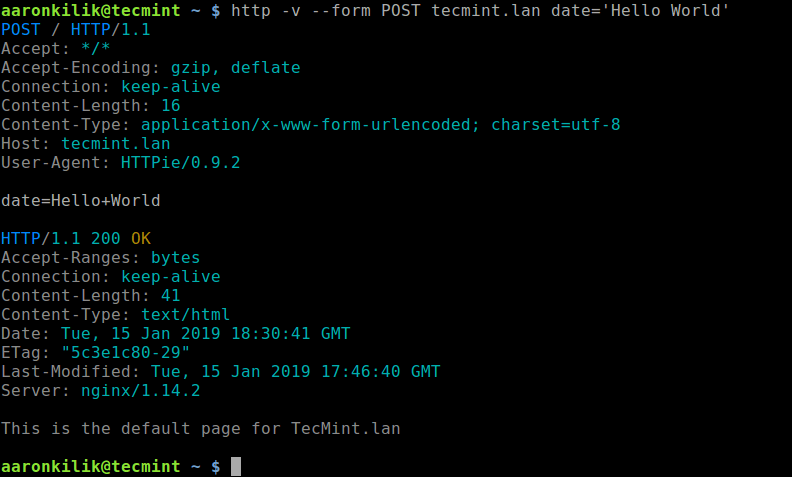
To see the request that is being sent, use -v option, for example.

$ http -v --form POST tecmint.lan date='Hello World'
View HTTP Request Details

View HTTP Request Details

Basic HTTP Auth

HTTPie also supports basic HTTP authentication from the CLI in the form:

$ http -a username:password http://tecmint.lan/admin/

Custom HTTP Headers

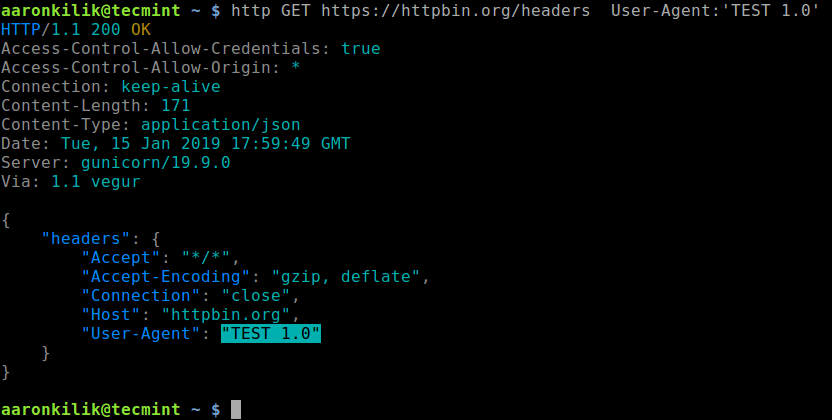
You can also define custom HTTP headers in using the Header:Value notation. We can test this using the following URL, which returns headers. Here, we have defined a custom User-Agent called ‘strong>TEST 1.0’:

$ http GET https://httpbin.org/headers User-Agent:'TEST 1.0'
Custom HTTP Headers

Custom HTTP Headers

See a complete list of usage options by running.

$ http --help
OR
$ man  ttp

You can find more usage examples from the HTTPie Github repository: https://github.com/jakubroztocil/httpie.

HTTPie is a cURL-like, modern, user-friendly command line HTTP client with simple and natural syntax, and displays colorized output. In this article, we have shown how to install and use httpie in Linux. If you have any questions, reach us via the comment form below.

Source

Governance without rules: How the potential for forking helps projects

Although forking is undesirable, the potential for forking provides a discipline that drives people to find a way forward that works for everyone.

forks

The speed and agility of open source projects benefit from lightweight and flexible governance. Their ability to run with such efficient governance is supported by the potential for project forking. That potential provides a discipline that encourages participants to find ways forward in the face of unanticipated problems, changed agendas, or other sources of disagreement among participants. The potential for forking is a benefit that is available in open source projects because all open source licenses provide needed permissions.

In contrast, standards development is typically constrained to remain in a particular forum. In other words, the ability to move the development of the standard elsewhere is not generally available as a disciplining governance force. Thus, forums for standards development typically require governance rules and procedures to maintain fairness among conflicting interests.

What do I mean by “forking a project”?

With the flourishing of distributed source control tools such as Git, forking is done routinely as a part of the development process. What I am referring to as project forking is more than that: If someone takes a copy of a project’s source code and creates a new center of development that is not expected to feed its work back into the original center of development, that is what I mean by forking the project.

Forking an open source project is possible because all open source licenses permit making a copy of the source code and permit those receiving copies to make and distribute their modifications.

It is the potential that matters

Participants in an open source project seek to avoid forking a project because forking divides resources: the people who were once all collaborating are now split into two groups.

However, the potential for forking is good. That potential presents a discipline that drives people to find a way forward that works for everyone. The possibility of forking—others going off and creating their own separate project—can be such a powerful force that informal governance can be remarkably effective. Rather than specific rules designed to foster decisions that consider all the interests, the possibility that others will take their efforts/resources elsewhere motivates participants to find common ground.

To be clear, the actual forking of a project is undesirable (and such forking of projects is not common). It is not the creation of the fork that is important. Rather, the potential for such a fork can have a disciplining effect on the behavior of participants—this force can be the underpinning of an open source project’s governance that is successful with less formality than might otherwise be expected.

The benefits of the potential for forking of an open source project can be appreciated by exploring the contrast with the development of industry standards.

Governance of standards development has different constraints

Forking is typically not possible in the development of industry standards. Adoption of industry standards can depend in part on the credibility of the organization that published the standard; while a standards organization that does not maintain its credibility over a long time may fail, that effect operates over too long of a time to help an individual standards-development activity. In most cases, it is not practical to move a standards-development activity to a different forum and achieve the desired industry impact. Also, the work products of standards activities are often licensed in ways that inhibit such a move.

Governance of development of an industry standard is important. For example, the development process for an industry standard should provide for consideration of relevant interests (both for the credibility of the resulting standard and for antitrust justification for what is typically collaboration among competitors). Thus, process is an important part of what a standards organization offers, and detailed governance rules are common. While those rules may appear as a drag on speed, they are there for a purpose.

Benefits of lightweight governance

Open source software development is faster and more agile than standards development. Lightweight, adaptable governance contributes to that speed. Without a need to set up complex governance rules, open source development can get going quickly, and more detailed governance can be developed later, as needed. If the initial shared interests fail to keep the project going satisfactorily, like-minded participants can copy the project and continue their work elsewhere.

On the other hand, development of a standard is generally a slower, more considered process. While people complain about the slowness of standards development, that slow speed flows from the need to follow protective process rules. If development of a standard cannot be moved to a different forum, you need to be careful that the required forum is adequately open and balanced in its operation.

Consider governance by a dictator. It can be very efficient. However, this benefit is accompanied by a high risk of abuse. There are a number of significant open source projects that have been led successfully by dictators. How does that work? The possibility of forking limits the potential for abuse by a dictator.

This important governance feature is not written down. Open source project governance documents do not list a right to fork the project. This potentiality exists because a project’s non-governance attributes allow the work to move and continue elsewhere: in particular, all open source licenses provide the rights to copy, modify, and distribute the code.

The role of forking in open source project governance is an example of a more general observation: Open source development can proceed productively and resiliently with very lightweight legal documents, generally just the open source licenses that apply to the code.

Source

Become a fish inside a robot in Feudal Alloy, out now with Linux support

We’ve seen plenty of robots and we’ve seen a fair amount of fish, but have you seen a fish controlling a robot with a sword? Say hello to Feudal Alloy.

Note: Key provided by the developer.

In Feudal Alloy you play as Attu, a kind-hearted soul who looks after old robots. His village was attacked, oil supplies were pillaged and so he sets off to reclaim the stolen goods. As far as the story goes, it’s not exactly exciting or even remotely original. Frankly, I thought the intro story video was a bit boring and just a tad too long, nice art though.

Like a lot of exploration action-RPGs, it can be a little on the unforgiving side at times. I’ve had a few encounters that I simply wasn’t ready for. The first of which happened at only 30 minutes in, as I strolled into a room that started spewing out robot after robot to attack me. One too many spinning blades to the face later, I was reset back a couple of rooms—that’s going to need a bit more oil.

What makes it all that more difficult, is you have to manage your heat which acts like your stamina. Overheat during combat and you might find another spinning blade to the face or worse. Thankfully, you can stock up on plenty of cooling liquid to use to cool yourself down and freeze your heat gauge momentarily which is pretty cool.

One of the major negatives in Feudal Alloy is the sound work. The music is incredibly repetitive, as is the hissing noises you make when you’re moving around. Honestly, as much as I genuinely wanted to share my love about the game it became pretty irritating which is a shame. It’s a good job I enjoyed the exploration, which does make up for it. Exploration is a heavy part of the game, as of course you start off with nothing and only the very basic abilities and it’s up to you to explore and find what you need.

The art design is the absolute highlight here, the first shopkeeper took me by surprise with the hamster wheel I will admit:

Some incredible talent went into the design work, while there’s a few places that could have been better like the backdrops the overall design was fantastic. Even when games have issues, if you enjoy what you’re seeing it certainly helps you overlook them.

Bonus points for doing something truly different with the protagonist here. We’ve seen all sorts of people before but this really was unique.

The Linux version does work beautifully, Steam Controller was perfection and I had zero issues with it. Most importantly though, is it worth your hard earned money and your valuable time? I would say so, if you enjoy action-RPGs with a sprinkle of metroidvania.

Available to check out on Humble Store, GOG and Steam.

Source

Linux 5.0 Is Finally Arriving In March

With last week’s release of Linux 5.0-rc1, it’s confirmed that Linus Torvalds has finally decided to adopt the 5.x series.

The kernel enthusiasts and developers have been waiting for this change since the release of Linux 4.17. Back then, Linus Torvalds hinted at the possibility of the jump to place after 4.20 release.

“I suspect that around 4.20 – which is I run out of fingers and toes to keep track of minor releases, and thus start getting mightily confused – I’ll switch over,” he said.

In another past update, he said that version 5.0 would surely happen someday but it would be “meaningless.”

Coming back to the present day, Linus has said that the jump to 5.0 doesn’t mean anything and he simply “ran out of fingers and
toes to count on.”

“The numbering change is not indicative of anything special,” he said.

Moreover, he also mentioned that there aren’t any major features that prompted this numbering either. “So go wild. Make up your own reason for why it’s 5.0,” he further added.

Linus Torvalds

“Go test. Kick the tires. Be the first kid on your block running a 5.0 pre-release kernel.”

Now that we’re done with all the “secret” reasons behind this move to 5.x series, we can expect Linux 5.0 to arrive in early March.

There are many features being lined up for this release and I’d covering those in the release announcement post. Meanwhile, keep reading Fossbytes for latest tech updates.

Also Read: Best Lightweight Linux Distros For Old Computers

Source

Get started with WTF, a dashboard for the terminal

Keep key information in view with WTF, the sixth in our series on open source tools that will make you more productive in 2019.

Person standing in front of a giant computer screen with numbers, data

There seems to be a mad rush at the beginning of every year to find ways to be more productive. New Year’s resolutions, the itch to start the year off right, and of course, an “out with the old, in with the new” attitude all contribute to this. And the usual round of recommendations is heavily biased towards closed source and proprietary software. It doesn’t have to be that way.

Here’s the sixth of my picks for 19 new (or new-to-you) open source tools to help you be more productive in 2019.

WTF

Once upon a time, I was doing some consulting at a firm that used Bloomberg Terminals. My reaction was, “Wow, that’s WAY too much information on one screen.” These days, however, it seems like I can’t get enough information on a screen when I’m working and have multiple web pages, dashboards, and console apps open to try to keep track of things.

While tmux and Screen can do split screens and multiple windows, they are a pain to set up, and the keybindings can take a while to learn (and often conflict with other applications).

WTF is a simple, easily configured information dashboard for the terminal. It is written in Go, uses a YAML configuration file, and can pull data from several different sources. All the data sources are contained in modules and include things like weather, issue trackers, date and time, Google Sheets, and a whole lot more. Some panes are interactive, and some just update with the most recent information available.

Setup is as easy as downloading the latest release for your operating system and running the command. Since it is written in Go, it is very portable and should run anywhere you can compile it (although the developer only builds for Linux and MacOS at this time).

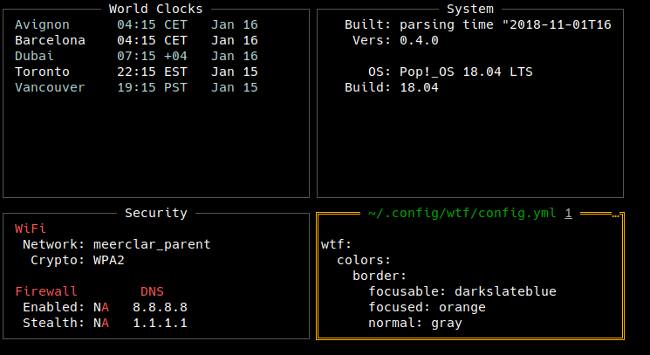
WTF default screen

When you run WTF for the first time, you’ll get the default screen, identical to the image above.

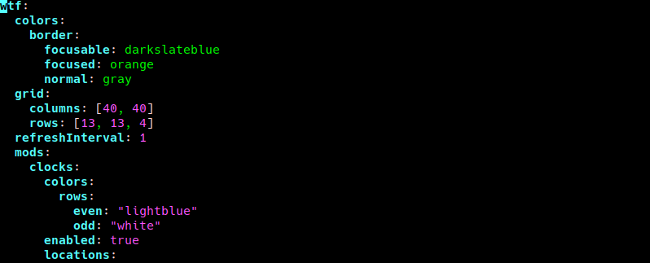
WTF's default config.yml

You also get the default configuration file in ~/.wtf/config.yml, and you can edit the file to suit your needs. The grid layout is configured in the top part of the file.

grid:
columns: [45, 45]
rows: [7, 7, 7, 4]

The numbers in the grid settings represent the character dimensions of each block. The default configuration is two columns of 40 characters, two rows 13 characters tall, and one row 4 characters tall. In the code above, I made the columns wider (45, 45), the rows smaller, and added a fourth row so I can have more widgets.

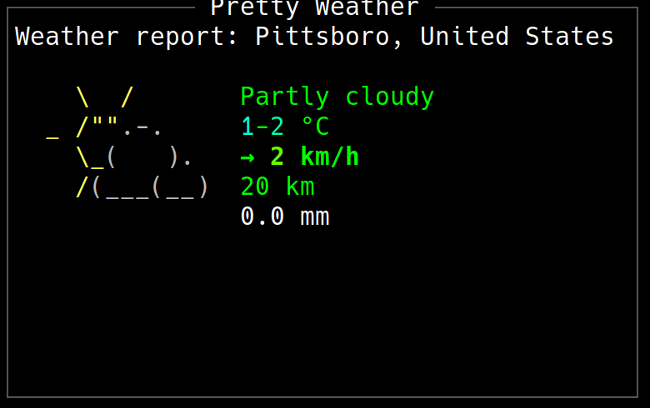
prettyweather on WTF

I like to see the day’s weather on my dashboard. There are two weather modules to chose from: Weather, which shows just the text information, and Pretty Weather, which is colorful and uses text-based graphics in the display.

prettyweather:
enabled: true
position:
top: 0
left: 1
height: 2
width: 1

This code creates a pane two blocks tall (height: 2) and one block wide (height: 1), positioned on the second column (left: 1) on the top row (top: 0) containing the Pretty Weather module.

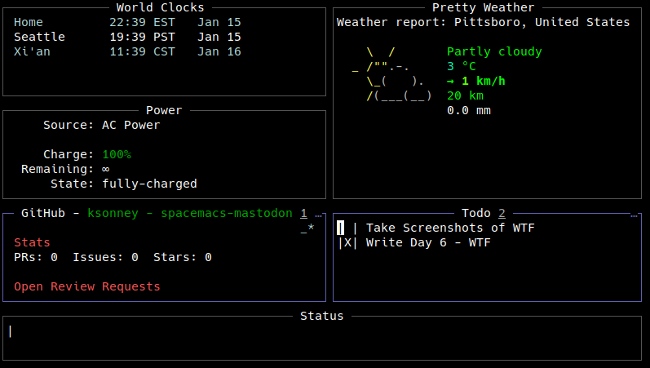
Some modules, like Jira, GitHub, and Todo, are interactive, and you can scroll, update, and save information in them. You can move between the interactive panes using the Tab key. The \ key brings up a help screen for the active pane so you can see what you can do and how. The Todo module lets you add, edit, and delete to-do items, as well as check them off as you complete them.

WTF dashboard with GitHub, Todos, Power, and the weather

There are also modules to execute commands and present the output, watch a text file, and monitor build and integration server output. All the documentation is very well done.

WTF is a valuable tool for anyone who needs to see a lot of data on one screen from different sources.

Source

Kali Linux Tools Listing (Security with sources url’s) – 2019

Kali Linux Tools - Logo
Information Gathering


Vulnerability Analysis


Exploitation Tools


Web Applications


Stress Testing


Sniffing & Spoofing


Password Attacks


Maintaining Access


Hardware Hacking


Reverse Engineering


Reporting Tools


Kali Linux Metapackages

Metapackages give you the flexibility to install specific subsets of tools based on your particular needs. For instance, if you are going to conduct a wireless security assessment, you can quickly create a custom Kali ISO and include the kali-linux-wireless metapackage to only install the tools you need.

For more information, please refer to the original Kali Linux Metapackages blog post.

kali-linux: The Base Kali Linux System
  • kali-desktop-common
  • apache2
  • apt-transport-https
  • atftpd
  • axel
  • default-mysql-server
  • exe2hexbat
  • expect
  • florence
  • gdisk
  • git
  • gparted
  • iw
  • lvm2
  • mercurial
  • mlocate
  • netcat-traditional
  • openssh-server
  • openvpn
  • p7zip-full
  • parted
  • php
  • php-mysql
  • rdesktop
  • rfkill
  • samba
  • screen
  • snmp
  • snmpd
  • subversion
  • sudo
  • tcpdump
  • testdisk
  • tftp
  • tightvncserver
  • tmux
  • unrar | unar
  • upx-ucl
  • vim
  • whois
  • zerofree
kali-linux-full: The Default Kali Linux Install
  • kali-linux
  • 0trace
  • ace-voip
  • afflib-tools
  • aircrack-ng
  • amap
  • apache-users
  • apktool
  • armitage
  • arp-scan
  • arping | iputils-arping
  • arpwatch
  • asleap
  • automater
  • autopsy
  • backdoor-factory
  • bbqsql
  • bdfproxy
  • bed
  • beef-xss
  • binwalk
  • blindelephant
  • bluelog
  • blueranger
  • bluesnarfer
  • bluez
  • bluez-hcidump
  • braa
  • btscanner
  • bulk-extractor
  • bully
  • burpsuite
  • cabextract
  • cadaver
  • cdpsnarf
  • cewl
  • cgpt
  • cherrytree
  • chirp
  • chkrootkit
  • chntpw
  • cisco-auditing-tool
  • cisco-global-exploiter
  • cisco-ocs
  • cisco-torch
  • clang
  • clusterd
  • cmospwd
  • commix
  • copy-router-config
  • cowpatty
  • creddump
  • crunch
  • cryptcat
  • cryptsetup
  • curlftpfs
  • cutycapt
  • cymothoa
  • darkstat
  • davtest
  • dbd
  • dc3dd
  • dcfldd
  • ddrescue
  • deblaze
  • dex2jar
  • dhcpig
  • dirb
  • dirbuster
  • dmitry
  • dnmap
  • dns2tcp
  • dnschef
  • dnsenum
  • dnsmap
  • dnsrecon
  • dnstracer
  • dnswalk
  • doona
  • dos2unix
  • dotdotpwn
  • dradis
  • driftnet
  • dsniff
  • dumpzilla
  • eapmd5pass
  • edb-debugger
  • enum4linux
  • enumiax
  • ethtool
  • ettercap-graphical
  • ewf-tools
  • exiv2
  • exploitdb
  • extundelete
  • fcrackzip
  • fern-wifi-cracker
  • ferret-sidejack
  • fierce
  • fiked
  • fimap
  • findmyhash
  • flasm
  • foremost
  • fping
  • fragroute
  • fragrouter
  • framework2
  • ftester
  • funkload
  • galleta
  • gdb
  • ghost-phisher
  • giskismet
  • golismero
  • gpp-decrypt
  • grabber
  • guymager
  • hackrf
  • hamster-sidejack
  • hash-identifier
  • hashcat
  • hashcat-utils
  • hashdeep
  • hashid
  • hexinject
  • hexorbase
  • hotpatch
  • hping3
  • httrack
  • hydra
  • hydra-gtk
  • i2c-tools
  • iaxflood
  • ifenslave
  • ike-scan
  • inetsim
  • intersect
  • intrace
  • inviteflood
  • iodine
  • irpas
  • jad
  • javasnoop
  • jboss-autopwn
  • john
  • johnny
  • joomscan
  • jsql-injection
  • keimpx
  • killerbee
  • king-phisher
  • kismet
  • laudanum
  • lbd
  • leafpad
  • libfindrtp
  • libfreefare-bin
  • libhivex-bin
  • libnfc-bin
  • lynis
  • macchanger
  • magicrescue
  • magictree
  • maltego
  • maltego-teeth
  • maskprocessor
  • masscan
  • mc
  • mdbtools
  • mdk3
  • medusa
  • memdump
  • metasploit-framework
  • mfcuk
  • mfoc
  • mfterm
  • mimikatz
  • minicom
  • miranda
  • miredo
  • missidentify
  • mitmproxy
  • msfpc
  • multimac
  • nasm
  • nbtscan
  • ncat-w32
  • ncrack
  • ncurses-hexedit
  • netdiscover
  • netmask
  • netsed
  • netsniff-ng
  • netwag
  • nfspy
  • ngrep
  • nikto
  • nipper-ng
  • nishang
  • nmap
  • ohrwurm
  • ollydbg
  • onesixtyone
  • ophcrack
  • ophcrack-cli
  • oscanner
  • p0f
  • pack
  • padbuster
  • paros
  • pasco
  • passing-the-hash
  • patator
  • pdf-parser
  • pdfid
  • pdgmail
  • perl-cisco-copyconfig
  • pev
  • pipal
  • pixiewps
  • plecost
  • polenum
  • powerfuzzer
  • powersploit
  • protos-sip
  • proxychains
  • proxystrike
  • proxytunnel
  • pst-utils
  • ptunnel
  • pwnat
  • pyrit
  • python-faraday
  • python-impacket
  • python-peepdf
  • python-rfidiot
  • python-scapy
  • radare2
  • rainbowcrack
  • rake
  • rcracki-mt
  • reaver
  • rebind
  • recon-ng
  • recordmydesktop
  • recoverjpeg
  • recstudio
  • redfang
  • redsocks
  • reglookup
  • regripper
  • responder
  • rifiuti
  • rifiuti2
  • rsmangler
  • rtpbreak
  • rtpflood
  • rtpinsertsound
  • rtpmixsound
  • safecopy
  • safecopy
  • sakis3g
  • samdump2
  • sbd
  • scalpel
  • scrounge-ntfs
  • sctpscan
  • sendemail
  • set
  • sfuzz
  • sidguesser
  • siege
  • siparmyknife
  • sipcrack
  • sipp
  • sipvicious
  • skipfish
  • sleuthkit
  • smali
  • smbmap
  • smtp-user-enum
  • sniffjoke
  • snmpcheck
  • socat
  • sparta
  • spectools
  • spike
  • spooftooph
  • sqldict
  • sqlitebrowser
  • sqlmap
  • sqlninja
  • sqlsus
  • sslcaudit
  • ssldump
  • sslh
  • sslscan
  • sslsniff
  • sslsplit
  • sslstrip
  • sslyze
  • statsprocessor
  • stunnel4
  • suckless-tools
  • sucrack
  • swaks
  • t50
  • tcpflow
  • tcpick
  • tcpreplay
  • termineter
  • tftpd32
  • thc-ipv6
  • thc-pptp-bruter
  • thc-ssl-dos
  • theharvester
  • tlssled
  • tnscmd10g
  • truecrack
  • twofi
  • u3-pwn
  • ua-tester
  • udptunnel
  • unicornscan
  • uniscan
  • unix-privesc-check
  • urlcrazy
  • vboot-kernel-utils
  • vboot-utils
  • vim-gtk
  • vinetto
  • vlan
  • voiphopper
  • volafox
  • volatility
  • vpnc
  • wafw00f
  • wapiti
  • wce
  • webacoo
  • webscarab
  • webshells
  • weevely
  • wfuzz
  • whatweb
  • wifi-honey
  • wifitap
  • wifite
  • windows-binaries
  • winexe
  • wireshark
  • wol-e
  • wordlists
  • wpscan
  • xpdf
  • xprobe
  • xspy
  • xsser
  • xtightvncviewer
  • yersinia
  • zaproxy
  • zenmap
  • zim
kali-linux-all: All Available Packages in Kali Linux
  • kali-linux-forensic
  • kali-linux-full
  • kali-linux-gpu
  • kali-linux-pwtools
  • kali-linux-rfid
  • kali-linux-sdr
  • kali-linux-top10
  • kali-linux-voip
  • kali-linux-web
  • kali-linux-wireless
  • android-sdk
  • device-pharmer
  • freeradius
  • hackersh
  • htshells
  • ident-user-enum
  • ismtp
  • linux-exploit-suggester
  • openvas
  • parsero
  • python-halberd
  • sandi
  • set
  • shellnoob
  • shellter
  • teamsploit
  • vega
  • veil
  • webhandler
  • websploit
kali-linux-sdr: Software Defined Radio (SDR) Tools in Kali
  • kali-linux
  • chirp
  • gnuradio
  • gqrx-sdr
  • gr-iqbal
  • gr-osmosdr
  • hackrf
  • kalibrate-rtl
  • libgnuradio-baz
  • multimon-ng
  • rtlsdr-scanner
  • uhd-host
  • uhd-images
kali-linux-gpu: Kali Linux GPU-Powered Tools
  • kali-linux
  • oclgausscrack
  • oclhashcat
  • pyrit
  • truecrack
kali-linux-wireless: Wireless Tools in Kali
  • kali-linux
  • kali-linux-sdr
  • aircrack-ng
  • asleap
  • bluelog
  • blueranger
  • bluesnarfer
  • bluez
  • bluez-hcidump
  • btscanner
  • bully
  • cowpatty
  • crackle
  • eapmd5pass
  • fern-wifi-cracker
  • giskismet
  • iw
  • killerbee
  • kismet
  • libfreefare-bin
  • libnfc-bin
  • macchanger
  • mdk3
  • mfcuk
  • mfoc
  • mfterm
  • oclhashcat
  • pyrit
  • python-rfidiot
  • reaver
  • redfang
  • rfcat
  • rfkill
  • sakis3g
  • spectools
  • spooftooph
  • ubertooth
  • wifi-honey
  • wifitap
  • wifite
  • wireshark
kali-linux-web: Kali Linux Web-App Assessment Tools
  • kali-linux
  • apache-users
  • apache2
  • arachni
  • automater
  • bbqsql
  • beef-xss
  • blindelephant
  • burpsuite
  • cadaver
  • clusterd
  • cookie-cadger
  • cutycapt
  • davtest
  • default-mysql-server
  • dirb
  • dirbuster
  • dnmap
  • dotdotpwn
  • eyewitness
  • ferret-sidejack
  • ftester
  • funkload
  • golismero
  • grabber
  • hamster-sidejack
  • hexorbase
  • httprint
  • httrack
  • hydra
  • hydra-gtk
  • jboss-autopwn
  • joomscan
  • jsql-injection
  • laudanum
  • lbd
  • maltego
  • maltego-teeth
  • medusa
  • mitmproxy
  • ncrack
  • nikto
  • nishang
  • nmap
  • oscanner
  • owasp-mantra-ff
  • padbuster
  • paros
  • patator
  • php
  • php-mysql
  • plecost
  • powerfuzzer
  • proxychains
  • proxystrike
  • proxytunnel
  • python-halberd
  • redsocks
  • sidguesser
  • siege
  • skipfish
  • slowhttptest
  • sqldict
  • sqlitebrowser
  • sqlmap
  • sqlninja
  • sqlsus
  • sslcaudit
  • ssldump
  • sslh
  • sslscan
  • sslsniff
  • sslsplit
  • sslstrip
  • sslyze
  • stunnel4
  • thc-ssl-dos
  • tlssled
  • tnscmd10g
  • ua-tester
  • uniscan
  • vega
  • wafw00f
  • wapiti
  • webacoo
  • webhandler
  • webscarab
  • webshells
  • weevely
  • wfuzz
  • whatweb
  • wireshark
  • wpscan
  • xsser
  • zaproxy
kali-linux-forensic: Kali Linux Forensic Tools
  • kali-linux
  • afflib-tools
  • apktool
  • autopsy
  • bulk-extractor
  • cabextract
  • chkrootkit
  • creddump
  • dc3dd
  • dcfldd
  • ddrescue
  • dumpzilla
  • edb-debugger
  • ewf-tools
  • exiv2
  • extundelete
  • fcrackzip
  • firmware-mod-kit
  • flasm
  • foremost
  • galleta
  • gdb
  • gparted
  • guymager
  • hashdeep
  • inetsim
  • iphone-backup-analyzer
  • jad
  • javasnoop
  • libhivex-bin
  • lvm2
  • lynis
  • magicrescue
  • mdbtools
  • memdump
  • missidentify
  • nasm
  • ollydbg
  • p7zip-full
  • parted
  • pasco
  • pdf-parser
  • pdfid
  • pdgmail
  • pev
  • polenum
  • pst-utils
  • python-capstone
  • python-distorm3
  • python-peepdf
  • radare2
  • recoverjpeg
  • recstudio
  • reglookup
  • regripper
  • rifiuti
  • rifiuti2
  • safecopy
  • safecopy
  • samdump2
  • scalpel
  • scrounge-ntfs
  • sleuthkit
  • smali
  • sqlitebrowser
  • tcpdump
  • tcpflow
  • tcpick
  • tcpreplay
  • truecrack
  • unrar | unar
  • upx-ucl
  • vinetto
  • volafox
  • volatility
  • wce
  • wireshark
  • xplico
  • yara
kali-linux-voip: Kali Linux VoIP Tools
  • kali-linux
  • ace-voip
  • dnmap
  • enumiax
  • iaxflood
  • inviteflood
  • libfindrtp
  • nmap
  • ohrwurm
  • protos-sip
  • rtpbreak
  • rtpflood
  • rtpinsertsound
  • rtpmixsound
  • sctpscan
  • siparmyknife
  • sipcrack
  • sipp
  • sipvicious
  • voiphopper
  • wireshark
kali-linux-pwtools: Kali Linux Password Cracking Tools
  • kali-linux
  • kali-linux-gpu
  • chntpw
  • cmospwd
  • crunch
  • fcrackzip
  • findmyhash
  • gpp-decrypt
  • hash-identifier
  • hashcat
  • hashcat-utils
  • hashid
  • hydra
  • hydra-gtk
  • john
  • johnny
  • keimpx
  • maskprocessor
  • medusa
  • mimikatz
  • ncrack
  • ophcrack
  • ophcrack-cli
  • pack
  • passing-the-hash
  • patator
  • pdfcrack
  • pipal
  • polenum
  • rainbowcrack
  • rarcrack
  • rcracki-mt
  • rsmangler
  • samdump2
  • seclists
  • sipcrack
  • sipvicious
  • sqldict
  • statsprocessor
  • sucrack
  • thc-pptp-bruter
  • truecrack
  • twofi
  • wce
  • wordlists
kali-linux-top10: Top 10 Kali Linux Tools
  • kali-linux
  • aircrack-ng
  • burpsuite
  • hydra
  • john
  • maltego
  • maltego-teeth
  • metasploit-framework
  • nmap
  • sqlmap
  • wireshark
  • zaproxy
kali-linux-rfid: Kali Linux RFID Tools
  • kali-linux
  • libfreefare-bin
  • libnfc-bin
  • mfcuk
  • mfoc
  • mfterm
  • python-rfidiot
kali-linux-nethunter: Kali Linux NetHunters Default Tools
  • kali-defaults
  • kali-root-login
  • aircrack-ng
  • apache2
  • armitage
  • autossh
  • backdoor-factory
  • bdfproxy
  • beef-xss
  • burpsuite
  • dbd
  • desktop-base
  • device-pharmer
  • dnsmasq
  • dnsutils
  • dsniff
  • ettercap-text-only
  • exploitdb
  • florence
  • giskismet
  • gpsd
  • hostapd
  • isc-dhcp-server
  • iw
  • kismet
  • kismet-plugins
  • libffi-dev
  • librtlsdr-dev
  • libssl-dev
  • macchanger
  • mdk3
  • metasploit-framework
  • mfoc
  • mitmf
  • mitmproxy
  • nethunter-utils
  • nishang
  • nmap
  • openssh-server
  • openvpn
  • p0f
  • php
  • pixiewps
  • postgresql
  • ptunnel
  • python-dnspython
  • python-lxml
  • python-m2crypto
  • python-mako
  • python-netaddr
  • python-pcapy
  • python-pip
  • python-setuptools
  • python-twisted
  • recon-ng
  • rfkill
  • socat
  • sox
  • sqlmap
  • sslsplit
  • sslstrip
  • tcpdump
  • tcptrace
  • tightvncserver
  • tinyproxy
  • tshark
  • wifite
  • wipe
  • wireshark
  • wpasupplicant
  • xfce4
  • xfce4-goodies
  • xfce4-places-plugin
  • zip


Source

How to Install the Official Slack Client on Linux

Slack is a popular way for teams to collaborate in real time chat, with plenty of tools and organization to keep conversations on track and focused. Plenty of offices have adopted Slack, and it’s become and absolute necessity for distributed teams.

While you can use Slack through your web browser, its simpler and generally more efficient to install the official Slack client on your desktop. Slack supports Linux with Debian and RPM packages as well as an official Snap. As a result, it’s simple to get running with Slack on your distribution of choice.

Install Slack

Download Slack for Linux

While you won’t find Slack in many distribution repositories, you won’t have much trouble installing it. As an added bonus, the Debian and RPM packages provided by Slack also set up repositories on your system, so you’ll receive regular updates, whenever they become available.

Ubuntu/Debian

Open your browser, and go to Slack’s Linux download page. Click the button to download the “.DEB” package. Save it.

Once you have the package downloaded, open your terminal emulator, and change the directory into your download folder.

From there, use dpkg to install the package.

sudo dpkg -i slack-desktop-3.3.4-amd64.deb

If you run into missing dependencies, fix it with Apt.

sudo apt –fix-broken install

Fedora

Fedora is another officially supported distribution. Open your web browser and go to the Slack download page. Click the button for the “.RPM” package. When prompted, save the package.

After the download finishes, open your terminal, and change into your download directory.

Now, use the “rpm” command to install the package directly.

sudo rpm -i slack-3.3.4-0.1.fc21.x86_64.rpm

Arch Linux

Arch users can find the latest version of Slack in the AUR. If you haven’t set up an AUR helper on your system, go to Slack’s AUR page, and clone the Git repository there. Change into the directory, and build and install the package with makepkg.

cd ~/Downloads
git clone https://aur.archlinux.org/slack-desktop.git
cd slack-desktop
makepkg -si

If you do have an AUR helper, just install the Slack client.

sudo pikaur -S slack-desktop

Snap

For everyone else, the snap is always a good option. It’s an officially packaged and supported snap straight from Slack. Just install it on your system.

Using Slack

Slack is a graphical application. Most desktop environments put it under the “Internet” category. On GNOME you’ll find it listed alphabetically under “Slack.” Go ahead and launch it.

Slack Workspace URL

Slack will start right away by asking for the URL of the workspace you want to join. Enter it and click “Continue.”

Slack Enter Email

Next, Slack will ask for the email address you have associated with that workspace. Enter that, too.

Slack Enter Password

Finally, enter your password for the workspace. Once you do, Slack will sign you in.

Slack on Ubuntu

After you’re signed in, you can get to work using Slack. You can click on the different channels to move between them. To the far left, you’ll see the icon associated with your workspace and a plus sign icon below it. Click the plus if you’d like to sign in to an additional workspace.

Note the Slack icon in your system tray. You will receive desktop notifications from Slack, and if one arrives when you were away, you’ll see the blue dot in the tray icon turn red.

You’re now ready to use Slack on Linux like a pro!

Source

Linux Today – Using Linux containers to analyze the impact of climate change and soil on New Zealand crops

Method models climate change scenarios by processing vast amounts of high-resolution soil and weather data.

New Zealand’s economy is dependent on agriculture, a sector that is highly sensitive to climate change. This makes it critical to develop analysis capabilities to assess its impact and investigate possible mitigation and adaptation options. That analysis can be done with tools such as agricultural systems models. In simple terms, it involves creating a model to quantify how a specific crop behaves under certain conditions then simulating altering a few variables to see how that behavior changes. Some of the software available to do this includes CropSyst from Washington State University and the Agricultural Production Systems Simulator (APSIM) from the Commonwealth Scientific and Industrial Research Organization (CSIRO) in Australia.

Historically, these models have been used primarily for small area (point-based) simulations where all the variables are well known. For large area studies (landscape scale, e.g., a whole region or national level), the soil and climate data need to be upscaled or downscaled to the resolution of interest, which means increasing uncertainty. There are two major reasons for this: 1) it is hard to create and/or obtain access to high-resolution, geo-referenced, gridded datasets; and 2) the most common installation of crop modeling software is in an end user’s desktop or workstation that’s usually running one of the supported versions of Microsoft Windows (system modelers tend to prefer the GUI capabilities of the tools to prepare and run simulations, which are then restricted to the computational power of the hardware used).

New Zealand has several Crown Research Institutes that provide scientific research across many different areas of importance to the country’s economy, including Landcare Research, the National Institute of Water and Atmospheric Research (NIWA), and the New Zealand Institute for Plant & Food Research. In a joint project, these organizations contributed datasets related to the country’s soil, terrain, climate, and crop models. We wanted to create an analysis framework that uses APSIM to run enough simulations to cover relevant time-scales for climate change questions (>100 years’ worth of climate change data) across all of New Zealand at a spatial resolution of approximately 25km2. We’re talking several million simulations, each one taking at least 10 minutes to complete on a single CPU core. If we were to use a standard desktop, it would probably have been faster to just wait outside and see what happens.

Enter HPC

High-performance computing (HPC) is the use of parallel processing for running programs efficiently, reliably, and quickly. Typically this means making use of batch processing across multiple hosts, with each individual process dealing with just a little bit of data, using a job scheduler to orchestrate them.

Parallel computing can mean either distributed computing, where each processing thread needs to communicate with others between tasks (especially intermediate results), or it can be “embarrassingly parallel” where there is no such need. When dealing with the latter, the overall performance grows linearly the more capacity there is available.

Crop modeling is, luckily, an embarrassingly parallel problem: it does not matter how much data or how many variables you have, each variable that changes means one full simulation that needs to run. And because simulations are independent from each other, you can run as many simulations as you have CPUs.

Solve for dependency hell

APSIM is a complex piece of software. Its codebase is comprised of modules that have been written in multiple different programming languages and tightly integrated over the past three decades. The application achieves portability between the Windows and GNU/Linux operating systems by leveraging the Mono Project framework, but the number of external dependencies and workarounds that are required to run it in a Linux environment make the implementation non-trivial.

The build and install documentation is scarce, and the instructions that do exist target Ubuntu Desktop editions. Several required dependencies are undocumented, and the build process sometimes relies on the binfmt_misckernel module to allow direct execution of .exe files linked to the Mono libraries (instead of calling mono file.exe), but it does so inconsistently (this has since been fixed upstream). To add to the confusion, some .exe files are Mono assemblies, and some are native (libc) binaries (this is done to avoid differences in the names of the executables between operating system platforms). Finally, Linux builds are created on-demand “in-house” by the developers, but there are no publicly accessible automated builds due to lack of interest from external users.

All of this may work within a single organization, but it makes APSIM challenging to adopt in other environments. HPC clusters tend to standardize on one Linux distribution (e.g., Red Hat Enterprise Linux, CentOS, Ubuntu, etc.) and job schedulers (e.g., PBS, HTCondor, Torque, SGE, Platform LSF, SLURM, etc.) and can implement disparate storage and network architectures, network configurations, user authentication and authorization policies, etc. As such, what software is available, what versions, and how they are integrated are highly environment-specific. Projects like OpenHPC aim to provide some sanity to this situation, but the reality is that most HPC clusters are bespoke in nature, tailored to the needs of the organization.

A simple way to work around these issues is to introduce containerization technologies. This should not come as a surprise (it’s in the title of this article, after all). Containers permit creating a standalone, self-sufficient artifact that can be run without changes in any environment that supports running them. But containers also provide additional advantages from a “reproducible research” perspective: Software containers can be created in a reproducible way, and once created, the resulting container images are both portable and immutable.

  • Reproducibility: Once a container definition file is written following best practices (for instance, making sure that the software versions installed are explicitly defined), the same resulting container image can be created in a deterministic fashion.
  • Portability: When an administrator creates a container image, they can compile, install, and configure all the software that will be required and include any external dependencies or libraries needed to run them, all the way down the stack to the Linux distribution itself. During this process, there is no need to target the execution environment for anything other than the hardware. Once created, a container image can be distributed as a standalone artifact. This cleanly separates the build and install stages of a particular software from the runtime stage when that software is executed.
  • Immutability: After it’s built, a container image is immutable. That is, it is not possible to change its contents and persist them without creating a new image.

These properties enable capturing the exact state of the software stack used during the processing and distributing it alongside the raw data to replicate the analysis in a different environment, even when the Linux distribution used in that environment does not match the distribution used inside the container image.

Docker

While operating-system-level virtualization is not a new technology, it was primarily because of Docker that it became increasingly popular. Docker provides a way to develop, deploy, and run software containers in a simple fashion.

The first iteration of an APSIM container image was implemented in Docker, replicating the build environment partially documented by the developers. This was done as a proof of concept on the feasibility of containerizing and running the application. A second iteration introduced multi-stage builds: a method of creating container images that allows separating the build phase from the installation phase. This separation is important because it reduces the final size of the resulting container images, which will not include any dependencies that are required only during build time. Docker containers are not particularly suitable for multi-tenant HPC environments. There are three primary things to consider:

1. Data ownership

Container images do not typically store the configuration needed to integrate with enterprise authentication directories (e.g., Active Directory, LDAP, etc.) because this would reduce portability. Instead, user information is usually hardcoded explicitly in the image directly (and when it’s not, root is used by default). When the container starts, the contained process will run with this hardcoded identity (and remember, root is used by default). The result is that the output data created by the containerized process is owned by a user that potentially only exists inside the container image. NOT by the user who started the container (also, did I mention that root is used by default?).

A possible workaround for this problem is to override the runtime user when the container starts (using the docker run -u… flag). But this introduces added complexity for the user, who must now learn about user identities (UIDs), POSIX ownership and permissions, the correct syntax for the docker run command, as well as find the correct values for their UID, group identifier (GID), and any additional groups they may need. All of this for someone who just wants to get some science done.

It is also worth noting that this method will not work every time. Not all applications are happy running as an arbitrary user or a user not present in the system’s database (e.g., /etc/passwd file). These are edge cases, but they exist.

2. Access to persistent storage

Container images include only the files needed for the application to run. They typically do not include the input or raw data to be processed by the application. By default, when a container image is instantiated (i.e., when the container is started), the filesystem presented to the containerized application will show only those files and directories present in the container image. To access the input or raw data, the end user must explicitly map the desired mount points from the host server to paths within the filesystem in the container (typically using bindmounts). With Docker, these “volume mounts” are impossible to pre-configure globally, and the mapping must be done on a per-container basis when the containers are started. This not only increases the complexity of the commands needed to run an application, but it also introduces another undesired effect…

3. Compute host security

The ability to start a process as an arbitrary user and the ability to map arbitrary files or directories from the host server into the filesystem of a running container are two of several powerful capabilities that Docker provides to operators. But they are possible because, in the security model adopted by Docker, the daemon that runs the containers must be started on the host with rootprivileges. In consequence, end users that have access to the Docker daemon end up having the equivalent of root access to the host. This introduces security concerns since it violates the Principle of Least Privilege. Malicious actors can perform actions that exceed the scope of their initial authorization, but end users may also inadvertently corrupt or destroy data, even without malicious intent.

A possible solution to this problem is to implement user namespaces. But in practice, these are cumbersome to maintain, particularly in corporate environments where user identities are centralized in enterprise directories.

Singularity

To tackle these problems, the third iteration of APSIM containers was implemented using Singularity. Released in 2016, Singularity Community is an open source container platform designed specifically for scientific and HPC environments. A user inside a Singularity container is the same user as outside the container is one of Singularity’s defining characteristics. It allows an end user to run a command inside of a container image as him or herself. Conversely, it does not allow impersonating other users when starting a container.

Another advantage of Singularity’s approach is the way container images are stored on disk. With Docker, container images are stored in multiple separate “layers,” which the Docker daemon needs to overlay and flatten during the container’s runtime. When multiple container images reuse the same layer, only one copy of that layer is needed to re-create the runtime container’s filesystem. This results in more efficient use of storage, but it does add a bit of complexity when it comes to distributing and inspecting container images, so Docker provides special commands to do so. With Singularity, the entire execution environment is contained within a single, executable file. This introduces duplication when multiple images have similar contents, but it makes the distribution of those images trivial since it can now be done with traditional file transfer methods, protocols, and tools.

The Docker container recipe files (i.e., the Dockerfile and related assets) can be used to re-create the container image as it was built for the project. Singularity allows importing and running Docker containers natively, so the same files can be used for both engines.

A day in the life

To illustrate the above with a practical example, let’s put you in the shoes of a computational scientist. So not to single out anyone in particular, imagine that you want to use ToolA, which processes input files and creates output with statistics about them. Before asking the sysadmin to help you out, you decide to test the tool on your local desktop to see if works.

ToolA has a simple syntax. It’s a single binary that takes one or more filenames as command line arguments and accepts a -o {json|yaml} flag to alter how the results are formatted. The outputs are stored in the same path as the input files are. For example:

$ ./ToolA file1 file2
$ ls
file1 file1.out file2 file2.out ToolA

You have several thousand files to process, but even though ToolA uses multi-threading to process files independently, you don’t have a thousand CPU cores in this machine. You must use your cluster’s job scheduler. The simplest way to do this at scale is to launch as many jobs as files you need to process, using one CPU thread each. You test the new approach:

$ export PATH=$(pwd):${PATH}
$ cd ~/input/files/to/process/samples
$ ls -l | wc -l
38
$ # we will set this to the actual qsub command when we run in the cluster
$ qsub=””
$ for myfiles in *; do $qsub ToolA $myfiles; done

$ ls -l | wc -l
75

Excellent. Time to bug the sysadmin and get ToolA installed in the cluster.

It turns out that ToolA is easy to install in Ubuntu Bionic because it is already in the repos, but a nightmare to compile in CentOS 7, which our HPC cluster uses. So the sysadmin decides to create a Docker container image and push it to the company’s registry. He also adds you to the docker group after begging you not to misbehave.

You look up the syntax of the Docker commands and decide to do a few test runs before submitting thousands of jobs that could potentially fail.

$ cd ~/input/files/to/process/samples
$ rm -f *.out
$ ls -l | wc -l
38
$ docker run -d registry.example.com/ToolA:latest file1
e61d12292d69556eabe2a44c16cbd27486b2527e2ce4f95438e504afb7b02810
$ ls -l | wc -l
38
$ ls *out
$

Ah, of course, you forgot to mount the files. Let’s try again.

$ docker run -d -v $(pwd):/mnt registry.example.com/ToolA:latest /mnt/file1
653e785339099e374b57ae3dac5996a98e5e4f393ee0e4adbb795a3935060acb
$ ls -l | wc -l
38
$ ls *out
$
$ docker logs 653e785339
ToolA: /mnt/file1: Permission denied

You ask the sysadmin for help, and he tells you that SELinux is blocking the process from accessing the files and that you’re missing a flag in your docker run. You don’t know what SELinux is, but you remember it mentioned somewhere in the docs, so you look it up and try again:

$ docker run -d -v $(pwd):/mnt:z registry.example.com/ToolA:latest /mnt/file1
8ebfcbcb31bea0696e0a7c38881ae7ea95fa501519c9623e1846d8185972dc3b
$ ls *out
$
$ docker logs 8ebfcbcb31
ToolA: /mnt/file1: Permission denied

You go back to the sysadmin, who tells you that the container uses myuser with UID 1000 by default, but your files are readable only to you, and your UID is different. So you do what you know is bad practice, but you’re fed up: you run chmod 777 file1 before trying again. You’re also getting tired of having to copy and paste hashes, so you add another flag to your docker run:

$ docker run -d –name=test -v $(pwd):/mnt:z registry.example.com/ToolA:latest /mnt/file1
0b61185ef4a78dce988bb30d87e86fafd1a7bbfb2d5aea2b6a583d7ffbceca16
$ ls *out
$
$ docker logs test
ToolA: cannot create regular file ‘/mnt/file1.out’: Permission denied

Alas, at least this time you get a different error. Progress! Your friendly sysadmin tells you that the process in the container won’t have write permissions on your directory because the identities don’t match, and you need more flags on your command line.

$ docker run -d -u $(id -u):$(id -g) –name=test -v $(pwd):/mnt:z registry.example.com/ToolA:latest /mnt/file1
docker: Error response from daemon: Conflict. The container name “/test” is already in use by container “0b61185ef4a78dce988bb30d87e86fafd1a7bbfb2d5aea2b6a583d7ffbceca16”. You have to remove (or rename) that container to be able to reuse that name.
See ‘docker run –help’.
$ docker rm test
$ docker run -d -u $(id -u):$(id -g) –name=test -v $(pwd):/mnt:z registry.example.com/ToolA:latest /mnt/file1
06d5b3d52e1167cde50c2e704d3190ba4b03f6854672cd3ca91043ad23c1fe09
$ ls *out
file1.out
$

Success! Now we just need to wrap our command with the one used by the job scheduler and wrap all of that again with our for loop.

$ cd ~/input/files/to/process
$ ls -l | wc -l
934752984
$ for myfiles in *; do qsub -q short_jobs -N “toola_${myfiles}” docker run -d -u $(id -u):$(id -g) –name=”toola_${myfiles}” -v $(pwd):/mnt:z registry.example.com/ToolA:latest /mnt/${myfiles}; done

Now that was a bit clunky, wasn’t it? Let’s look at how using Singularity simplifies it.

$ cd ~
$ singularity pull –name ToolA.simg docker://registry.example.com/ToolA:latest
$ ls
input ToolA.simg
$ ./ToolA.simg
Usage: ToolA [-o {json|yaml}] <file1> [file2…fileN]
$ cd ~/input/files/to/process
$ for myfiles in *; do qsub -q short_jobs -N “toola_${myfiles}” ~/ToolA.simg ${myfiles}; done

Need I say more?

This works because, by default, Singularity containers run as the user that started them. There are no background daemons, so privilege escalation is not allowed. Singularity also bind-mounts a few directories by default ($PWD$HOME/tmp/proc/sys, and /dev). An administrator can configure additional ones that are also mounted by default on a global (i.e., host) basis, and the end user can (optionally) also bind arbitrary ones at runtime. Of course, standard Unix permissions apply, so this still doesn’t allow unrestricted access to host files.

But what about climate change?

Oh! Of course. Back on topic. We decided to break down the bulk of simulations that we need to run on a per-project basis. Each project can then focus on a specific crop, a specific geographical area, or different crop management techniques. After all of the simulations for a specific project are completed, they are collated into a MariaDB database and visualized using an RStudio Shinyweb app.

shinyappfrontui_nz.png

Prototype Shiny app screenshot

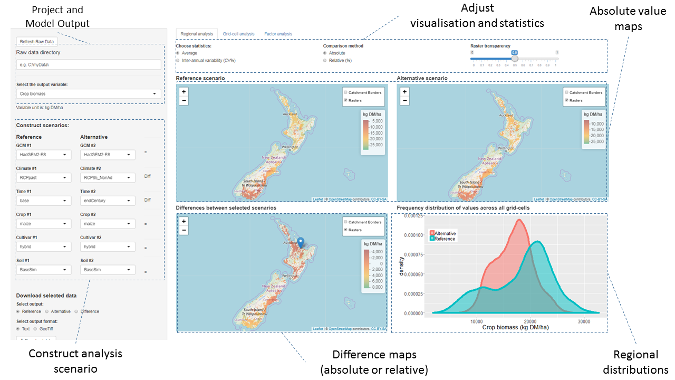
Prototype Shiny app screenshot shows a nationwide run of climate change’s impact on maize silage comparing current and end-of-century scenarios.

The app allows us to compare two different scenarios (reference vs. alternative) that the user can construct by choosing from a combination of variables related to the climate (including the current climate and the climate-change projections for mid-century and end of the century), the soil, and specific management techniques (like irrigation or fertilizer use). The results are displayed as raster values or differences (averages, or coefficients of variation of results per pixel) and their distribution across the area of interest.

The screenshot above shows an example of a prototype nationwide run across “arable lands” where we compare the silage maize biomass for a baseline (1985-2005) vs. future climate change (2085-2100) for the most extreme emissions scenario. In this example, we do not take into account any changes in management techniques, such as adapting sowing dates. We see that most negative effects on yield in the Southern Hemisphere occur in northern areas, while the extreme south shows positive responses. Of course, we would recommend (and you would expect) that farmers start adapting to warm temperatures starting earlier in the year and react accordingly (e.g., sowing earlier, which would reduce the negative impacts and enhance the positive ones).

Next steps

With the framework in place, all that remains is the heavy lifting. Run ALL the simulations! Of course, that is easier said than done. Our in-house cluster is a shared resource where we must compete for capacity with several other projects and teams.

Additional work is planned to further generalize how we distribute jobs across compute resources so we can leverage capacity wherever we can get it (including the public cloud if the project receives sufficient additional funding). This would mean becoming job scheduler-agnostic and solve the data gravity problem.

Work is also underway to further refine the UI and UX aspects of the web application until we are comfortable it can be published to policymakers and other interested parties.

Source

Entroware Launches Hades, Its First AMD-Powered Workstation with Ubuntu Linux

UK-based computer manufacturer Entroware has launched today Hades, their latest and most powerful workstation with Ubuntu Linux.

With Hades, Entroware debut their first AMD-powered system that’s perfect for Deep Learning, a new area of Machine Learning (ML) research, but also for businesses, science labs, and animation studios. Entroware Hades can achieve all that thanks to its 2nd generation AMD Ryzen “Threadripper” processors with up to 64 threads, Nvidia GPUs with up to 11GB memory, and up to 128GB RAM and 68TB storage.

“The Hades workstation is our first AMD system and brings the very best of Linux power, by combining cutting edge components to provide the foundation for the most demanding applications or run even the most demanding Deep Learning projects at lightning speeds with impeccable precision,” says Entroware.

Technical specifications of Entroware Hades

The Entroware Hades workstation can be configured to your needs, and you’ll be able to choose a CPU from AMD Ryzen TR 1900X, 2920X, 2950X, 2970WX, or 2990WX, and RAM from 16GB to 128GB DDR4 2933Mhz or from 32GB to 128GB DDR4 2400 Mhz ECC.

For graphics, you can configure Entroware Hades with 2GB Nvidia GeForce GT 1030, 8GB Nvidia GeForce RTX 2070 or 2080, as well as 11GB Nvidia GeForce RTX 2080 Ti GPUs. For storage, you’ll have up to 2TB SSD for main drive and up to 32TB SSD or up to 64TB HDD for additional drives.

Ports include 2 x USB Hi-Speed 2.0, 2 x USB SuperSpeed 3.0, 1 x USB SuperSpeed 3.0 Type-C, 1 x headphone jack, 1 x microphone jack, 1 x PS/2 keyboard/mouse combo, 8 x USB SuperSpeed 3.1, 1 x USB SuperSpeed 3.1 10Gbps, 1 x USB SuperSpeed 3.1 10Gbps Type-C, 5 x audio jacks, 2 x RJ-45 Gigabit Ethernet, amd 2 x Wi-Fi AC antenna connectors.

Finally, you can choose to have your brand new Entroware Hades workstation shipped with either Ubuntu 18.04 LTS, Ubuntu MATE 18.04 LTS, Ubuntu 18.10, or Ubuntu MATE 18.10. Entroware Hades’ price stars from £1,599.99 and can be delivered to UK, Spain, Italy, France, Germany, and Ireland. More details about Entroware Hades are available on the official website.

Entroware Hades

Entroware Hades

Entroware Hades

Entroware Hades

Entroware Hades

Entroware Hades

Source

A Use Case for Network Automation

A Use Case for Network Automation

""

Use the Python Netmiko module to automate switches, routers and firewalls from multiple vendors.

I frequently find myself in the position of confronting “hostile” networks. By hostile, I mean that there is no existing documentation, or if it does exist, it is hopelessly out of date or being hidden deliberately. With that in mind, in this article, I describe the tools I’ve found useful to recover control, audit, document and automate these networks. Note that I’m not going to try to document any of the tools completely here. I mainly want to give you enough real-world examples to prove how much time and effort you could save with these tools, and I hope this article motivates you to explore the official documentation and example code.

In order to save money, I wanted to use open-source tools to gather information from all the devices on the network. I haven’t found a single tool that works with all the vendors and OS versions that typically are encountered. SNMP could provide a lot the information I need, but it would have to be configured on each device manually first. In fact, the mass enablement of SNMP could be one of the first use cases for the network automation tools described in this article.

Most modern devices support REST APIs, but companies typically are saddled with lots of legacy devices that don’t support anything fancier than Telnet and SSH. I settled on SSH access as the lowest common denominator, as every device must support this in order to be managed on the network.

My preferred automation language is Python, so the next problem was finding a Python module that abstracted the SSH login process, making it easy to run commands and gather command output.

Why Netmiko?

I discovered the Paramiko SSH module quite a few years ago and used it to create real-time inventories of Linux servers at multiple companies. It enabled me to log in to hosts and gather the output of commands, such as lspcidmidecode and lsmod.

The command output populated a database that engineers could use to search for specific hardware. When I then tried to use Paramiko to inventory network switches, I found that certain switch vendor and OS combinations would cause Paramiko SSH sessions to hang. I could see that the SSH login itself was successful, but the session would hang right after the login. I never was able to determine the cause, but I discovered Netmiko while researching the hanging problem. When I replaced all my Paramiko code with Netmiko code, all my session hanging problems went away, and I haven’t looked back since. Netmiko also is optimized for the network device management task, while Paramiko is more of a generic SSH module.

Programmatically Dealing with the Command-Line Interface

People familiar with the “Expect” language will recognize the technique for sending a command and matching the returned CLI prompts and command output to determine whether the command was successful. In the case of most network devices, the CLI prompts change depending on whether you’re in an unprivileged mode, in “enable” mode or in “config” mode.

For example, the CLI prompt typically will be the device hostname followed by specific characters.

Unprivileged mode:


sfo03-r7r9-sw1>

Privileged or “enable” mode:


sfo03-r7r9-sw1#

“Config” mode:


sfo03-r7r9-sw1(config)#

These different prompts enable you to make transitions programmatically from one mode to another and determine whether the transitions were successful.

Abstraction

Netmiko abstracts many common things you need to do when talking to switches. For example, if you run a command that produces more than one page of output, the switch CLI typically will “page” the output, waiting for input before displaying the next page. This makes it difficult to gather multipage output as single blob of text. The command to turn off paging varies depending on the switch vendor. For example, this might be terminal length 0 for one vendor and set cli pager off for another. Netmiko abstracts this operation, so all you need to do is use the disable_paging() function, and it will run the appropriate commands for the particular device.

Dealing with a Mix of Vendors and Products

Netmiko supports a growing list of network vendor and product combinations. You can find the current list in the documentation. Netmiko doesn’t auto-detect the vendor, so you’ll need to specify that information when using the functions. Some vendors have product lines with different CLI commands. For example, Dell has two types: dell_force10 and dell_powerconnect; and Cisco has several CLI versions on the different product lines, including cisco_ioscisco_nxos and cisco_asa.

Obtaining Netmiko

The official Netmiko code and documentation is at https://github.com/ktbyers/netmiko, and the author has a collection of helpful articles on his home page.

If you’re comfortable with developer tools, you can clone the GIT repo directly. For typical end users, installing Netmiko using pip should suffice:


# pip install netmiko

A Few Words of Caution

Before jumping on the network automation bandwagon, you need to sort out the following:

  • Mass configuration: be aware that the slowness of traditional “box-by-box” network administration may have protected you somewhat from massive mistakes. If you manually made a change, you typically would be alerted to a problem after visiting only a few devices. With network automation tools, you can render all your network devices useless within seconds.
  • Configuration backup strategy: this ideally would include a versioning feature, so you can roll back to a specific “known good” point in time. Check out the RANCID package before you spend a lot of money on this capability.
  • Out-of-band network management: almost any modern switch or network device is going to have a dedicated OOB port. This physically separate network permits you to recover from configuration mistakes that potentially could cut you off from the very devices you’re managing.
  • A strategy for testing: for example, have a dedicated pool of representative equipment permanently set aside for testing and proof of concepts. When rolling out a change on a production network, first verify the automation on a few devices before trying to do hundreds at once.

Using Netmiko without Writing Any Code

Netmiko’s author has created several standalone scripts called Netmiko Tools that you can use without writing any Python code. Consult the official documentation for details, as I offer only a few highlights here.

At the time of this writing, there are three tools:

netmiko-show

Run arbitrary “show” commands on one or more devices. By default, it will display the entire configuration, but you can supply an alternate command with the --cmd option. Note that “show” commands can display many details that aren’t stored within the actual device configurations.

For example, you can display Spanning Tree Protocol (STP) details from multiple devices:


% netmiko-show --cmd "show spanning-tree detail" arista-eos |
 ↪egrep "(last change|from)"
sfo03-r1r12-sw1.txt:  Number of topology changes 2307 last
 ↪change occurred 19:14:09 ago
sfo03-r1r12-sw1.txt:          from Ethernet1/10/2
sfo03-r1r12-sw2.txt:  Number of topology changes 6637 last
 ↪change occurred 19:14:09 ago
sfo03-r1r12-sw2.txt:          from Ethernet1/53

This information can be very helpful when tracking down the specific switch and switch port responsible for an STP flapping issue. Typically, you would be looking for a very high count of topology changes that is rapidly increasing, with a “last change time” in seconds. The “from” field gives you the source port of the change, enabling you to narrow down the source of the problem.

The “old-school” method for finding this information would be to log in to the top-most switch, look at its STP detail, find the problem port, log in to the switch downstream of this port, look at its STP detail and repeat this process until you find the source of the problem. The Netmiko Tools allow you to perform a network-wide search for all the information you need in a single operation.

netmiko-cfg

Apply snippets of configurations to one or more devices. Specify the configuration command with the --cmd option or read configuration from a file using --infile. This could be used for mass configurations. Mass changes could include DNS servers, NTP servers, SNMP community strings or syslog servers for the entire network. For example, to configure the read-only SNMP community on all of your Arista switches:


$ netmiko-cfg --cmd "snmp-server community mysecret ro"
 ↪arista-eos

You still will need to verify that the commands you’re sending are appropriate for the vendor and OS combinations of the target devices, as Netmiko will not do all of this work for you. See the “groups” mechanism below for how to apply vendor-specific configurations to only the devices from a particular vendor.

netmiko-grep

Search for a string in the configuration of multiple devices. For example, verify the current syslog destination in your Arista switches:


$ netmiko-grep --use-cache "logging host" arista-eos
sfo03-r2r7-sw1.txt:logging host 10.7.1.19
sfo03-r3r14-sw1.txt:logging host 10.8.6.99
sfo03-r3r16-sw1.txt:logging host 10.8.6.99
sfo03-r4r18-sw1.txt:logging host 10.7.1.19

All of the Netmiko tools depend on an “inventory” of devices, which is a YAML-formatted file stored in “.netmiko.yml” in the current directory or your home directory.

Each device in the inventory has the following format:


sfo03-r1r11-sw1:
  device_type: cisco_ios
  ip: sfo03-r1r11-sw1
  username: netadmin
  password: secretpass
  port: 22

Device entries can be followed by group definitions. Groups are simply a group name followed by a list of devices:


cisco-ios:
  - sfo03-r1r11-sw1
cisco-nxos:
  - sfo03-r1r12-sw2
  - sfo03-r3r17-sw1
arista-eos:
  - sfo03-r1r10-sw2
  - sfo03-r6r6-sw1

For example, you can use the group name “cisco-nxos” to run Cisco Nexus NX-OS-unique commands, such as feature:


% netmiko-cfg --cmd "feature interface-vlan" cisco-nxos

Note that the device type example is just one type of group. Other groups could indicate physical location (“SFO03”, “RKV02”), role (“TOR”, “spine”, “leaf”, “core”), owner (“Eng”, “QA”) or any other categories that make sense to you.

As I was dealing with hundreds of devices, I didn’t want to create the YAML-formatted inventory file by hand. Instead, I started with a simple list of devices and the corresponding Netmiko “device_type”:


sfo03-r1r11-sw1,cisco_ios
sfo03-r1r12-sw2,cisco_nxos
sfo03-r1r10-sw2,arista_eos
sfo03-r4r5-sw3,arista_eos
sfo03-r1r12-sw1,cisco_nxos
sfo03-r5r15-sw2,dell_force10

I then used standard Linux commands to create the YAML inventory file:


% grep -v '^#' simplelist.txt | awk -F, '{printf("%s:\n
 ↪device_type:
%s\n  ip: %s\n  username: netadmin\n  password:
 ↪secretpass\n  port:
22\n",$1,$2,$1)}' >> .netmiko.yml

I’m using a centralized authentication system, so the user name and password are the same for all devices. The command above yields the following YAML-formatted file:


sfo03-r1r11-sw1:
  device_type: cisco_ios
  ip: sfo03-r1r11-sw1
  username: netadmin
  password: secretpass
  port: 22
sfo03-r1r12-sw2:
  device_type: cisco_nxos
  ip: sfo03-r1r12-sw2
  username: netadmin
  password: secretpass
  port: 22
sfo03-r1r10-sw2:
  device_type: arista_eos
  ip: sfo03-r1r10-sw2
  username: netadmin
  password: secretpass
  port: 22

Once you’ve created this inventory, you can use the Netmiko Tools against individual devices or groups of devices.

A side effect of creating the inventory is that you now have a master list of devices on the network; you also have proven that the device names are resolvable via DNS and that you have the correct login credentials. This is actually a big step forward in some environments where I’ve worked.

Note that netmiko-grep caches the device configs locally. Once the cache has been built, you can make subsequent search operations run much faster by specifying the --use-cache option.

It now should be apparent that you can use Netmiko Tools to do a lot of administration and automation without writing any Python code. Again, refer to official documentation for all the options and more examples.

Start Coding with Netmiko

Now that you have a sense of what you can do with Netmiko Tools, you’ll likely come up with unique scenarios that require actual coding.

For the record, I don’t consider myself an advanced Python programmer at this time, so the examples here may not be optimal. I’m also limiting my examples to snippets of code rather than complete scripts. The example code is using Python 2.7.

My Approach to the Problem

I wrote a bunch of code before I became aware of the Netmiko Tools commands, and I found that I’d duplicated a lot of their functionality. My original approach was to break the problem into two separate phases. The first phase was the “scanning” of the switches and storing their configurations and command output locally, The second phase was processing and searching across the stored data.

My first script was a “scanner” that reads a list of switch hostnames and Netmiko device types from a simple text file, logs in to each switch, runs a series of CLI commands and then stores the output of each command in text files for later processing.

Reading a List of Devices

My first task is to read a list of network devices and their Netmiko “device type” from a simple text file in the CSV format. I include the csv module, so I can use the csv.Dictreader function, which returns CSV fields as a Python dictionary. I like the CSV file format, as anyone with limited UNIX/Linux skills likely knows how to work with it, and it’s a very common file type for exporting data if you have an existing database of network devices.

For example, the following is a list of switch names and device types in CSV format:


sfo03-r1r11-sw1,cisco_ios
sfo03-r1r12-sw2,cisco_nxos
sfo03-r1r10-sw2,arista_eos
sfo03-r4r5-sw3,arista_eos
sfo03-r1r12-sw1,cisco_nxos
sfo03-r5r15-sw2,dell_force10

The following Python code reads the data filename from the command line, opens the file and then iterates over each device entry, calling the login_switch() function that will run the actual Netmiko code:


import csv
import sys
import logging
def main():
# get data file from command line
   devfile = sys.argv[1]
# open file and extract the two fields
   with open(devfile,'rb') as devicesfile:
       fields = ['hostname','devtype']
       hosts = csv.DictReader(devicesfile,fieldnames=fields,
↪delimiter=',')
# iterate through list of hosts, calling "login_switch()"
# for each one
       for host in hosts:
           hostname = host['hostname']
           print "hostname = ",hostname
           devtype = host['devtype']
           login_switch(hostname,devtype)

The login_switch() function runs any number of commands and stores the output in separate text files under a directory based on the name of the device:


# import required module
from netmiko import ConnectHandler
# login into switch and run command
def login_switch(host,devicetype):
# required arguments to ConnectHandler
    device = {
# device_type and ip are read from data file
    'device_type': devicetype,
    'ip':host,
# device credentials are hardcoded in script for now
    'username':'admin',
    'password':'secretpass',
    }
# if successful login, run command on CLI
    try:
        net_connect = ConnectHandler(**device)
        commands = "show version"
        output = net_connect.send_command(commands)
# construct directory path based on device name
        path = '/root/login/scan/' + host + "/"
        make_dir(path)
        filename = path + "show_version"
# store output of command in file
        handle = open (filename,'w')
        handle.write(output)
        handle.close()
# if unsuccessful, print error
    except Exception as e:
        print "RAN INTO ERROR "
        print "Error: " + str(e)

This code opens a connection to the device, executes the show version command and stores the output in /root/login/scan/<devicename>/show_version.

The show version output is incredible useful, as it typically contains the vendor, model, OS version, hardware details, serial number and MAC address. Here’s an example from an Arista switch:


Arista DCS-7050QX-32S-R
Hardware version:    01.31
Serial number:       JPE16292961
System MAC address:  444c.a805.6921

Software image version: 4.17.0F
Architecture:           i386
Internal build version: 4.17.0F-3304146.4170F
Internal build ID:      21f25f02-5d69-4be5-bd02-551cf79903b1

Uptime:                 25 weeks, 4 days, 21 hours and 32
                        minutes
Total memory:           3796192 kB
Free memory:            1230424 kB

This information allows you to create all sorts of good stuff, such as a hardware inventory of your network and a software version report that you can use for audits and planned software updates.

My current script runs show lldp neighborsshow runshow interface status and records the device CLI prompt in addition to show version.

The above code example constitutes the bulk of what you need to get started with Netmiko. You now have a way to run arbitrary commands on any number of devices without typing anything by hand. This isn’t Software-Defined Networking (SDN) by any means, but it’s still a huge step forward from the “box-by-box” method of network administration.

Next, let’s try the scanning script on the sample network:


$ python scanner.py devices.csv
hostname = sfo03-r1r15-sw1
hostname = sfo03-r3r19-sw0
hostname = sfo03-r1r16-sw2
hostname = sfo03-r3r8-sw2
RAN INTO ERROR
Error: Authentication failure: unable to connect dell_force10
 ↪sfo03-r3r8-sw2:22
Authentication failed.
hostname = sfo03-r3r10-sw2
hostname = sfo03-r3r11-sw1
hostname = sfo03-r4r14-sw2
hostname = sfo03-r4r15-sw1

If you have a lot of devices, you’ll likely experience login failures like the one in the middle of the scan above. These could be due to multiple reasons, including the device being down, being unreachable over the network, the script having incorrect credentials and so on. Expect to make several passes to address all the problems before you get a “clean” run on a large network.

This finishes the “scanning” portion of process, and all the data you need is now stored locally for further analysis in the “scan” directory, which contains subdirectories for each device:


$ ls scan/
sfo03-r1r10-sw2 sfo03-r2r14-sw2 sfo03-r3r18-sw1 sfo03-r4r8-sw2
 ↪sfo03-r6r14-sw2
sfo03-r1r11-sw1 sfo03-r2r15-sw1 sfo03-r3r18-sw2 sfo03-r4r9-sw1
 ↪sfo03-r6r15-sw1
sfo03-r1r12-sw0 sfo03-r2r16-sw1 sfo03-r3r19-sw0 sfo03-r4r9-sw2
 ↪sfo03-r6r16-sw1
sfo03-r1r12-sw1 sfo03-r2r16-sw2 sfo03-r3r19-sw1 sfo03-r5r10-sw1
 ↪sfo03-r6r16-sw2
sfo03-r1r12-sw2 sfo03-r2r2-sw1  sfo03-r3r4-sw2  sfo03-r5r10-sw2
 ↪sfo03-r6r17- sw1

You can see that each subdirectory contains separate files for each command output:


$ ls sfo03-r1r10-sw2/
show_lldp prompt show_run show_version show_int_status

Debugging via Logging

Netmiko normally is very quiet when it’s running, so it’s difficult to tell where things are breaking in the interaction with a network device. The easiest way I have found to debug problems is to use the logging module. I normally keep this disabled, but when I want to turn on debugging, I uncomment the line starting with logging.basicConfig line below:


import logging
if __name__ == "__main__":
#  logging.basicConfig(level=logging.DEBUG)
  main()

Then I run the script, and it produces output on the console showing the entire SSH conversation between the netmiko module and the remote device (a switch named “sfo03-r1r10-sw2” in this example):


DEBUG:netmiko:In disable_paging
DEBUG:netmiko:Command: terminal length 0
DEBUG:netmiko:write_channel: terminal length 0
DEBUG:netmiko:Pattern is: sfo03\-r1r10\-sw2
DEBUG:netmiko:_read_channel_expect read_data: terminal
 ↪length 0
DEBUG:netmiko:_read_channel_expect read_data: Pagination
disabled.
sfo03-r1r10-sw2#
DEBUG:netmiko:Pattern found: sfo03\-r1r10\-sw2 terminal
 ↪length 0
Pagination disabled.
sfo03-r1r10-sw2#
DEBUG:netmiko:terminal length 0
Pagination disabled.
sfo03-r1r10-sw2#
DEBUG:netmiko:Exiting disable_paging

In this case, the terminal length 0 command sent by Netmiko is successful. In the following example, the command sent to change the terminal width is rejected by the switch CLI with the “Authorization denied” message:


DEBUG:netmiko:Entering set_terminal_width
DEBUG:netmiko:write_channel: terminal width 511
DEBUG:netmiko:Pattern is: sfo03\-r1r10\-sw2
DEBUG:netmiko:_read_channel_expect read_data: terminal
 ↪width 511
DEBUG:netmiko:_read_channel_expect read_data: % Authorization
denied for command 'terminal width 511'
sfo03-r1r10-sw2#
DEBUG:netmiko:Pattern found: sfo3\-r1r10\-sw2 terminal
 ↪width 511
% Authorization denied for command 'terminal width 511'
sfo03-r1r10-sw2#
DEBUG:netmiko:terminal width 511
% Authorization denied for command 'terminal width 511'
sfo03-r1r10-sw2#
DEBUG:netmiko:Exiting set_terminal_width

The logging also will show the entire SSH login and authentication sequence in detail. I had to deal with one switch that was using a depreciated SSH cypher that was disabled by default in the SSH client, causing the SSH session to fail when trying to authenticate. With logging, I could see the client rejecting the cypher being offered by the switch. I also discovered another type of switch where the Netmiko connection appeared to hang. The logging revealed that it was stuck at the more? prompt, as the paging was never disabled successfully after login. On this particular switch, the commands to disable paging had to be run in a privileged mode. My quick fix was add a disable_paging() function after the “enable” mode was entered.

Analysis Phase

Now that you have all the data you want, you can start processing it.

A very simple example would be an “audit”-type of check, which verifies that hostname registered in DNS matches the hostname configured in the device. If these do not match, it will cause all sorts of confusion when logging in to the device, correlating syslog messages or looking at LLDP and CPD output:


import os
import sys
directory = "/root/login/scan"
for filename in os.listdir(directory):
    prompt_file = directory + '/' + filename + '/prompt'
    try:
         prompt_fh = open(prompt_file,'rb')
    except IOError:
         "Can't open:", prompt_file
         sys.exit()

    with prompt_fh:
        prompt = prompt_fh.read()
        prompt = prompt.rstrip('#')
        if (filename != prompt):
            print 'switch DNS hostname %s != configured
             ↪hostname %s' %(filename, prompt)

This script opens the scan directory, opens each “prompt” file, derives the configured hostname by stripping off the “#” character, compares it with the subdirectory filename (which is the hostname according to DNS) and prints a message if they don’t match. In the example below, the script finds one switch where the DNS switch name doesn’t match the hostname configured on the switch:


$ python name_check.py
switch DNS hostname sfo03-r1r12-sw2 != configured hostname
 ↪SFO03-R1R10-SW1-Cisco_Core

It’s a reality that most complex networks are built up over a period of years by multiple people with different naming conventions, work styles, skill sets and so on. I’ve accumulated a number of “audit”-type checks that find and correct inconsistencies that can creep into a network over time. This is the perfect use case for network automation, because you can see everything at once, as opposed going through each device, one at a time.

Performance

During the initial debugging, I had the “scanning” script log in to each switch in a serial fashion. This worked fine for a few switches, but performance became a problem when I was scanning hundreds at a time. I used the Python multiprocessing module to fire off a bunch of “workers” that interacted with switches in parallel. This cut the processing time for the scanning portion down to a couple minutes, as the entire scan took only as long as the slowest switch took to complete. The switch scanning problem fits quite well into the multiprocessing model, because there are no events or data to coordinate between the individual workers. The Netmiko Tools also take advantage of multiprocessing and use a cache system to improve performance.

Future Directions

The most complicated script I’ve written so far with Netmiko logs in to every switch, gathers the LLDP neighbor info and produces a text-only topology map of the entire network. For those that are unfamiliar with LLDP, this is the Link Layer Discovery Protocol. Most modern network devices are sending LLDP multicasts out every port every 30 seconds. The LLDP data includes many details, including the switch hostname, port name, MAC address, device model, vendor, OS and so on. It allows any given device to know about all its immediate neighbors.

For example, here’s a typical LLDP display on a switch. The “Neighbor” columns show you details on what is connected to each of your local ports:


sfo03-r1r5-sw1# show lldp neighbors
Port  Neighbor Device ID   Neighbor Port ID   TTL
Et1   sfo03-r1r3-sw1         Ethernet1          120
Et2   sfo03-r1r3-sw2         Te1/0/2            120
Et3   sfo03-r1r4-sw1         Te1/0/2            120
Et4   sfo03-r1r6-sw1         Ethernet1          120
Et5   sfo03-r1r6-sw2         Te1/0/2            120

By asking all the network devices for their list of LLDP neighbors, it’s possible to build a map of the network. My approach was to build a list of local switch ports and their LLDP neighbors for the top-level switch, and then recursively follow each switch link down the hierarchy of switches, adding each entry to a nested dictionary. This process becomes very complex when there are redundant links and endless loops to avoid, but I found it a great way to learn more about complex Python data structures.

The following output is from my “mapper” script. It uses indentation (from left to right) to show the hierarchy of switches, which is three levels deep in this example:


sfo03-r1r5-core:Et6  sfo03-r1r8-sw1:Ethernet1
    sfo03-r1r8-sw1:Et22 sfo03-r6r8-sw3:Ethernet48
    sfo03-r1r8-sw1:Et24 sfo03-r6r8-sw2:Te1/0/1
    sfo03-r1r8-sw1:Et25 sfo03-r3r7-sw2:Te1/0/1
    sfo03-r1r8-sw1:Et26 sfo03-r3r7-sw1:24

It prints the port name next to the switch hostname, which allows you to see both “sides” of the inter-switch links. This is extremely useful when trying to orient yourself on the network. I’m still working on this script, but it currently produces a “real-time” network topology map that can be turned into a network diagram.

I hope this information inspires you to investigate network automation. Start with Netmiko Tools and the inventory file to get a sense of what is possible. You likely will encounter a scenario that requires some Python coding, either using the output of Netmiko Tools or perhaps your own standalone script. Either way, the Netmiko functions make automating a large, multivendor network fairly easy.

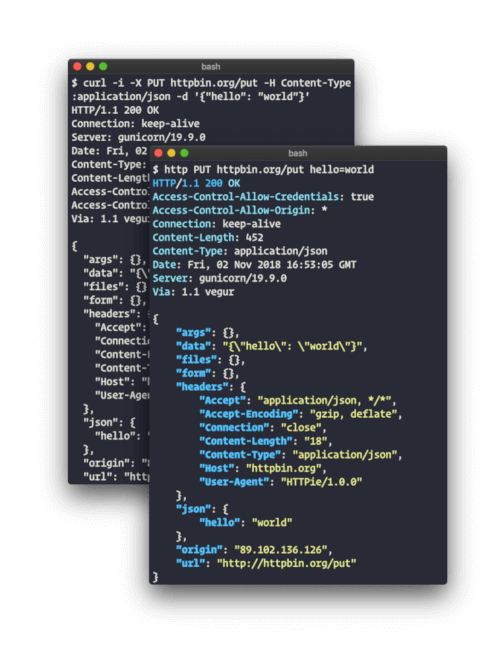
Source

WP2Social Auto Publish Powered By : XYZScripts.com