Bash 5.0 Released with New Features

Bash 5.0 Released with New Features

Last updated January 9, 2019

The mailing list confirmed the release of Bash-5.0 recently. And, it is exciting to know that it comes baked with new features and variable.

Well, if you’ve been using Bash 4.4.XX, you will definitely love the fifth major release of Bash.

The fifth release focuses on new shell variables and a lot of major bug fixes with an overhaul. It also introduces a couple of new features along with some incompatible changes between bash-4.4 and bash-5.0.

Bash logo

What about the new features?

The mailing list explains the bug fixed in this new release:

This release fixes several outstanding bugs in bash-4.4 and introduces several new features. The most significant bug fixes are an overhaul of how nameref variables resolve and a number of potential out-of-bounds memory errors discovered via fuzzing. There are a number of changes to the expansion of [email protected] and $* in various contexts where word splitting is not performed to conform to a Posix standard interpretation, and additional changes to resolve corner cases for Posix conformance.

It also introduces some new features. As per the release note, these are the most notable new features are several new shell variables:

The BASH_ARGV0, EPOCHSECONDS, and EPOCHREALTIME. The ‘history’ builtin can remove ranges of history entries and understands negative arguments as offsets from the end of the history list. There is an option to allow local variables to inherit the value of a variable with the same name at a preceding scope. There is a new shell option that, when enabled, causes the shell to attempt to expand associative array subscripts only once (this is an issue when they are used in arithmetic expressions). The ‘globasciiranges‘ shell option is now enabled by default; it can be set to off by default at configuration time.

What about the changes between Bash-4.4 and Bash-5.0?

The update log mentioned about the incompatible changes and the supported readline version history. Here’s what it said:

There are a few incompatible changes between bash-4.4 and bash-5.0. The changes to how nameref variables are resolved means that some uses of namerefs will behave differently, though I have tried to minimize the compatibility issues. By default, the shell only sets BASH_ARGC and BASH_ARGV at startup if extended debugging mode is enabled; it was an oversight that it was set unconditionally and caused performance issues when scripts were passed large numbers of arguments.

Bash can be linked against an already-installed Readline library rather than the private version in lib/readline if desired. Only readline-8.0 and later versions are able to provide all of the symbols that bash-5.0 requires; earlier versions of the Readline library will not work correctly.

I believe some of the features/variables added are very useful. Some of my favorites are:

  • There is a new (disabled by default, undocumented) shell option to enable and disable sending history to syslog at runtime.
  • The shell doesn’t automatically set BASH_ARGC and BASH_ARGV at startup unless it’s in debugging mode, as the documentation has always said, but will dynamically create them if a script references them at the top level without having enabled debugging mode.
  • The ‘history’ can now delete ranges of history entries using ‘-d start-end’.
  • If a non-interactive shell with job control enabled detects that a foreground job died due to SIGINT, it acts as if it received the SIGINT.
  • BASH_ARGV0: a new variable that expands to $0 and sets $0 on assignment.

To check the complete list of changes and features you should refer to the Mailing list post.

Wrapping Up

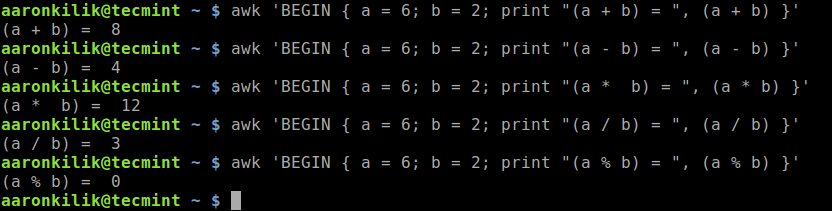
You can check your current Bash version, using this command:

bash –version

It’s more likely that you’ll have Bash 4.4 installed. If you want to get the new version, I would advise waiting for your distribution to provide it.

With Bash-5.0 available, what do you think about it? Are you using any alternative to bash? If so, would this update change your mind?

Let us know your thoughts in the comments below.


Source

5 Useful Ways to Do Arithmetic in Linux Terminal

In this article, we will show you various useful ways of doing arithmetic’s in the Linux terminal. By the end of this article, you will learn basic different practical ways of doing mathematical calculations in the command line.

Let’s get started!

1. Using Bash Shell

The first and easiest way do basic math on the Linux CLI is a using double parenthesis. Here are some examples where we use values stored in variables:

$ ADD=$(( 1 + 2 ))
$ echo $ADD
$ MUL=$(( $ADD * 5 ))
$ echo $MUL
$ SUB=$(( $MUL - 5 ))
$ echo $SUB
$ DIV=$(( $SUB / 2 ))
$ echo $DIV
$ MOD=$(( $DIV % 2 ))
$ echo $MOD
Arithmetic in Linux Bash Shell

Arithmetic in Linux Bash Shell

2. Using expr Command

The expr command evaluates expressions and prints the value of provided expression to standard output. We will look at different ways of using expr for doing simple math, making comparison, incrementing the value of a variable and finding the length of a string.

The following are some examples of doing simple calculations using the expr command. Note that many operators need to be escaped or quoted for shells, for instance the * operator (we will look at more under comparison of expressions).

$ expr 3 + 5
$ expr 15 % 3
$ expr 5 \* 3
$ expr 5 – 3
$ expr 20 / 4
Basic Arithmetic Using expr Command in Linux

Basic Arithmetic Using expr Command in Linux

Next, we will cover how to make comparisons. When an expression evaluates to false, expr will print a value of 0, otherwise it prints 1.

Let’s look at some examples:

$ expr 5 = 3
$ expr 5 = 5
$ expr 8 != 5
$ expr 8 \> 5
$ expr 8 \< 5
$ expr 8 \<= 5
Comparing Arithmetic Expressions in Linux

Comparing Arithmetic Expressions in Linux

You can also use the expr command to increment the value of a variable. Take a look at the following example (in the same way, you can also decrease the value of a variable).

$ NUM=$(( 1 + 2))
$ echo $NUM
$ NUM=$(expr $NUM + 2)
$ echo $NUM
Increment Value of a Variable

Increment Value of a Variable

Let’s also look at how to find the length of a string using:

$ expr length "This is Tecmint.com"
Find Length of a String

Find Length of a String

For more information especially on the meaning of the above operators, see the expr man page:

$ man expr

3. Using bc Command

bc (Basic Calculator) is a command-line utility that provides all features you expect from a simple scientific or financial calculator. It is specifically useful for doing floating point math.

If bc command not installed, you can install it using:

$ sudo apt install bc   #Debian/Ubuntu
$ sudo yum install bc   #RHEL/CentOS
$ sudo dnf install bc   #Fedora 22+

Once installed, you can run it in interactive mode or non-interactively by passing arguments to it – we will look at both case. To run it interactively, type the command bc on command prompt and start doing some math, as shown.

$ bc 
Start bc in Non-Interactive Mode

Start bc in Non-Interactive Mode

The following examples show how to use bc non-interactively on the command-line.

$ echo '3+5' | bc
$ echo '15 % 2' | bc
$ echo '15 / 2' | bc
$ echo '(6 * 2) - 5' | bc
Do Math Using bc in Linux

Do Math Using bc in Linux

The -l flag is used to the default scale (digits after the decimal point) to 20, for example:

$ echo '12/5 | bc'
$ echo '12/5 | bc -l'
Do Math with Floating Numbers

Do Math with Floating Numbers

4. Using Awk Command

Awk is one of the most prominent text-processing programs in GNU/Linux. It supports the addition, subtraction, multiplication, division, and modulus arithmetic operators. It is also useful for doing floating point math.

You can use it to do basic math as shown.

$ awk 'BEGIN { a = 6; b = 2; print "(a + b) = ", (a + b) }'
$ awk 'BEGIN { a = 6; b = 2; print "(a - b) = ", (a - b) }'
$ awk 'BEGIN { a = 6; b = 2; print "(a *  b) = ", (a * b) }'
$ awk 'BEGIN { a = 6; b = 2; print "(a / b) = ", (a / b) }'
$ awk 'BEGIN { a = 6; b = 2; print "(a % b) = ", (a % b) }'
Do Basic Math Using Awk Command

Do Basic Math Using Awk Command

If you are new to Awk, we have a complete series of guides to get you started with learning it: Learn Awk Text Processing Tool.

5. Using factor Command

The factor command is use to decompose an integer into prime factors. For example:

$ factor 10
$ factor 127
$ factor 222
$ factor 110  
Factor a Number in Linux

Factor a Number in Linux

That’s all! In this article, we have explained various useful ways of doing arithmetic’s in the Linux terminal. Feel free to ask any questions or share any thoughts about this article via the feedback form below.

Source

Backup and Restore Ubuntu Applications using Aptik

How can Aptik Help?

With Aptik, you can do the following backups only through a click or two:

  • Launchpad PPAs from your current system and restore them to the new system
  • All installed software from your current system and restore them to the new system
  • Apt-cache downloaded packages from your current system and restore them to the new system
  • App configurations from your current system and restore them to the new system
  • Your home directory including the configuration files and restore them to the new system
  • Themes and icons from the /usr/share director and restore them to the new system
  • Backup selective items from your system through one-click and restore them to your new system

In this article, we will explain how you can install Aptik command line and Aptik GTK(UI tool) to your Ubuntu through the command line. We will then tell you how to backup your stuff from the old system and restore it to your new Ubuntu. In the end, we will also explain how you can uninstall Aptik from your system if you want to remove it from your new system after restoring your applications and other useful stuff.

We have run the commands and procedures mentioned in this article on a Ubuntu 18.04 LTS system.

Installing Aptik and Aptik GTK

We will be installing Aptik CLI and Aptik GTK through the Ubuntu command line, the Terminal. You can open the Terminal application either through the system Dash or the Ctrl+Alt+T shortcut.

First add the PPA repository, through which we will be installing Aptik, by using the following command:

$ sudo apt-add-repository -y ppa:teejee2008/ppa

Add Aptik Ubuntu Repository

Please note that only an authorized user can add/remove and update software on Ubuntu.

Now update your system’s repository index with that of the Internet by entering the following command as sudo:

$ sudo apt-get update

Update package lists

Finally, enter the following command in order to install Aptik:

$ sudo apt-get install aptik

Install Aptik

The system will prompt you with a Y/n option to confirm installation. Please enter Y and then hit Enter to continue after which Aptik will be installed on your system.

Once done, you can check which version of Aptik is installed on your system by running the following command:

$ aptik --version

Check Aptik version

Similarly, you can install the graphics utility of Aptik, Aptik GTK, through the following command as sudo:

$ sudo apt-get install aptik-gtk

Install aptik-gtk

Launch and Use Aptik GTK

If you want to launch the Aptik GT through the command line, simply enter the following command:

$ aptik-gtk

Run Aptik GTK

You can also launch it through the UI by either searching for it through the system Dash or access it from the Ubuntu Applications list.

Locate Aptik application

Every time you launch this application, you will be required to provide authentication for superuser as only an authorized user can run /bin/bash.

Authenticate as admin user

Provide the password for the superuser and then click the Authenticate button. This will open the Aptik application for you in the following view:

Configure Aprik backup mode and location

Backup

If you want to backup stuff from your current system, select the Backup option under Backup Mode. Then provide a valid path to which you want to backup your apps, PPA and other stuff.

Set backup Location

Next is to select the Backup tab from the left pane:

What shall be backed up

On this view, you can see a lot of stuff that you can back up. Select your choices one by one or click the Backup all Items button in order to backup all options that are mentioned.

Restore

From your new system, open Aptik GTK, select the Restore option under Backup Option. Then provide a valid path from where you want to restore stuff on your new system:

Restore Mode

Next is to select the Restore tab from the left pane:

Restore settings

From this view, select all the stuff you want to restore to your new computer or else click the Restore All Items button to restore everything that you backed up from your previous system.

Using Aptik CLI

If you want to backup or restore stuff through the command line, the Aptik help can be really useful. Use one of the following commands to list the detailed help on Aptik:

$ aptik
$ aptik --help

Aptik commandline options

Uninstall Aptik and Aptik GTK

When you no longer need Aptik, you can use the following apt-get commands to remove Aptik and Aptik GTK:

$ sudo apt-get remove aptik
$ sudo apt-get remove aptik-gtk

And

$ sudo apt-get autoremove

After reading this article, you are now capable of securely transporting useful applications, PPAs and some other application related data from your current Ubuntu system to your new one. Through the very simple installation procedure and then a few clicks for selecting what you want to backup/restore, you can save a lot of time and effort when switching to new systems.

Source

Linux Commands for Measuring Disk Activity | Linux.com

Linux commands for measuring disk activity

Linux systems provide a handy suite of commands for helping you see how busy your disks are, not just how full. In this post, we examine five very useful commands for looking into disk activity. Two of the commands (iostat and ioping) may have to be added to your system, and these same two commands require you to use sudo privileges, but all five commands provide useful ways to view disk activity.

Probably one of the easiest and most obvious of these commands is dstat.

dtstat

In spite of the fact that the dstat command begins with the letter “d”, it provides stats on a lot more than just disk activity. If you want to view just disk activity, you can use the -d option. As shown below, you’ll get a continuous list of disk read/write measurements until you stop the display with a ^c. Note that after the first report, each subsequent row in the display will report disk activity in the following time interval, and the default is only one second.

$ dstat -d
-dsk/total-
 read  writ
 949B   73k
  65k     0    <== first second
   0    24k    <== second second
   0    16k
   0	0 ^C

Including a number after the -d option will set the interval to that number of seconds.

$ dstat -d 10
-dsk/total-
 read  writ
 949B   73k
  65k   81M    <== first five seconds
   0    21k    <== second five second
   0  9011B ^C

Notice that the reported data may be shown in a number of different units — e.g., M (megabytes), k (kilobytes), and B (bytes).

Without options, the dstat command is going to show you a lot of other information as well — indicating how the CPU is spending its time, displaying network and paging activity, and reporting on interrupts and context switches.

$ dstat
You did not select any stats, using -cdngy by default.
--total-cpu-usage-- -dsk/total- -net/total- ---paging-- ---system--
usr sys idl wai stl| read  writ| recv  send|  in   out | int   csw
  0   0 100   0   0| 949B   73k|   0     0 |   0     3B|  38    65
  0   0 100   0   0|   0     0 | 218B  932B|   0     0 |  53    68
  0   1  99   0   0|   0    16k|  64B  468B|   0     0 |  64    81 ^C

The dstat command provides valuable insights into overall Linux system performance, pretty much replacing a collection of older tools, such as vmstat, netstat, iostat, and ifstat, with a flexible and powerful command that combines their features. For more insight into the other information that the dstat command can provide, refer to this post on the dstat command.

iostat

The iostat command helps monitor system input/output device loading by observing the time the devices are active in relation to their average transfer rates. It’s sometimes used to evaluate the balance of activity between disks.

$ iostat
Linux 4.18.0-041800-generic (butterfly)         12/26/2018      _x86_64_       (2 CPU)

avg-cpu:  %user   %nice %system %iowait  %steal   %idle
           0.07    0.01    0.03    0.05    0.00   99.85

Device             tps    kB_read/s    kB_wrtn/s    kB_read    kB_wrtn
loop0             0.00         0.00         0.00       1048          0
loop1             0.00         0.00         0.00        365          0
loop2             0.00         0.00         0.00       1056          0
loop3             0.00         0.01         0.00      16169          0
loop4             0.00         0.00         0.00        413          0
loop5             0.00         0.00         0.00       1184          0
loop6             0.00         0.00         0.00       1062          0
loop7             0.00         0.00         0.00       5261          0
sda               1.06         0.89        72.66    2837453  232735080
sdb               0.00         0.02         0.00      48669         40
loop8             0.00         0.00         0.00       1053          0
loop9             0.01         0.01         0.00      18949          0
loop10            0.00         0.00         0.00         56          0
loop11            0.00         0.00         0.00       7090          0
loop12            0.00         0.00         0.00       1160          0
loop13            0.00         0.00         0.00        108          0
loop14            0.00         0.00         0.00       3572          0
loop15            0.01         0.01         0.00      20026          0
loop16            0.00         0.00         0.00         24          0

Of course, all the stats provided on Linux loop devices can clutter the display when you want to focus solely on your disks. The command, however, does provide the -p option, which allows you to just look at your disks — as shown in the commands below.

$ iostat -p sda
Linux 4.18.0-041800-generic (butterfly)         12/26/2018      _x86_64_        (2 CPU)

avg-cpu:  %user   %nice %system %iowait  %steal   %idle
           0.07    0.01    0.03    0.05    0.00   99.85

Device             tps    kB_read/s    kB_wrtn/s    kB_read    kB_wrtn
sda               1.06         0.89        72.54    2843737  232815784
sda1              1.04         0.88        72.54    2821733  232815784

Note that tps refers to transfers per second.

You can also get iostat to provide repeated reports. In the example below, we’re getting measurements every five seconds by using the -d option.

$ iostat -p sda -d 5
Linux 4.18.0-041800-generic (butterfly)         12/26/2018      _x86_64_        (2 CPU)

Device             tps    kB_read/s    kB_wrtn/s    kB_read    kB_wrtn
sda               1.06         0.89        72.51    2843749  232834048
sda1              1.04         0.88        72.51    2821745  232834048

Device             tps    kB_read/s    kB_wrtn/s    kB_read    kB_wrtn
sda               0.80         0.00        11.20          0         56
sda1              0.80         0.00        11.20          0         56

If you prefer to omit the first (stats since boot) report, add a -y to your command.

$ iostat -p sda -d 5 -y
Linux 4.18.0-041800-generic (butterfly)         12/26/2018      _x86_64_        (2 CPU)

Device             tps    kB_read/s    kB_wrtn/s    kB_read    kB_wrtn
sda               0.80         0.00        11.20          0         56
sda1              0.80         0.00        11.20          0         56

Next, we look at our second disk drive.

$ iostat -p sdb
Linux 4.18.0-041800-generic (butterfly)         12/26/2018      _x86_64_        (2 CPU)

avg-cpu:  %user   %nice %system %iowait  %steal   %idle
           0.07    0.01    0.03    0.05    0.00   99.85

Device             tps    kB_read/s    kB_wrtn/s    kB_read    kB_wrtn
sdb               0.00         0.02         0.00      48669         40
sdb2              0.00         0.00         0.00       4861         40
sdb1              0.00         0.01         0.00      35344          0

iotop

The iotop command is top-like utility for looking at disk I/O. It gathers I/O usage information provided by the Linux kernel so that you can get an idea which processes are most demanding in terms in disk I/O. In the example below, the loop time has been set to 5 seconds. The display will update itself, overwriting the previous output.

$ sudo iotop -d 5
Total DISK READ:         0.00 B/s | Total DISK WRITE:      1585.31 B/s
Current DISK READ:       0.00 B/s | Current DISK WRITE:      12.39 K/s
  TID  PRIO  USER     DISK READ  DISK WRITE  SWAPIN     IO>    COMMAND
32492 be/4 root        0.00 B/s    0.00 B/s  0.00 %  0.12 % [kworker/u8:1-ev~_power_efficient]
  208 be/3 root        0.00 B/s 1585.31 B/s  0.00 %  0.11 % [jbd2/sda1-8]
    1 be/4 root        0.00 B/s    0.00 B/s  0.00 %  0.00 % init splash
    2 be/4 root        0.00 B/s    0.00 B/s  0.00 %  0.00 % [kthreadd]
    3 be/0 root        0.00 B/s    0.00 B/s  0.00 %  0.00 % [rcu_gp]
    4 be/0 root        0.00 B/s    0.00 B/s  0.00 %  0.00 % [rcu_par_gp]
    8 be/0 root        0.00 B/s    0.00 B/s  0.00 %  0.00 % [mm_percpu_wq]

ioping

The ioping command is an altogether different type of tool, but it can report disk latency — how long it takes a disk to respond to requests — and can be helpful in diagnosing disk problems.

$ sudo ioping /dev/sda1
4 KiB <<< /dev/sda1 (block device 111.8 GiB): request=1 time=960.2 us (warmup)
4 KiB <<< /dev/sda1 (block device 111.8 GiB): request=2 time=841.5 us
4 KiB <<< /dev/sda1 (block device 111.8 GiB): request=3 time=831.0 us
4 KiB <<< /dev/sda1 (block device 111.8 GiB): request=4 time=1.17 ms
^C
--- /dev/sda1 (block device 111.8 GiB) ioping statistics ---
3 requests completed in 2.84 ms, 12 KiB read, 1.05 k iops, 4.12 MiB/s
generated 4 requests in 3.37 s, 16 KiB, 1 iops, 4.75 KiB/s
min/avg/max/mdev = 831.0 us / 947.9 us / 1.17 ms / 158.0 us

atop

The atop command, like top provides a lot of information on system performance, including some stats on disk activity.

ATOP - butterfly      2018/12/26  17:24:19      37d3h13m------ 10ed
PRC | sys    0.03s | user   0.01s | #proc    179 | #zombie    0 | #exit      6 |
CPU | sys       1% | user      0% | irq       0% | idle    199% | wait      0% |
cpu | sys       1% | user      0% | irq       0% | idle     99% | cpu000 w  0% |
CPL | avg1    0.00 | avg5    0.00 | avg15   0.00 | csw      677 | intr     470 |
MEM | tot     5.8G | free  223.4M | cache   4.6G | buff  253.2M | slab  394.4M |
SWP | tot     2.0G | free    2.0G |              | vmcom   1.9G | vmlim   4.9G |
DSK |          sda | busy      0% | read       0 | write      7 | avio 1.14 ms |
NET | transport    | tcpi 4 | tcpo  stall      8 | udpi 1 | udpo 0swout   2255 |
NET | network      | ipi       10 | ipo 7 | ipfrw      0 | deliv      60.67 ms |
NET | enp0s25   0% | pcki      10 | pcko 8 | si    1 Kbps | so    3 Kbp0.73 ms |

  PID SYSCPU  USRCPU  VGROW   RGROW  ST EXC   THR  S CPUNR   CPU  CMD 1/1673e4 |
 3357  0.01s   0.00s   672K    824K  --   -     1  R     0    0%  atop
 3359  0.01s   0.00s     0K      0K  NE   0     0  E     -    0%  <ps>
 3361  0.00s   0.01s     0K      0K  NE   0     0  E     -    0%  <ps>
 3363  0.01s   0.00s     0K      0K  NE   0     0  E     -    0%  <ps>
31357  0.00s   0.00s     0K      0K  --   -     1  S     1    0%  bash
 3364  0.00s   0.00s  8032K    756K  N-   -     1  S     1    0%  sleep
 2931  0.00s   0.00s     0K      0K  --   -     1  I     1    0%  kworker/u8:2-e
 3356  0.00s   0.00s     0K      0K  -E   0     0  E     -    0%  <sleep>
 3360  0.00s   0.00s     0K      0K  NE   0     0  E     -    0%  <sleep>
 3362  0.00s   0.00s     0K      0K  NE   0     0  E     -    0%  <sleep>

If you want to look at just the disk stats, you can easily manage that with a command like this:

$ atop | grep DSK
$ atop | grep DSK
DSK |          sda | busy      0% | read  122901 | write 3318e3 | avio 0.67 ms |
DSK |          sdb | busy      0% | read    1168 | write    103 | avio 0.73 ms |
DSK |          sda | busy      2% | read       0 | write     92 | avio 2.39 ms |
DSK |          sda | busy      2% | read       0 | write     94 | avio 2.47 ms |
DSK |          sda | busy      2% | read       0 | write     99 | avio 2.26 ms |
DSK |          sda | busy      2% | read       0 | write     94 | avio 2.43 ms |
DSK |          sda | busy      2% | read       0 | write     92 | avio 2.43 ms |
^C

Being in the know with disk I/O

Linux provides enough commands to give you good insights into how hard your disks are working and help you focus on potential problems or slowdowns. Hopefully, one of these commands will tell you just what you need to know when it’s time to question disk performance. Occasional use of these commands will help ensure that especially busy or slow disks will be obvious when you need to check them.

Source

How to Install Bacula Systems Enterprise – Linux Hint

Bacula Enterprise is an amazing backup solution for your data. It is easy to install in a Virtual Machine or in a Bare Metal server. Bacula Enterprise also has an easy to use web based management panel. You can configure backups, make backups, monitor backups etc from the web based management panel. In this article, I will show you how to install Bacula Enterprise on your computer/server. So, let’s get started.

Downloading Bacula Enterprise:

Bacula Enterprise ISO image can be downloaded from the official website of Bacula Systems. To download Bacula Enterprise ISO image, visit the official website of Bacula Systems at https://www.baculasystems.com/try and click on Download Bacula Enterprise Backup Trial Now.

Now, fill in the details and click on Download Trial.

Now, Bacula Systems will mail you a link from where you can download Bacula Enterprise ISO installer image. Open your email and click on the download link. Then, click on the Download ISO button.

Now, click on the ISO image link as marked in the screenshot below.

Your browser should start downloading the Bacula Enterprise ISO installer image.

Making a Bootable USB of Bacula Enterprise:

Once you have Bacula Enterprise ISO image downloaded, you can use Rufus to make a bootable USB of Bacula Enterprise. Once you have the Bacula Enterprise bootable USB installer, you can use it to install Bacula Enterprise on your computer/server.

You can download Rufus from the official website of Rufus at https://rufus.ie

If you want to install Bacula Enterprise as a VMware/VirtualBox virtual machine, then you can use the ISO image directly. You don’t have to make a bootable USB thumb drive of Bacula Enterprise.

Installing Bacula Enterprise:

Once you boot Bacula Enterprise from the ISO installer image or the bootable USB thumb drive, you should see the following GRUB menu. Select Install on Virtual Machine if you’ve booted Bacula Enterprise installer in a virtual machine. Otherwise, select Install on Physical Hardware. Then, press <Enter>.

Bacula Enterprise is loading.

Now, select OK and press <Enter>.

Press <Enter> to continue.

Now, you have to set your keyboard layout. Some keyboard layout keymap codes are given as examples. For example, keymap code us for United States keyboard layout, uk for United Kingdom etc.

NOTE: For more keymap code, visit https://access.redhat.com/documentation/en-us/red_hat_enterprise_linux/6/html/installation_guide/s1-kickstart2-options and scroll down to the keyboard section.

Now, type in the timezone keyword and press <Enter>. For example, if you’re on US Eastern timezone, then the timezone keyword would be US/Eastern.

You can find a list of supported timezone keywords at https://en.wikipedia.org/wiki/List_of_tz_database_time_zones

Now, all the available storage devices should be listed. I have only one storage device sda of size 300GB. Just type in the name of the storage device where you want to install Bacula Enterprise and press <Enter>.

Now, type in the amount of disk space you want to allocate for the root (/) directory in GB and press <Enter>. You should allocate at least 16 GB of disk space here.

Now, type in your swap size in GB and press <Enter>. It should be twice the amount of RAM/memory you have.

Now, type in the amount of diskspace you want to allocate for the /var directory and press <Enter>. Allocate at least 4GB of diskspace for the /var directory.

Now, type in the amount of diskspace you want to allocate for the /opt directory and press <Enter>. Allocate at least 4GB of diskspace for the /opt directory.

Now, type in the amount of diskspace you want to allocate for the /tmp directory and press <Enter>. Allocate at least 4GB of diskspace for the /tmp directory.

Now, type in the amount of diskspace you want to allocate for the /catalog directory and press <Enter>. Allocate at least 8GB of diskspace for the /catalog directory.

Now, type in the amount of diskspace you want to allocate for the /opt/bacula/working directory and press <Enter>. Allocate at least 8GB of diskspace for the /opt/bacula/working directory.

As you can see, about 184 GB of disk space will be allocated for the OS and 116 GB of disk space is still left for data. Press <Enter> to confirm.

Bacula Enterprise installation should start.

All the required packages are being installed.

Bacula Enterprise is being installed.

Now, type in a password for the root user and press <Enter>.

Now, type in a password for the bacula user and press <Enter>.

Now, type in the hostname for your Bacula Enterprise server and press <Enter>.

Now, you have to configure a network interface. To do that, press y and then press <Enter>.

If you want to use DHCP to configure the network interface, then press y and then press <Enter>. If you want to configure the network interface manually, then press n and then press <Enter>.

If this network interface is the default route, then press y and then press <Enter> to continue.

If you’ve decided to manually configure the network, then you have to type in an IP address for the network at this point and press <Enter>.

Then, type in the netmask and press <Enter>.

Now, type in the default gateway and press <Enter>.

Now, press y and then press <Enter> to confirm the details that you’ve provided.

Now, type in a domain name for your Bacula Enterprise server and press <Enter>.

Now, type in the IP address of your primary DNS server and press <Enter>.

Now, type in the IP address of your secondary DNS server and press <Enter>.

Now, press y and then press <Enter> to confirm.

If you want to configure NTP, press y. Otherwise, press n. Then, press <Enter>. NTP is optional. I am not configuring NTP in this article.

If you want to configure email, press y. Otherwise, press n. Then, press <Enter>. Email configuration is optional. I am not configuring email in this article.

Now, type in the amount of disk space you want to allocate for the Bacula Enterprise file storage and press <Enter>.

If you don’t want to use Virtual Tape Library, then press n. Otherwise press y. Then press <Enter>.

If you want to enable DeDuplication, then press y and then press <Enter>.

Now, type in the amount of disk space you want to allocate for dedupe storage and press <Enter>.

Now, type in the number of deduplication devices you want and press <Enter>. The default is 4.

If you don’t want to set any default storage, then press n. Otherwise, press y. Then press <Enter>.

Normally, you don’t want any demo configuration in a production server. So, press n and then press <Enter>.

Now, type in the number of days Bacula Enterprise will keep backups (retention period) for restore. The default is 90 days. At most, you can keep backups for 365 days.

Now, Bacula Enterprise will install additional software packages depending on how you configured it.

Once Bacula Enterprise is installed, you should be booted into the following GRUB menu. Just press <Enter>.

You should be booted into Bacula Enterprise and you should be able to log into the system. Your management IP address is available here. You can access it from any web browser (Bacula prefers Firefox) to manage your Bacula Enterprise server.

Now visit the management IP address (in my case https://192.168.21.5) from any web browser and you should see the BWeb dashboard. From here, you can configure Bacula Enterprise and backup your import data.

So, that’s how you install Bacula Enterprise on your computer/server or a Virtual machine. Thanks for reading this article.

Source

How to Install PyCharm on Ubuntu 18.04 and CentOS 7

How to Install PyCharm on Ubuntu 18.04

Install PyCharm on Ubuntu

PyCharm is an intelligent and fully featured IDE for Python developed by JetBrains. It also provides support for Javascript, Typescript, and CSS etc. You can also extend PyCharm features by using plugins. By using PyCharm plugins you can also get support for frameworks like Django, Flask. We can also use PyCharm for other programming languages like HTML, SQL, Javascript, CSS and more. In this tutorial, you are going to learn how to install PyCharm on Ubuntu 18.04.

Prerequisites

Before you start to install PyCharm on Ubuntu 18.04. You must have the non-root user account on your system with sudo privileges.

Install Snappy Package Manager

Snappy provides better package management support for Ubuntu 18.04. It’s quick and easy to use. To install Snappy package manager type following command. If its already installed on the system skip to next step

NOTE: Ubuntu 18.04 may have already installed Snappy package manager.

sudo apt install snapd snapd-xdg-open

Install PyCharm

Now to download and installed PyCharm snap package run following command. It will take some time to download and install package.

sudo snap install pycharm-community --classic

After successfully downloading and installing the package you will get the following output.

pycharm-community 2018.2.4 from 'jetbrains' installed

Start PyCharm

After successful instalation to start PyCharm via terminal run following command.

pycharm-community

You can also start PyCharm from activities

pycharm-start-from-activities
pycharm start fro activities

You will get the following output after accepting the license and setting up the initial configuration.

pycharm-launcher-window
PyCharm Launcher Window

Conclusion

You have successfully learned how to install PyCharm on Ubuntu 18.04. If you have any queries regarding this then please dont forget to comment below.

—————————————————————————————–

How to Install PyCharm on CentOS 7

Install PyCharm on CentOS 7

PyCharm is an intelligent and fully featured IDE for Python developed by JetBrains. It also provides support for Javascript, Typescript, and CSS etc. You can also extend PyCharm features by using plugins. By using PyCharm plugins you can also get support for frameworks like Django, Flask. We can also use PyCharm for other programming languages like HTML, SQL, Javascript, CSS and more. In this tutorial, you are going to learn how to install PyCharm on CentOS 7.

Prerequisites

Before you start to install PyCharm on CentOS 7. You must have the non-root user account on your system with sudo privileges.

Install PyCharm

First we will download PyCharm using official PyCharm download page using wget command. At the time writing this tutorial the current latest version available is 2018.3.2. You can check latest version for installation if you want.

sudo wget https://download-cf.jetbrains.com/python/pycharm-professional-2018.3.2.tar.gz

Now extract the downloaded package using following command.

tar -xvf pycharm-professional-2018.3.2.tar.gz

Navigate inside the extracted directory.

cd pycharm-professional-2018.3.2

Now to run PyCharm like normal programs you should create symbolic link using the following command.

sudo ln -s ./pycharm-community-2018.3.2/bin/pycharm.sh /usr/bin/pycharm

Start PyCharm

You can launch PyCharm using following command.

pycharm

On starting PyCharm first time you will be asked to import settings. If you have settings from older version then you can import or select “Do not import settings”.

Pycharm Import Settings

You will get the following output after accepting the license and setting up the initial configuration.

PyCharm Welcome Screen

Conclusion

You have successfully learned how to install PyCharm on CentOS 7. If you have any queries regarding this then please dont forget to comment below.

Source

Back to Basics: Sort and Uniq

Learn the fundamentals of sorting and de-duplicating text on the command line.

If you’ve been using the command line for a long time, it’s easy to take the commands you use every day for granted. But, if you’re new to the Linux command line, there are several commands that make your life easier that you may not stumble upon automatically. In this article, I cover the basics of two commands that are essential in anyone’s arsenal: sort and uniq.

The sort command does exactly what it says: it takes text data as input and outputs sorted data. There are many scenarios on the command line when you may need to sort output, such as the output from a command that doesn’t offer sorting options of its own (or the sort arguments are obscure enough that you just use the sort command instead). In other cases, you may have a text file full of data (perhaps generated with some other script), and you need a quick way to view it in a sorted form.

Let’s start with a file named “test” that contains three lines:


Foo
Bar
Baz

sort can operate either on STDIN redirection, the input from a pipe, or, in the case of a file, you also can just specify the file on the command. So, the three following commands all accomplish the same thing:


cat test | sort
sort < test
sort test

And the output that you get from all of these commands is:


Bar
Baz
Foo

Sorting Numerical Output

Now, let’s complicate the file by adding three more lines:


Foo
Bar
Baz
1. ZZZ
2. YYY
11. XXX

If you run one of the above sort commands again, this time, you’ll see different output:


11. XXX
1. ZZZ
2. YYY
Bar
Baz
Foo

This is likely not the output you wanted, but it points out an important fact about sort. By default, it sorts alphabetically, not numerically. This means that a line that starts with “11.” is sorted above a line that starts with “1.”, and all of the lines that start with numbers are sorted above lines that start with letters.

To sort numerically, pass sort the -n option:


sort -n test

Bar
Baz
Foo
1. ZZZ
2. YYY
11. XXX

Find the Largest Directories on a Filesystem

Numerical sorting comes in handy for a lot of command-line output—in particular, when your command contains a tally of some kind, and you want to see the largest or smallest in the tally. For instance, if you want to find out what files are using the most space in a particular directory and you want to dig down recursively, you would run a command like this:


du -ckx

This command dives recursively into the current directory and doesn’t traverse any other mountpoints inside that directory. It tallies the file sizes and then outputs each directory in the order it found them, preceded by the size of the files underneath it in kilobytes. Of course, if you’re running such a command, it’s probably because you want to know which directory is using the most space, and this is where sortcomes in:


du -ckx | sort -n

Now you’ll get a list of all of the directories underneath the current directory, but this time sorted by file size. If you want to get even fancier, pipe its output to the tail command to see the top ten. On the other hand, if you wanted the largest directories to be at the top of the output, not the bottom, you would add the-r option, which tells sort to reverse the order. So to get the top ten (well, top eight—the first line is the total, and the next line is the size of the current directory):


du -ckx | sort -rn | head

This works, but often people using the du command want to see sizes in more readable output than kilobytes. The du command offers the -h argument that provides “human-readable” output. So, you’ll see output like 9.6G instead of 10024764 with the -k option. When you pipe that human-readable output to sort though, you won’t get the results you expect by default, as it will sort 9.6G above 9.6K, which would be above 9.6M.

The sort command has a -h option of its own, and it acts like -n, but it’s able to parse standard human-readable numbers and sort them accordingly. So, to see the top ten largest directories in your current directory with human-readable output, you would type this:


du -chx | sort -rh | head

Removing Duplicates

The sort command isn’t limited to sorting one file. You might pipe multiple files into it or list multiple files as arguments on the command line, and it will combine them all and sort them. Unfortunately though, if those files contain some of the same information, you will end up with duplicates in the sorted output.

To remove duplicates, you need the uniq command, which by default removes any duplicate lines that are adjacent to each other from its input and outputs the results. So, let’s say you had two files that were different lists of names:


cat namelist1.txt
Jones, Bob
Smith, Mary
Babbage, Walter

cat namelist2.txt
Jones, Bob
Jones, Shawn
Smith, Cathy

You could remove the duplicates by piping to uniq:


sort namelist1.txt namelist2.txt | uniq
Babbage, Walter
Jones, Bob
Jones, Shawn
Smith, Cathy
Smith, Mary

The uniq command has more tricks up its sleeve than this. It also can output only the duplicated lines, so you can find duplicates in a set of files quickly by adding the -d option:


sort namelist1.txt namelist2.txt | uniq -d
Jones, Bob

You even can have uniq provide a tally of how many times it has found each entry with the -c option:


sort namelist1.txt namelist2.txt | uniq -c
1 Babbage, Walter
2 Jones, Bob
1 Jones, Shawn
1 Smith, Cathy
1 Smith, Mary

As you can see, “Jones, Bob” occurred the most times, but if you had a lot of lines, this sort of tally might be less useful for you, as you’d like the most duplicates to bubble up to the top. Fortunately, you have the sort command:


sort namelist1.txt namelist2.txt | uniq -c | sort -nr
2 Jones, Bob
1 Smith, Mary
1 Smith, Cathy
1 Jones, Shawn
1 Babbage, Walter

Conclusion

I hope these cases of using sort and uniq with realistic examples show you how powerful these simple command-line tools are. Half the secret with these foundational command-line tools is to discover (and remember) they exist so that they’ll be at your command the next time you run into a problem they can solve.

Source

Drugs on the command line

Drugs on the command line

There’s a lot of raw material on the Web for data auditors to tinker with, but I’ve found only one website that advertises Datasets for data cleaning practice. It’s a 2018 blog post by computational linguist Rachael Tatman. Among the offerings is a link to the National Drug Code Directory website of the US Food and Drug Administration, and one of the FDA downloadables there contains a table with 123,841 product records (2018-12-28 version).

The product table is plain text and tab-separated, but it’s in windows-1252 encoding with a Windows carriage return at the end of each line. (Sigh.) I deleted the carriage returns and converted the table to UTF-8 as the file “prods0”.

Tatman writes Issue: Non-trivial duplication (which drugs are different names for the same things?)”

Answering Tatman’s question isn’t straightforward, because the product table contains partially duplicated records. Although each record has a unique product ID, if that ID is ignored there’s a set of more than 1100 duplicates:

dupes1

Duplicate pair example from “prods0”, with PRODUCTID in red:

0009-0039_5e394712-e775-435b-a4e0-32e1d9647ff5 0009-0039 HUMAN PRESCRIPTION DRUG SOLU-MEDROL methylprednisolone sodium succinate INJECTION, POWDER, FOR SOLUTION INTRAMUSCULAR; INTRAVENOUS 19590402 NDA NDA011856 Pharmacia and Upjohn Company LLC METHYLPREDNISOLONE SODIUM SUCCINATE 40 mg/mL Corticosteroid [EPC],Corticosteroid Hormone Receptor Agonists [MoA] N 20191231

0009-0039_95289567-4341-4b6c-bc3c-aa13036bc9b4 0009-0039 HUMAN PRESCRIPTION DRUG SOLU-MEDROL methylprednisolone sodium succinate INJECTION, POWDER, FOR SOLUTION INTRAMUSCULAR; INTRAVENOUS 19590402 NDA NDA011856 Pharmacia and Upjohn Company LLC METHYLPREDNISOLONE SODIUM SUCCINATE 40 mg/mL Corticosteroid [EPC],Corticosteroid Hormone Receptor Agonists [MoA] N 20191231

cut away the unique ID and sorted and uniquified the records to build the file “prods1”, retaining the header line:

cat <(cut -f1 –complement prods0 | head -n 1) <(tail -n +2 prods0 | cut -f1 –complement | sort | uniq) > prods1

Next, I focused in “prods1” on the fields SUBSTANCENAME (field 13), ACTIVE_NUMERATOR_STRENGTH (14) and ACTIVE_INGRED_UNIT (15). The FDA’s explainer page describes these as follows:

SubstanceName
This is the active ingredient list. Each ingredient name is the preferred term of the UNII code submitted.

StrengthNumber [older field name?]
These are the strength values (to be used with units below) of each active ingredient, listed in the same order as the SubstanceName field above.

StrengthUnit [older field name?]
These are the units to be used with the strength values above, listed in the same order as the SubstanceName and SubstanceNumber.

If these 3 fields are the same, then the product is the same so far as the active ingredients are concerned. To find these partial duplicates I used the two-pass method described in a previous BASHing data post:

awk -F”\t” ‘FNR==NR {a[$13,$14,$15]++; next} $13 != “” && $14 != “” && $15 != “” && a[$13,$14,$15]>1’ prods1 prods1 | wc -l

dupes2

Wow! That’s a lot of “same product” out of 123,205 unique product records. To investigate further I added the fields STARTMARKETINGDATE (field 8 in prods1), PROPRIETARYNAME (3), PROPRIETARYNAMESUFFIX (4) and LABELERNAME (12) to a print as the new file “prods2” (no header this time).

awk -F”\t” ‘FNR==NR {a[$13,$14,$15]++; next} $13 != “” && $14 != “” && $15 != “” && a[$13,$14,$15]>1 {print $8 FS $3 FS $4 FS $12 FS $13 FS $14 FS $15}’ prods1 prods1 > prods2

—–

StartMarketingDate
This is the date that the labeler indicates was the start of its marketing of the drug product.

ProprietaryName
Also known as the trade name. It is the name of the product chosen by the labeler.

ProprietaryNameSuffix
A suffix to the proprietary name, a value here should be appended to the ProprietaryName field to obtain the complete name of the product. This suffix is often used to distinguish characteristics of a product such as extended release (“XR”) or sleep aid (“PM”). Although many companies follow certain naming conventions for suffices, there is no recognized standard.

LabelerName
Name of Company corresponding to the labeler code segment of the ProductNDC.

That still apparently doesn’t capture all the variation in FDA’s database, because “prods2” contains a lot of exact duplicates

dupes3

and there don’t seem to be any differences between the duplicated records in the original downloaded table (“prods0”), apart from the FDA product code and the unique ID based on that code:

Example from “prods0”:

17518-080_7aa3171b-36c0-48d6-e053-2991aa0a6aec 17518-080 HUMAN OTC DRUG 3M SoluPrep chlorhexidine gluconate and isopropyl alcohol SOLUTION TOPICAL 20181008 NDA NDA208288 3M Company CHLORHEXIDINE GLUCONATE; ISOPROPYL ALCOHOL 20; .7 mg/mL; mL/mL N 20191231

17518-081_7aa3171b-36c0-48d6-e053-2991aa0a6aec 17518-081 HUMAN OTC DRUG 3M SoluPrep chlorhexidine gluconate and isopropyl alcohol SOLUTION TOPICAL 20181008 NDA NDA208288 3M Company CHLORHEXIDINE GLUCONATE; ISOPROPYL ALCOHOL 20; .7 mg/mL; mL/mL N 20191231

Once again I sorted and uniquified, converting “prods2” to “prods3”, which has 92,452 records. One source of duplication in “prods3” is in the proprietary name suffix field, because the same basic product can be sold with slightly different formulations not affecting the active ingredients. Here’s an example (from “prods0”) — a dental fluoride paste that comes in 3 different flavours:

65222-401_6155acd9-8ec2-a87d-e053-2991aa0a7b43 65222-401 HUMAN PRESCRIPTION DRUG Nupro Fluorides NaF Oral Solution Mint Sodium Fluoride GEL DENTAL 19000101 UNAPPROVED DRUG OTHER Dentsply LLC. Professional Division Trading as “DENTSPLY Professional” SODIUM FLUORIDE 20 mg/g N 20191231

65222-411_6155acd9-8ec2-a87d-e053-2991aa0a7b43 65222-411 HUMAN PRESCRIPTION DRUG Nupro Fluorides NaF Oral Solution Mandarin Orange Sodium Fluoride GEL DENTAL 19000101 UNAPPROVED DRUG OTHER Dentsply LLC. Professional Division Trading as “DENTSPLY Professional” SODIUM FLUORIDE 20 mg/g N 20191231

65222-421_6155acd9-8ec2-a87d-e053-2991aa0a7b43 65222-421 HUMAN PRESCRIPTION DRUG Nupro Fluorides NaF Oral Solution Apple Cinnamon Sodium Fluoride GEL DENTAL 19000101 UNAPPROVED DRUG OTHER Dentsply LLC. Professional Division Trading as “DENTSPLY Professional” SODIUM FLUORIDE 20 mg/g N 20191231

A larger source of duplication in “prods3” is the marketing date. Walgreens, for instance, has 2 different registrations for an allergy medicine, differing only in start and end marketing dates (example from “prods0”):

0363-0211_997032ac-0110-4004-9697-d82146ba7128 0363-0211 HUMAN OTC DRUG 24 Hour Allergy Cetirizine HCl CAPSULE ORAL 20130301 NDA NDA022429 Walgreens CETIRIZINE HYDROCHLORIDE 10 mg/1 N 20181231

0363-1219_f3168f2c-27a7-4dd7-9770-e91443a580f1 0363-1219 HUMAN OTC DRUG 24 Hour Allergy Cetirizine HCl CAPSULE ORAL 20180914 NDA NDA022429 Walgreens CETIRIZINE HYDROCHLORIDE 10 mg/1 N 20191231

I generated “prods4” from “prods3” by cutting out marketing date and sorting and uniquifying again. That reduced the set of “basically the same product” records to 84,163. Here are the top 10 formulations:

cut -f4-6 prods4 | sort | uniq -c | sort -nr | head

dupes4

Those 25 mg lots of diphenhydramine hydrochloride (an antihistamine) were sold by a nominal 188 labelling entities, but again there’s duplication. The FDA lists multiple strings for what’s presumably the same company

Allergy relief     [no suffix]     Topco Associates LLC
Allergy relief     [no suffix]     Topco Associates, LLC
Allergy relief     [no suffix]     TopCo Associates LLC

the same product

Sleep Aid     Nighttime     CVS Pharmacy
Sleep- Aid     Nighttime     CVS Pharmacy
Sleep-Aid     Nighttime     CVS Pharmacy

or both

sleep aid     nighttime     Target Corporation
Sleep Aid     NightTime     TARGET Corporation

Summing up, the answer to Tatman’s question about this dataset, namely “Which drugs are different names for the same things?” has several answers depending on how you define “things”. But even after you’ve decided what you’re looking for, the surprising messiness of the FDA’s data means you have a lot of data cleaning to do before you can start looking. The FDA’s product table is indeed a good dataset for data cleaning practice!


Some of the ingredient fields in the product table contain semicolon-and-space-separated strings, like

ACETALDEHYDE; ARSENIC TRIOXIDE; BALSAM PERU; OYSTER SHELL CALCIUM CARBONATE, CRUDE; PHENOL; CONIUM MACULATUM FLOWERING TOP; COUMARIN; SAFFRON; HISTAMINE DIHYDROCHLORIDE; LACHESIS MUTA VENOM; LYCOPODIUM CLAVATUM SPORE; PHOSPHORUS; SEPIA OFFICINALIS JUICE

Could there be additional duplication in these entries, with the same items listed in different orders in different records? Checking for different orders of items within a single field is an interesting exercise in data auditing: see the next BASHing data post.

Source

How to scan for IP addresses on your network with Linux

Are you having trouble remembering what IP addresses are in use on your network? Jack Wallen shows you how to discover those addresses with two simple commands.

How many times have you tried to configure a static IP address for a machine on your network, only to realize you had no idea what addresses were already taken? If you happen to work with a desktop machine, you could always install a tool like Wireshark to find out what addresses were in use. But what if you’re on a GUI-less server? You certainly won’t rely on a graphical-based tool for scanning IP addresses. Fortunately, there are some very simple-to-use command line tools that can handle this task.

I’m going to show you how to scan your Local Area Network (LAN) for IP addresses in use with two different tools (one of which will be installed on your server by default). I’ll demonstrate on Ubuntu Server 18.04.

Let’s get started.

The arp command

The first tool we’ll use for the task is the built-in arp command. Most IT admins are familiar with arp, as it is used on almost every

platform. If you’ve never used arp (which stands for Address Resolution Protocol), the command is used to manipulate (or display) the kernel’s IPv4 network neighbor cache. If you issue arp with no mode specifier or options, it will print out the current content of the ARP table. That’s not what we’re going to do. Instead, we’ll issue the command like so:

arp -a

The -a option uses and alternate BSD-style output and prints all known IP addresses found on your LAN. The output of the command will display IP addresses as well as the associated ethernet device (Figure A).

Figure A

Figure A

I have a lot of virtual machines on my LAN.

You now have a listing of each IP address in use on your LAN. The only caveat, is that (unless you know the MAC address of every device on your network), you won’t have a clue as to which machine the IP addresses are assigned. Even without knowing what machine is associated with what address you at least know what addresses are being used.

Nmap

Next, we use a command that offers more options. Said command is nmap. You won’t find nmap installed on your Linux machine by default, so we must add it to the system. Open a terminal window (or log into your GUI-less server) and issue the command:

sudo apt-get install nmap -y

Once the installation completes, you are ready to scan your LAN with nmap. To find out what addresses are in use, issue the command:

nmap -sP 192.168.1.0/24

Note: You will need to alter the IP address scheme to match yours.

The output of the command (Figure B), will show you each address found on your LAN.

Figure B

Figure B

Nmap is now giving us slightly more information.

Let’s make nmap more useful. Because it offers a bit more flexibility, we can also discover what operating system is associated with an IP address. To do this, we’ll use the options -sT (TCP connect scan) and -O (operating system discovery). The command for this is:

sudo nmap -sT -O 192.168.1.0/24

Depending on the size of your network, this command can take some time. And if your network is large, consider sending the output of the command to a file like so:

sudo nmap -sT -O 192.168.1.0/24 > nmap_output

You can then view the file with a text editor to find out what operating system is attached to an IP address (Figure C).

Figure C

Figure C

Operating systems are associated with IP addresses.

With the help of these two simple commands, you can locate IP addresses on your network that are in use. Now, when you’re assigning a static IP address, you won’t accidentally assign one already in use. We all know what kind of headaches that can cause.

Source

Keep your edge with these powerful Linux admini… » Linux Magazine

Source

WP2Social Auto Publish Powered By : XYZScripts.com