Linux Today – Linux 5.0 rc1

Jan 07, 2019, 06:00

(Other stories by Linus Torvalds)

So this was a fairly unusual merge window with the holidays, and as a
result I’m not even going to complain about the pull requests that
ended up coming in late. It all mostly worked out fine, I think. And
lot of people got their pull requests in early, and hopefully had a
calm holiday season. Thanks again to everybody.

The numbering change is not indicative of anything special. If you

want to have an official reason, it’s that I ran out of fingers and
toes to count on, so 4.21 became 5.0. There’s no nice git object
numerology this time (we’re _about_ 6.5M objects in the git repo), and
there isn’t any major particular feature that made for the release
numbering either. Of course, depending on your particular interests,
some people might well find a feature _they_ like so much that they
think it can do as a reason for incrementing the major number.

So go wild. Make up your own reason for why it’s 5.0.

Because as usual, there’s a lot of changes in there. Not because this

merge window was particularly big – but even our smaller merge windows
aren’t exactly small. It’s a very solid and average merge window with
just under 11k commits (or about 11.5k if you count merges).

The stats look fairly normal. About 50% is drivers, 20% is

architecture updates, 10% is tooling, and the remaining 20% is all
over (documentation, networking, filesystems, header file updates,
core kernel code..). Nothing particular stands out, although I do like
seeing how some ancient drivers are getting put out to pasture
(*cought*isdn*cough*).

As usual even the shortlog is much too big to post, so the summary

below is only a list of the pull requests I merged.

Go test. Kick the tires. Be the first kid on your block running a 5.0

pre-release kernel.

Linus

Complete Story

Related Stories:

Source

Aliases: To Protect and Serve

Happy 2019! Here in the new year, we’re continuing our series on aliases. By now, you’ve probably read our , and it should be quite clear how they are the easiest way to save yourself a lot of trouble. You already saw, for example, that they helped with muscle-memory, but let’s see several other cases in which aliases come in handy.

Aliases as Shortcuts

One of the most beautiful things about Linux’s shells is how you can use zillions of options and chain commands together to carry out really sophisticated operations in one fell swoop. All right, maybe beauty is in the eye of the beholder, but let’s agree that this feature *is* practical.

The downside is that you often come up with recipes that are often hard to remember or cumbersome to type. Say space on your hard disk is at a premium and you want to do some New Year’s cleaning. Your first step may be to look for stuff to get rid off in you home directory. One criteria you could apply is to look for stuff you don’t use anymore. ls can help with that:

ls -lct

The instruction above shows the details of each file and directory (-l) and also shows when each item was last accessed (-c). It then orders the list from most recently accessed to least recently accessed (-t).

Is this hard to remember? You probably don’t use the -c and -t options every day, so perhaps. In any case, defining an alias like

alias lt=’ls -lct’

will make it easier.

Then again, you may want to have the list show the oldest files first:

alias lo=’lt -F | tac’

There are a few interesting things going here. First, we are using an alias (lt) to create another alias — which is perfectly okay. Second, we are passing a new parameter to lt (which, in turn gets passed to ls through the definition of the lt alias).

The -F option appends special symbols to the names of items to better differentiate regular files (that get no symbol) from executable files (that get an *), files from directories (end in /), and all of the above from links, symbolic and otherwise (that end in an @ symbol). The -F option is throwback to the days when terminals where monochrome and there was no other way to easily see the difference between items. You use it here because, when you pipe the output from lt through to tac you lose the colors from ls.

The third thing to pay attention to is the use of piping. Piping happens when you pass the output from an instruction to another instruction. The second instruction can then use that output as its own input. In many shells (including Bash), you pipe something using the pipe symbol (|).

In this case, you are piping the output from lt -F into tac. tac’s name is a bit of a joke. You may have heard of cat, the instruction that was nominally created to concatenate files together, but that in practice is used to print out the contents of a file to the terminal. tac does the same, but prints out the contents it receives in reverse order. Get it? cat and tac. Developers, you so funny!

The thing is both cat and tac can also print out stuff piped over from another instruction, in this case, a list of files ordered chronologically.

So… after that digression, what comes out of the other end is the list of files and directories of the current directory in inverse order of freshness.

The final thing you have to bear in mind is that, while lt will work the current directory and any other directory…

# This will work:
lt
# And so will this:
lt /some/other/directory

… lo will only work with the current directory:

# This will work:
lo
# But this won’t:
lo /some/other/directory

This is because Bash expands aliases into their components. When you type this:

lt /some/other/directory

Bash REALLY runs this:

ls -lct /some/other/directory

which is a valid Bash command.

However, if you type this:

lo /some/other/directory

Bash tries to run this:

ls -lct -F | tac /some/other/directory

which is not a valid instruction, because tac mainly because /some/other/directory is a directory, and cat and tac don’t do directories.

More Alias Shortcuts

  • alias lll=’ls -R’ prints out the contents of a directory and then drills down and prints out the contents of its subdirectories and the subdirectories of the subdirectories, and so on and so forth. It is a way of seeing everything you have under a directory.
  • mkdir=’mkdir -pv’ let’s you make directories within directories all in one go. With the base form of mkdir, to make a new directory containing a subdirectory you have to do this:
    mkdir newdir
    mkdir newdir/subdirOr this:

    mkdir -p newdir/subdir

    while with the alias you would only have to do this:

    mkdir newdir/subdir

    Your new mkdir will also tell you what it is doing while is creating new directories.

Aliases as Safeguards

The other thing aliases are good for is as safeguards against erasing or overwriting your files accidentally. At this stage you have probably heard the legendary story about the new Linux user who ran:

rm -rf /

as root, and nuked the whole system. Then there’s the user who decided that:

rm -rf /some/directory/ *

was a good idea and erased the complete contents of their home directory. Notice how easy it is to overlook that space separating the directory path and the *.

Both things can be avoided with the alias rm=’rm -i’ alias. The -i option makes rm ask the user whether that is what they really want to do and gives you a second chance before wreaking havoc in your file system.

The same goes for cp, which can overwrite a file without telling you anything. Create an alias like alias cp=’cp -i’ and stay safe!

Next Time

We are moving more and more into scripting territory. Next time, we’ll take the next logical step and see how combining instructions on the command line gives you really interesting and sophisticated solutions to everyday admin problems.

Source

How To Install and Configure ownCloud with Apache on Ubuntu 18.04

ownCloud is an open source, self-hosted file sync and file share platform, similar to Dropbox, Microsoft OneDrive and Google Drive. ownCloud is extensible via apps and has desktop and mobile clients for all major platforms.

In this tutorial we’ll show you how to install and configure ownCloud with Apache on an Ubuntu 18.04 machine.

Prerequisites

You’ll need to be logged in as a user with sudo access to be able to install packages and configure system services.

Step 1: Creating MySQL Database

ownCloud can use SQLite, Oracle 11g, PostgreSQL or MySQL database to store all its data. In this tutorial we will use MySQL as a database back-end.

If MySQL or MariaDB is not installed on your Ubuntu server you can install by following one of the guides below:

Start by login in to the MySQL shell by typing the following command:

From inside the mysql console, run the following SQL statement to create a database:

CREATE DATABASE owncloud CHARACTER SET utf8mb4 COLLATE utf8mb4_general_ci;

Next, create a MySQL user account and grant access to the database:

GRANT ALL ON owncloud.* TO ‘owncloudsuser’@’localhost’ IDENTIFIED BY ‘change-with-strong-password’;

Finally, exit the mysql console by typing:

Step 2: Installing PHP and Apache

ownCloud is a PHP application. PHP 7.2 which is the default PHP in Ubuntu 18.04 is fully supported and recommended for ownCloud.

Install Apache and all required PHP extensions using the following command:

sudo apt install apache2 libapache2-mod-php7.2 openssl php-imagick php7.2-common php7.2-curl php7.2-gd php7.2-imap php7.2-intl php7.2-json php7.2-ldap php7.2-mbstring php7.2-mysql php7.2-pgsql php-smbclient php-ssh2 php7.2-sqlite3 php7.2-xml php7.2-zip

Step 3: Configuring Firewall

Assuming you are using UFW to manage your firewall, you’ll need to open HTTP (80) and HTTPS (443) ports. You can do that by enabling the ‘Apache Full’ profile which includes rules for both ports:

sudo ufw allow ‘Apache Full’

Step 4: Downloading ownCloud

At the time of writing this article, the latest stable version of ownCloud is version 10.0.10. Before continuing with the next step visit the ownCloud download page and check if there is a new version of ownCloud available.

Use the following wget command to download the ownCloud zip archive:

wget https://download.owncloud.org/community/owncloud-10.0.10.zip -P /tmp

Once the download is complete, extract the archive to the /var/www directory:

sudo unzip /tmp/owncloud-10.0.10.zip -d /var/www

Set the correct ownership so that the Apache web server can have full access to the ownCloud’s files and directories.

sudo chown -R www-data: /var/www/owncloud

Step 5: Configuring Apache

Open your text editor and create the following Apache configuration file.

sudo nano /etc/apache2/conf-available/owncloud.conf

/etc/apache2/conf-available/owncloud.conf

Alias /owncloud “/var/www/owncloud/”

<Directory /var/www/owncloud/>
Options +FollowSymlinks
AllowOverride All

<IfModule mod_dav.c>
Dav off
</IfModule>

SetEnv HOME /var/www/owncloud
SetEnv HTTP_HOME /var/www/owncloud

</Directory>

Enable the newly added configuration and all required Apache modules with:

sudo a2enconf owncloud
sudo a2enmod rewrite
sudo a2enmod headers
sudo a2enmod env
sudo a2enmod dir
sudo a2enmod mime

Activate the changes by restarting Apache service:

sudo systemctl reload apache2

Step 6: Installing ownCloud

Now that ownCloud is downloaded and all necessary services are configured open you browser and start the ownCloud installation by visiting your server’s domain name or IP address followed by /owncloud :

http://domain_name_or_ip_address/owncloud

You will be presented with the ownCloud setup page.

Enter your desired admin username and password and the MySQL user and database details you previously created.

Click on the Finish setup button and once the installation process is completed you will be redirected to the ownCloud dashboard logged in as admin user.

Conclusion

You have learned how to install and configure ownCloud on your Ubuntu 18.04 machine. If you have a domain name associated with your ownCloud server, you can follow this guide and secure your Apache with Let’s Encrypt.

To find more information about how to manage your ownCloud instance visit the ownCloud documentation page.

If you have any question, please leave a comment below.

Source

Welcome » Linux Magazine

It is getting harder to write this column. I used to have a ready supply of topics, with all the outrageous things that were happening to Linux: Microsoft’s disinformation, SCO’s lawsuit, patent licenses, the Novell/Microsoft pact – big things that threatened the very existence of the Linux community.

Dear Reader,

It is getting harder to write this column. I used to have a ready supply of topics, with all the outrageous things that were happening to Linux: Microsoft’s disinformation, SCO’s lawsuit, patent licenses, the Novell/Microsoft pact – big things that threatened the very existence of the Linux community.

I was trying to think up a new topic today, and it occurred to me that there used to be way more in the news on an average day that could rile up a Linux guy. That’s the good news, because Linux is in a safer place and is no longer faced with the threat of imminent destruction. Microsoft is playing nice (sort of); SCO has collapsed under the weight of its own imagination deficit. But are we really walking on easy street now? Surely some other threats must be out there? Are there still factors that are threatening the livelihood of the Linux community, and if so, what are they?

That sounded like a good topic for a column, so I resolved to create my own list of the current top threats. One note on this list: Because these threats are not quite as dire as they used to be, they are also a little more arbitrary. This is my list – some of you might see different threats, but either way, the main point is that challenges still exist:

  • Fragmentation – the Linux desktop still isn’t unified, and the recent controversy over the systemd init daemon is a reminder that the community does not always move in the same direction. The beauty of open source is that you can always fork the code, but if too many developers take the code in too many different directions, the project could lose the critical mass necessary to hold the mainstream, becoming a collection of smaller projects, like the BSDs, that will receive less attention from hardware vendors and, ultimately, users.
  • Irrelevance – will the general-purpose computer OS still be a thing in 10 years? Already, people are doing more with their cell phones and tablets. Linux is still running inside Android, but there are so many other things going on inside a smartphone that you can’t exactly just hack on it like you can on a Linux system. Linux would still be running on toasters and washing machines (and on servers – see the next item), but it could recede into the background and be more under the control of hardware and cloud companies, rather than driven by a vibrant, independent community.
  • Cloud computing – According to Free Software Foundation president Richard Stallman, cloud servers “… wrest control from the users even more inexorably than proprietary software” [1]. Software running from within a proprietary portal maximizes the power of the vendor and minimizes the freedom of the user in ways that are antithetical to the spirit of Free Software. Also, the copyleft protection of the GPL, which forces the sharing of source code when changes are made to a program, is triggered when the software is distributed. As many have pointed out, cloud computing doesn’t really distribute the software, so it falls in a gray area that is beyond the protection of Free Software licensing.
  • Re-emergence of a “friendlier” Microsoft – Microsoft is no longer bent on destroying Linux; in fact, they say they “love” Linux. But a little too much love from Microsoft could be a scary thing too. Many in the Linux community distrust Redmond’s motives and wonder if some kind of assimilation might be taking place. The GPL offers some natural defenses against a single company gaining control, but could Microsoft use its cash stores and market clout to take Linux in a direction that the greater community doesn’t want to go, and what would happen if they did?
  • Succession issues – Linux is still run by the same guy who created it 27 years ago. Linus Torvalds is still young and healthy, but he might not want to do this forever. Will Linux survive the handoff to a new generation of leaders?
  • Bad judges and politicians – Linux and open source licensing have survived several tests in the courts over patent law, copyright law, and other intellectual property issues, but the questions are complex and lots of politicians, business leaders, and jurists still don’t exactly get what’s going on with open source. Actually, I sometimes wonder if the open source community totally gets it. (Many voices in the community have called for a loosening of copyright laws to increase the freedom to consume music and movies, but actually, a strong copyright is the foundation on which the GPL is built, so you have to be very careful.) These issues are too vast and intricate to sort out in a one-page intro column, but suffice it to say, a few bad decisions from judges or regulators could bring back questions that we all thought were settled.

That’s my list – at least for now. I’m not saying all this stuff is actually going to happen, but, as with any challenge, the best way to keep these dark threats in abeyance is to be aware and not get too complacent. As the old saying goes “Eternal vigilance is the price of liberty” [2].

Joe Casad, Editor in Chief

Source

CentOS Package Search – Linux Hint

Whenever you’re looking for a package/software to enjoy, there are several ways you can get that into your Linux system. By default, the fastest and easiest method is to just tell the system’s package manager to install that package. Otherwise, you may need to download the source code, build it by yourself and then, install it.

Hello, CentOS users! In the case of CentOS, the Linux distro is a pretty cool one that gives the complete vibe and feel of the server/enterprise environment. CentOS and RHEL both uses “yum” as the default package manager.

In this case, you have 2 available options for searching a certain package/software – asking “yum” to search by name or, checking the internet for the exact package name.

Don’t worry. Everything is as pretty simple and quick.

As “yum” is the default package manager, you can use the following command structure for searching –

For example, you can search for GNOME using the following command –

Now, that’s LONG list of GNOME and apps!!!

There’s another available GUI tool for searching, listing and installing packages on CentOS – yumex. The package is available on the EPEL repository. THat’s why make sure that your system has EPEL repository enabled –

sudo yum install epel-release

Then, install “yumex” –

Now, fire up “yumex” –

Searching the internet

Now, if you’re out of luck finding out the right package name on your package manager, consider checking out the internet! It’s a faster and more convenient solution for most of us.

The best place for searching for Linux packages is Pkgs.org. It’s a fine place that keeps the record of numerous Linux packages of almost all the popular and non-popular Linux distros you’ll ever enjoy in your machine.

For example, I found the “yumex” package directly on Pkgs.org

Enjoy!

About the author

Sidratul Muntaha

Sidratul Muntaha

Student of CSE. I love Linux and playing with tech and gadgets. I use both Ubuntu and Linux Mint.

Source

The Unix Security Audit and Intrusion Detection Tool

Tiger is a free, open source collections of shell scripts for security audit and host intrusion detection, for Unix-like systems such as Linux. It’s a security checker written entirely in shell language and employs various POSIX tools in the backend. It’s major purpose is to check the system configuration and status.

It’s very extensible than the other security tools, and has a good configuration file. It scans system configuration files, file systems, and user configuration files for possible security problems and reports them.

In this article, we will show how to install and use Tiger security checker with basic examples in Linux.

How to Install Tiger Security Tool in Linux

On Debian and its derivatives such Ubuntu and Linux Mint, you can easily install Tiger security tool from the default repositories using package manger as shown.

$ sudo apt install tiger 

On other Linux distributions, you can download the latest source (the current stable release is 3.2.3, at the time of writing) and run it straight away from the terminal as as root or use the sudo command to gain root privileges.

$ wget  -c  http://download.savannah.gnu.org/releases/tiger/tiger-3.2rc3.tar.gz
$ tar -xzf tiger-3.2rc3.tar.gz
$ cd tiger-3.2/
$ sudo ./tiger

By default all checks are enabled, in the tigerrc file and you can edit it using a CLI editor of your liking to enable only the checks you are interested in:

Run Tiger Security Audit Tool on Linux

Run Tiger Security Audit Tool on Linux

When the security scan is complete, a security report will be generated in the log sub directory, you will see a message similar to this (where tecmint is the hostname):

Security report is in `log//security.report.tecmint.181229-11:12'.

You can view the contents of the security report file using cat command.

$ sudo cat log/security.report.tecmint.181229-11\:12
View Security Report

View Security Report

If you just want more information on a specific security message, run the tigexp (TIGer EXPlain) command and provide the msgid as an argument, where “msgid” is the text inside the [] associated with each message.

For example, to get more information about the following messages, where [acc001w] and [path009w] are the msgids:

--WARN-- [acc015w] Login ID nobody has a duplicate home directory (/nonexistent) with another user.  
--WARN-- [path009w] /etc/profile does not export an initial setting for PATH.

Simply run these commands:

$ sudo ./tigexp acc015w
$ sudo ./tigexp path009w
View Security Messages

View Security Messages

If you want to insert the explanations (more information on a particular message generated by tiger) in the report, you can either run tiger with the -E flag.

$ sudo ./tiger -E 

Or if you have already run it, then use tigexp command with the -F flag to specify the report file, for example:

$ sudo ./tigexp -F log/security.report.tecmint.181229-11\:12
View Security Report with Messages

View Security Report with Messages

To generate a separate explanation file from a report file, run the following command (where -f is used to specify the report file):

$ sudo ./tigexp -f log/security.report.tecmint.181229-11\:12

As you can see, installing tiger is not necessary. However, if you want to install it on your system for purposes of convenience, run the following commands (use ./configure – -help to check configure script options):

$ ./configure
$ sudo make install

For more information, see the man pages under the ./man/ sub-directory, and use the cat command to view them. But if you have installed the package, run:

$ man tiger 
$ man tigerexp

Tiger project homepage: https://www.nongnu.org/tiger/

Tiger is a set of scripts that scan a Unix-like system looking for security problems – it’s a security checker. In this article, we have shown how to install and use Tiger in Linux. Use the feedback form to ask questions or share your thoughts about this tool.

Source

CentOS Add Users to Sudoers – Linux Hint

In the case of any Linux system, there’s a very powerful user – the “root”. It upholds the ULTIMATE power over the entire system, even modifying data at the hardware level! That’s why it’s so delicate and dangerous at the same time. Without the “root” access, hackers are forced to follow a trickier and more difficult path for taking over the system.The “root” privilege is responsible for performing all the actions that modifies the system files and packages. That’s why in the enterprise/professional workspace, not all users are allowed to run commands as they wish.

CentOS also comes up with a similar policy. It only allows a certain users to perform actions with the “root” privilege. For example, whenever you run any command with the “sudo” command, you’ll get the following error –

For fixing the issue, the user account must be in the “sudoers” file. In this tutorial, we’ll check out on adding a user into the “sudoers” file.

The trick here is NOT directly editing the “/etc/sudoers” file. Instead, we’ll be adding the specific user into the “wheel” group. In the case of CentOS, all the users in the group have the ability of running “sudo” commands and that’s the easier and safer way.

This is also proven within the “/etc/sudoers” file –

Optional – creating a new user

I’m going to create a new user for the “sudo” purpose only. Don’t worry; you can easily add the existing user.

Enter the “root” mode –

Now, create a new user –

Time to add a password for the newly created username –

It’s finally time to add the user “Yasuo” on the “wheel” group. At first, make sure that you’re logged as the “root” –

Now, perform the final action –

usermod -aG wheel <username>

Everything is set!

Testing the outcome

Well, it’s always worth testing the outcome, no matter how obvious it may seem. Let’s try out running a “sudo” command as “Yasuo” –

Voila! “Yasuo” is now a privileged user account capable of “sudo”!

Source

DevOps: Get up to speed with these handy guides

Download: “The Ultimate DevOps Hiring Guide” and “The Open Source Guide to DevOps Monitoring Tools”

In 2018, the Open Source DevOps team helped produce two amazing guides to help advance our DevOps practices.

The Ultimate DevOps Hiring Guide

In April, we released The Ultimate DevOps Hiring Guide. It’s a wonderful collection of advice, tactics, and information about the state of DevOps hiring for both job seekers and hiring managers. It starts by discussing the importance of culture for your organization and how it impacts your ability, or inability, to get the right talent on your team. Then it provides an overview of the DevOps hiring landscape and market trends. The final section offers best practices for prospective employees and hiring managers.

Download The ultimate DevOps hiring guide

The Open Source Guide to DevOps Monitoring Tools

In August, contributor and Opensource.com community moderator Dan Barker put together The Open Source Guide to DevOps Monitoring Tools. The extremely popular, in-depth guide walks you through the variety of open source tools available for everything from monitoring to log aggregation and visualization to distributed tracing.

Download The open source guide to DevOps monitoring tools

New guides on the way in early 2019

As we begin the new year, we’ve got two new guides in the works. I’m excited to announce that in early 2019 we plan to have the following guides available for download:

  • Getting Started with DevSecOps: The Open Source Guide to DevOps Security
  • Introduction to Small Scale Scrum

Source

Download BusyBox Linux 1.30.0

BusyBox, dubbed by its developers “The Swiss Army Knife of Embedded Linux,” is an open source and freely downloadable software project comprised of a wide range of command-line tools designed to help you interact better with a Linux kernel-based operating system, whether it is installed on a personal computer, laptop, mobile phone or embedded device.

Includes some of the most common Linux/UNIX tools

Some of the most common Linux/UNIX tools, that you’ve most probably used at least once in your life, are included in the BusyBox package, which is usually installed by default on any GNU/Linux or UNIX-like operating system. Among these, we can mention chmod, mount, umount, ps,

It contains all the important command-line utilities

To learn more about the importance of BusyBox into a GNU/Linux operating system, we can tell you that it includes all the mainstream and important command-line utilities that are either used by other command-line or graphical applications, or used directly by you, the user, for various tasks.

For example, it includes all the necessary archiving utilities, such as unzip for extracting zip files, tar for extracting tar archives, as well as bzip2, gzip, rpm, lzop, cpio, ar, bbunzip, dpkg, and rpm2cpio. It also includes many editors, tools for managing file systems, email utilities, find tools, Debian utilities, logging tools, printing tools, and numerous networking utilities.

Can be installed on any GNU/Linux operating system

It BusyBox is not already installed on your GNU/Linux box, you can easily install it by downloading the latest release from its website or via Softpedia, saving the archive on your Home directory, unpacking it using an archive manager tool, and opening a Terminal app.

In the Terminal emulator, go to the location where you’ve extracted the source package (e.g. cd /home/softpedia/busybox-1.23.1), run either of the ‘make oldconfig’. ‘make menuconfig’ or ‘make defconfig’ commands to configure BusyBox, then run the ‘make’ command to compile all tools. Install them system wide by running the ‘sudo make install’ command after a successful compilation.

Source

Python Matplotlib Tutorial – Linux Hint

Python Matplotlib Tutorial

In this lesson on Python Matplotlib library, we will look at various aspects of this data visualisation library which we can use with Python to generate beautiful and intuitive graphs which can visualise data in a form which business wants from a platform. To make this lesson complete, we will cover the following sections:

  • What is Python Matplotlib?
  • Types of Plots we can construct, like Bar Graph, Histogram, Scatter Plot, Area Plot and Pe Chart
  • Working with Multiple plots
  • Some alternatives for Python Matplotlib

What is Python Matplotlib?

The matplotlib.pyplot is a graph plotting package which can be used to construct 2-dimensional graphics using Python programming language. Due to its pluggable nature, this package can be used in any GUI applications, Web application servers or simple Python scripts. Some toolkits which extend the functionality of Python Matplotlib are:

  • Basemap is a map plotting library that provides features to create map projects, coastlines and political boundaries
  • Natgrid can be used to grid irregular data into spaced data
  • Excel tools can be used to exchange data between MS Excel and Matplotlib
  • Cartopy is a much complex mapping library which even provides image transformation features apart from point, line & polygon projections

Just a note before starting is that we use a virtual environment for this lesson which we made with the following command:

python -m virtualenv matplotlib
source matplotlib/bin/activate

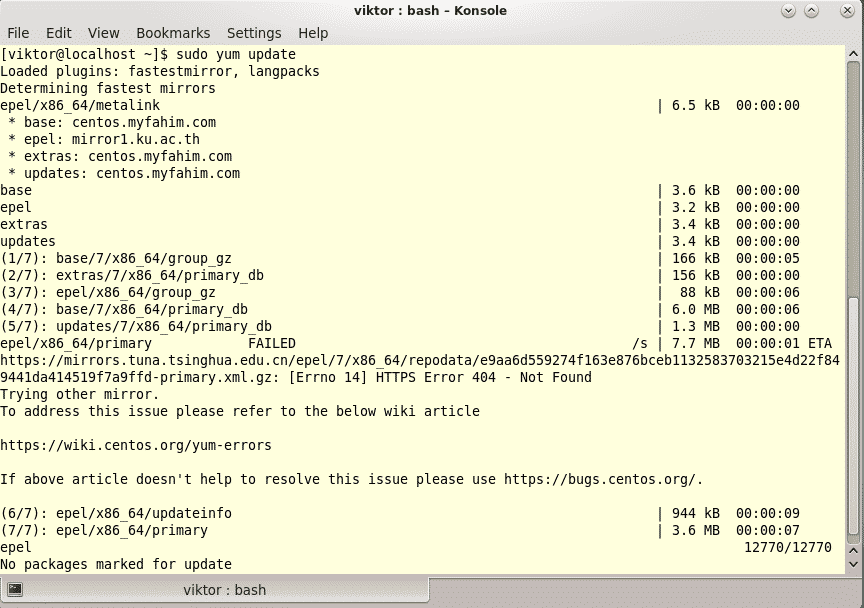
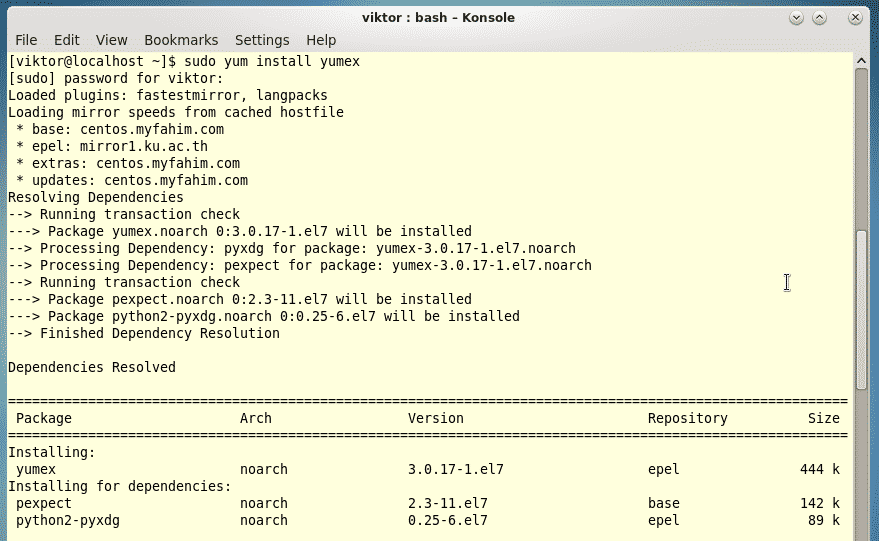
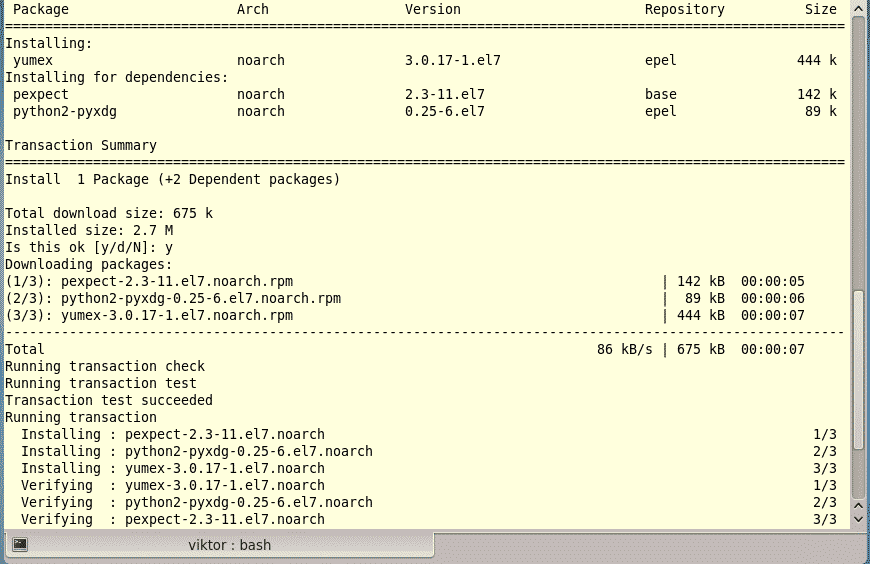
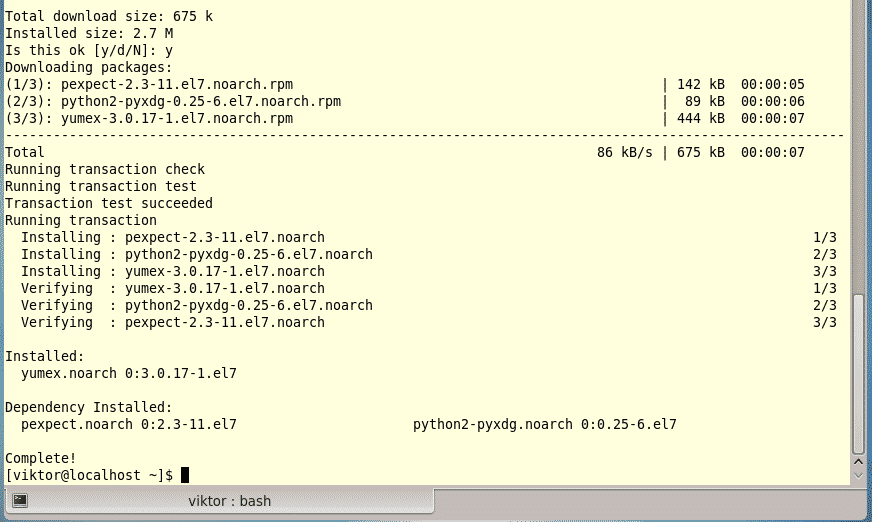
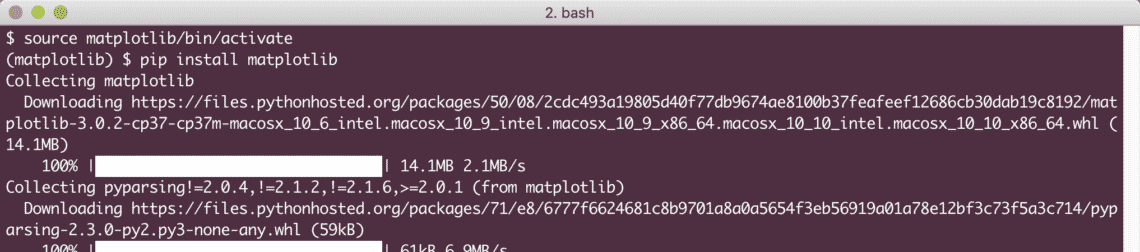
Once the virtual environment is active, we can install matplotlib library within the virtual env so that examples we create next can be executed:

pip install matplotlib

We see something like this when we execute the above command:

You can use Anaconda as well to run these examples which is easier. If you want to install it on your machine, look at the lesson which describes “How to Install Anaconda Python on Ubuntu 18.04 LTS” and share your feedback. Now, let us move forward to various types of plots which can be constructed with Python Matplotlib.

Types of Plots

Here, we demonstrate the types of plots which can be drawn with Python Matplotlib.

Simple Graph

The first example we will see will be of a simple graph plot. This example is used as a demonstration of how simple it is to construct a graph plot along with simple customisations that come with it. We start by importing matplotlib and defining the x and y coordinates we want to plot:

from matplotlib import pyplot as plt
= [3, 6, 9]
= [2, 4, 6]

After this, we can plot these coordinates on the graph and show it:

plt.plot(x, y)
plt.show()

When we run this, we will see the following graph:


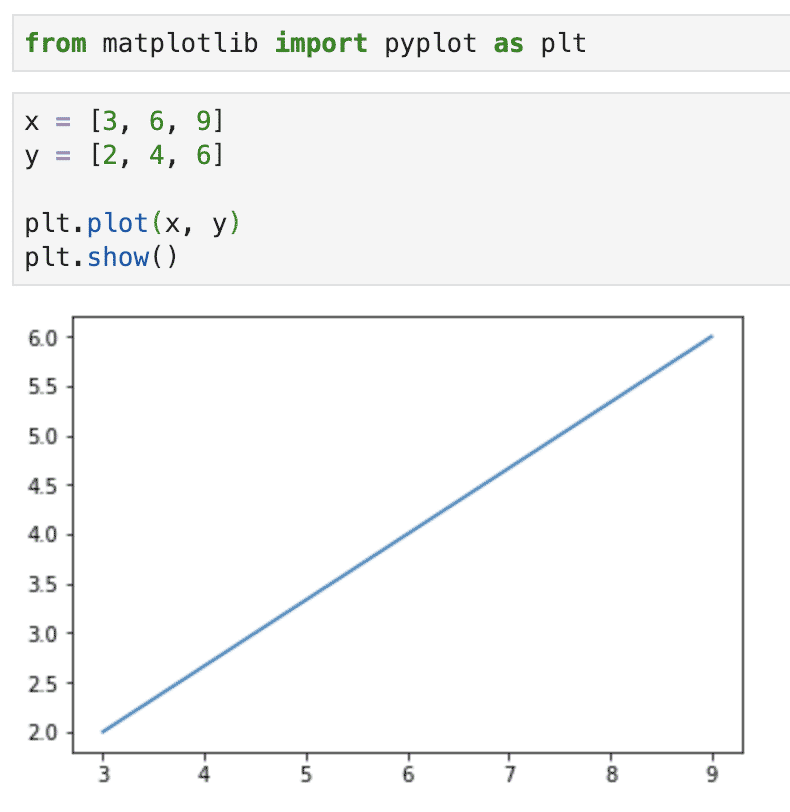
With just few lines of code, we were able to plot a graph. Let us add a few customisations to make this graph a little more expressive:

plt.title(‘LH Plot’)
plt.ylabel(‘Y axis’)
plt.xlabel(‘X axis’)

Add above lines of code just before you show the plot and graph will now have labels:

We will give one more attempt in customising this graph to make it intuitive with the following lines of code before we show the plot:

x1 = [3, 6, 9]
y1 = [2, 4, 6]

x2 = [2, 7, 9]
y2 = [4, 5, 8]

plt.title(‘Info’)
plt.ylabel(‘Y axis’)
plt.xlabel(‘X axis’)

plt.plot(x1 ,y1 , ‘g’, label=‘Quarter 1’, linewidth=5)
plt.plot(x2, y2, ‘r’, label=‘Quarter 2’, linewidth=5)
plt.legend()
plt.grid(True,color=‘k’)
plt.show()

We will see the following plot when we run the above code snippet:

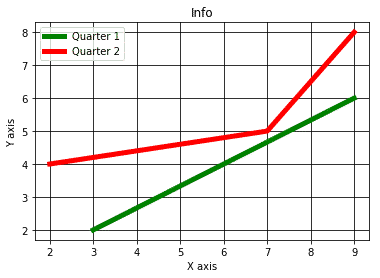
Notice what we started with and what we ended up with, a very intuitive and attractive graph which you can use in your presentations and it is made with pure Python code, definitely something to be proud of !

Making a Bar Graph

A bar graph is specifically useful when we want to platform a comparison with specific and limited measures. For example, comparing the average marks of students with a single subject is a good use-case. Let us construct a bar graph for the same use-case here, the code snippet for this will be:

avg_marks = [81, 92, 55, 79]
physics = [68, 77, 62, 74]

plt.bar([0.25, 1.25, 2.25, 3.25], avg_marks, label=“Average”, width=.5)
plt.bar([.75, 1.75, 2.75, 3.75], physics, label=“Physics”, color=‘r’, width=.5)

plt.legend()
plt.xlabel(‘Range’)
plt.ylabel(‘Marks’)
plt.title(‘Comparison’)

plt.show()

The bar graph created with the above sample data will look like the following:

There are multiple bars present here to establish a comparison. Please note that we have provided the width of each bar as a first parameters and bar is shifted 0.5 values from the previous one.

We can combine this bar graph construction with Pandas library to customise this more but we will cover it in a different lesson on Pandas.

Distributions with Histograms

Histograms are often confused with Bar charts. The most basic difference lies in their use-case. Bar charts are used to establish comparisons between data whereas histograms are used to describe data distribution.

For example, let us apply the example for student marks again but this time, we will only look at the average marks of students and look at how are they distributed. Here is the code snippet, very similar to the previous example:

bins = [0,10,20,30,40,50,60,70,80,90,100]
avg_marks = [81, 77, 55, 88, 81, 66, 51, 66, 81, 92, 55, 51]

plt.hist(avg_marks, bins, histtype=‘bar’, rwidth=0.8)

plt.xlabel(‘Range’)
plt.ylabel(‘Marks’)
plt.title(‘Comparison’)

plt.show()

The histogram created with above sample data will look like the following:

The Y-axis show here that how many students have got the same marks which were provided as the data for the construction.

Making a Scatter Plot

When it comes to comparing multiple variables and establish their effect on each other, Scatter plot is a good way to present the same. In this, data is represented as points with value of one variable reflected by horizontal axis and the value of second variable determines the position of the point on the vertical axis.

Let us look at a simple code snippet to describe the same:

= [1,1.5,2,2.5,3,3.5,3.6]
= [75,8,85,9,95,10,75]

x1=[8,8.5,9,9.5,10,10.5,11]
y1=[3,35,3.7,4,45,5,52]

plt.scatter(x,y, label=’10 High scoring students’,color=‘r’)
plt.scatter(x1,y1,label=’10 Low scoring students’,color=‘b’)
plt.xlabel(‘Marks’)
plt.ylabel(‘Student count’)
plt.title(‘Scatter Plot’)
plt.legend()
plt.show()

The scatter plot created with above sample data will look like the following:

Area Plots

The area plots are used mainly to track changes in data over time. They are also termed as stack plots in various texts. For example, if we want to establish a representation of time invested by a student to each subject in a single day, here is the code with which we can do the same:

days = [1,2,3,4,5]

physics =[2,8,6,5,7]
python = [5,4,6,4,1]
=[7,9,4,3,1]
math = [8,5,7,8,13]

plt.plot([],[],color=‘m’, label=‘Physics’, linewidth=5)
plt.plot([],[],color=‘c’, label=‘Python’, linewidth=5)
plt.plot([],[],color=‘r’, label=‘R’, linewidth=5)
plt.plot([],[],color=‘k’, label=‘Math’, linewidth=5)

plt.stackplot(days, physics, python, r, math, colors=[‘g’,‘k’,‘r’,‘b’])

plt.xlabel(‘x’)

plt.ylabel(‘y’)
plt.title(‘Stack Plot’)
plt.legend()
plt.show()

The area plot created with above sample data will look like the following:

The above output clearly establish a difference in time spent by a student in each subject with a clear way of providing the difference and the distribution.

Pie Charts

When we want to break whole part into multiple parts and describe the amount each part occupies, a pie chart is a good way to make this presentation. It is used to show the percentage of data in complete data set. Here is a basic code snippet to make a simple pie chart:

labels = ‘Python’, ‘C++’, ‘Ruby’, ‘Java’
sizes = [225, 130, 245, 210]
colors = [‘r’, ‘b’, ‘g’, ‘c’]
explode = (0.1, 0, 0, 0)  # explode 1st slice

# Plot
plt.pie(sizes, explode=explode, labels=labels, colors=colors,

autopct=‘%1.1f%%’, shadow=True, startangle=140)

plt.axis(‘equal’)
plt.show()

The pie chart created with above sample data will look like the following:

In above sections, we looked at various graphical components we can construct with Matplotlib library to represent our data in various forms and establish differences in an intuitive manner while being statistical.

Features and Alternatives for Matplotlib

One of the best features for matplotlib is that it can work on many operating systems and graphical backends. It supports dozens of Operating systems and graphical output which we looked at in this lesson. This means we can count on it when it comes to providing an output in a way we need.

There are various other libraries present which can compete with matplotlib like:

  1. Seahorn
  2. Plotly
  3. Ggplot2

Even though above mentioned libraries might present some advanced ways to describe and present data in graphical manner but there no denial in the simplicity and effective nature of the matplotlib library.

Conclusion

In this lesson, we looked at various aspects of this data visualisation library which we can use with Python to generate beautiful and intuitive graphs which can visualise data in a form which business wants from a platform. The Matplotlib is one of the most important visualisation library when it comes to data engineering and presenting data in most visual forms, definitely a skill we need to have under our belt.

WP2Social Auto Publish Powered By : XYZScripts.com