Linux distributions provide quite a few useful commands for gauging disk activity. Here’s a look at a few of them.
Linux systems provide a handy suite of commands for helping you see how busy your disks are, not just how full. In this post, we examine five very useful commands for looking into disk activity. Two of the commands (iostat and ioping) may have to be added to your system, and these same two commands require you to use sudo privileges, but all five commands provide useful ways to view disk activity.
Probably one of the easiest and most obvious of these commands is dstat.
dtstat
In spite of the fact that the dstat command begins with the letter “d”, it provides stats on a lot more than just disk activity. If you want to view just disk activity, you can use the -d option. As shown below, you’ll get a continuous list of disk read/write measurements until you stop the display with a ^c. Note that after the first report, each subsequent row in the display will report disk activity in the following time interval, and the default is only one second.
$ dstat -d
-dsk/total-
read writ
949B 73k
65k 0 <== first second
0 24k <== second second
0 16k
0 0 ^C
Including a number after the -d option will set the interval to that number of seconds.
$ dstat -d 10
-dsk/total-
read writ
949B 73k
65k 81M <== first five seconds
0 21k <== second five second
0 9011B ^C
Notice that the reported data may be shown in a number of different units — e.g., M (megabytes), k (kilobytes), and B (bytes).
Without options, the dstat command is going to show you a lot of other information as well — indicating how the CPU is spending its time, displaying network and paging activity, and reporting on interrupts and context switches.
$ dstat
You did not select any stats, using -cdngy by default.
–total-cpu-usage– -dsk/total- -net/total- —paging– —system–
usr sys idl wai stl| read writ| recv send| in out | int csw
0 0 100 0 0| 949B 73k| 0 0 | 0 3B| 38 65
0 0 100 0 0| 0 0 | 218B 932B| 0 0 | 53 68
0 1 99 0 0| 0 16k| 64B 468B| 0 0 | 64 81 ^C
The dstat command provides valuable insights into overall Linux system performance, pretty much replacing a collection of older tools, such as vmstat, netstat, iostat, and ifstat, with a flexible and powerful command that combines their features. For more insight into the other information that the dstat command can provide, refer to this post on the dstat command.
iostat
The iostat command helps monitor system input/output device loading by observing the time the devices are active in relation to their average transfer rates. It’s sometimes used to evaluate the balance of activity between disks.
$ iostat
Linux 4.18.0-041800-generic (butterfly) 12/26/2018 _x86_64_ (2 CPU)
avg-cpu: %user %nice %system %iowait %steal %idle
0.07 0.01 0.03 0.05 0.00 99.85
Device tps kB_read/s kB_wrtn/s kB_read kB_wrtn
loop0 0.00 0.00 0.00 1048 0
loop1 0.00 0.00 0.00 365 0
loop2 0.00 0.00 0.00 1056 0
loop3 0.00 0.01 0.00 16169 0
loop4 0.00 0.00 0.00 413 0
loop5 0.00 0.00 0.00 1184 0
loop6 0.00 0.00 0.00 1062 0
loop7 0.00 0.00 0.00 5261 0
sda 1.06 0.89 72.66 2837453 232735080
sdb 0.00 0.02 0.00 48669 40
loop8 0.00 0.00 0.00 1053 0
loop9 0.01 0.01 0.00 18949 0
loop10 0.00 0.00 0.00 56 0
loop11 0.00 0.00 0.00 7090 0
loop12 0.00 0.00 0.00 1160 0
loop13 0.00 0.00 0.00 108 0
loop14 0.00 0.00 0.00 3572 0
loop15 0.01 0.01 0.00 20026 0
loop16 0.00 0.00 0.00 24 0
Of course, all the stats provided on Linux loop devices can clutter the display when you want to focus solely on your disks. The command, however, does provide the -p option, which allows you to just look at your disks — as shown in the commands below.
$ iostat -p sda
Linux 4.18.0-041800-generic (butterfly) 12/26/2018 _x86_64_ (2 CPU)
avg-cpu: %user %nice %system %iowait %steal %idle
0.07 0.01 0.03 0.05 0.00 99.85
Device tps kB_read/s kB_wrtn/s kB_read kB_wrtn
sda 1.06 0.89 72.54 2843737 232815784
sda1 1.04 0.88 72.54 2821733 232815784
Note that tps refers to transfers per second.
You can also get iostat to provide repeated reports. In the example below, we’re getting measurements every five seconds by using the -d option.
$ iostat -p sda -d 5
Linux 4.18.0-041800-generic (butterfly) 12/26/2018 _x86_64_ (2 CPU)
Device tps kB_read/s kB_wrtn/s kB_read kB_wrtn
sda 1.06 0.89 72.51 2843749 232834048
sda1 1.04 0.88 72.51 2821745 232834048
Device tps kB_read/s kB_wrtn/s kB_read kB_wrtn
sda 0.80 0.00 11.20 0 56
sda1 0.80 0.00 11.20 0 56
If you prefer to omit the first (stats since boot) report, add a -y to your command.
$ iostat -p sda -d 5 -y
Linux 4.18.0-041800-generic (butterfly) 12/26/2018 _x86_64_ (2 CPU)
Device tps kB_read/s kB_wrtn/s kB_read kB_wrtn
sda 0.80 0.00 11.20 0 56
sda1 0.80 0.00 11.20 0 56
Next, we look at our second disk drive.
$ iostat -p sdb
Linux 4.18.0-041800-generic (butterfly) 12/26/2018 _x86_64_ (2 CPU)
avg-cpu: %user %nice %system %iowait %steal %idle
0.07 0.01 0.03 0.05 0.00 99.85
Device tps kB_read/s kB_wrtn/s kB_read kB_wrtn
sdb 0.00 0.02 0.00 48669 40
sdb2 0.00 0.00 0.00 4861 40
sdb1 0.00 0.01 0.00 35344 0
iotop
The iotop command is top-like utility for looking at disk I/O. It gathers I/O usage information provided by the Linux kernel so that you can get an idea which processes are most demanding in terms in disk I/O. In the example below, the loop time has been set to 5 seconds. The display will update itself, overwriting the previous output.
$ sudo iotop -d 5
Total DISK READ: 0.00 B/s | Total DISK WRITE: 1585.31 B/s
Current DISK READ: 0.00 B/s | Current DISK WRITE: 12.39 K/s
TID PRIO USER DISK READ DISK WRITE SWAPIN IO> COMMAND
32492 be/4 root 0.00 B/s 0.00 B/s 0.00 % 0.12 % [kworker/u8:1-ev~_power_efficient]
208 be/3 root 0.00 B/s 1585.31 B/s 0.00 % 0.11 % [jbd2/sda1-8]
1 be/4 root 0.00 B/s 0.00 B/s 0.00 % 0.00 % init splash
2 be/4 root 0.00 B/s 0.00 B/s 0.00 % 0.00 % [kthreadd]
3 be/0 root 0.00 B/s 0.00 B/s 0.00 % 0.00 % [rcu_gp]
4 be/0 root 0.00 B/s 0.00 B/s 0.00 % 0.00 % [rcu_par_gp]
8 be/0 root 0.00 B/s 0.00 B/s 0.00 % 0.00 % [mm_percpu_wq]
ioping
The ioping command is an altogether different type of tool, but it can report disk latency — how long it takes a disk to respond to requests — and can be helpful in diagnosing disk problems.
$ sudo ioping /dev/sda1
4 KiB <<< /dev/sda1 (block device 111.8 GiB): request=1 time=960.2 us (warmup)
4 KiB <<< /dev/sda1 (block device 111.8 GiB): request=2 time=841.5 us
4 KiB <<< /dev/sda1 (block device 111.8 GiB): request=3 time=831.0 us
4 KiB <<< /dev/sda1 (block device 111.8 GiB): request=4 time=1.17 ms
^C
— /dev/sda1 (block device 111.8 GiB) ioping statistics —
3 requests completed in 2.84 ms, 12 KiB read, 1.05 k iops, 4.12 MiB/s
generated 4 requests in 3.37 s, 16 KiB, 1 iops, 4.75 KiB/s
min/avg/max/mdev = 831.0 us / 947.9 us / 1.17 ms / 158.0 us
atop
The atop command, like top provides a lot of information on system performance, including some stats on disk activity.
ATOP – butterfly 2018/12/26 17:24:19 37d3h13m—— 10ed
PRC | sys 0.03s | user 0.01s | #proc 179 | #zombie 0 | #exit 6 |
CPU | sys 1% | user 0% | irq 0% | idle 199% | wait 0% |
cpu | sys 1% | user 0% | irq 0% | idle 99% | cpu000 w 0% |
CPL | avg1 0.00 | avg5 0.00 | avg15 0.00 | csw 677 | intr 470 |
MEM | tot 5.8G | free 223.4M | cache 4.6G | buff 253.2M | slab 394.4M |
SWP | tot 2.0G | free 2.0G | | vmcom 1.9G | vmlim 4.9G |
DSK | sda | busy 0% | read 0 | write 7 | avio 1.14 ms |
NET | transport | tcpi 4 | tcpo stall 8 | udpi 1 | udpo 0swout 2255 |
NET | network | ipi 10 | ipo 7 | ipfrw 0 | deliv 60.67 ms |
NET | enp0s25 0% | pcki 10 | pcko 8 | si 1 Kbps | so 3 Kbp0.73 ms |
PID SYSCPU USRCPU VGROW RGROW ST EXC THR S CPUNR CPU CMD 1/1673e4 |
3357 0.01s 0.00s 672K 824K — – 1 R 0 0% atop
3359 0.01s 0.00s 0K 0K NE 0 0 E – 0% <ps>
3361 0.00s 0.01s 0K 0K NE 0 0 E – 0% <ps>
3363 0.01s 0.00s 0K 0K NE 0 0 E – 0% <ps>
31357 0.00s 0.00s 0K 0K — – 1 S 1 0% bash
3364 0.00s 0.00s 8032K 756K N- – 1 S 1 0% sleep
2931 0.00s 0.00s 0K 0K — – 1 I 1 0% kworker/u8:2-e
3356 0.00s 0.00s 0K 0K -E 0 0 E – 0% <sleep>
3360 0.00s 0.00s 0K 0K NE 0 0 E – 0% <sleep>
3362 0.00s 0.00s 0K 0K NE 0 0 E – 0% <sleep>
If you want to look at just the disk stats, you can easily manage that with a command like this:
$ atop | grep DSK
$ atop | grep DSK
DSK | sda | busy 0% | read 122901 | write 3318e3 | avio 0.67 ms |
DSK | sdb | busy 0% | read 1168 | write 103 | avio 0.73 ms |
DSK | sda | busy 2% | read 0 | write 92 | avio 2.39 ms |
DSK | sda | busy 2% | read 0 | write 94 | avio 2.47 ms |
DSK | sda | busy 2% | read 0 | write 99 | avio 2.26 ms |
DSK | sda | busy 2% | read 0 | write 94 | avio 2.43 ms |
DSK | sda | busy 2% | read 0 | write 94 | avio 2.43 ms |
DSK | sda | busy 2% | read 0 | write 92 | avio 2.43 ms |
^C
Being in the know with disk I/O
Linux provides enough commands to give you good insights into how hard your disks are working and help you focus on potential problems or slowdowns. Hopefully, one of these commands will tell you just what you need to know when it’s time to question disk performance. Occasional use of these commands will help ensure that especially busy or slow disks will be obvious when you need to check them.
Source

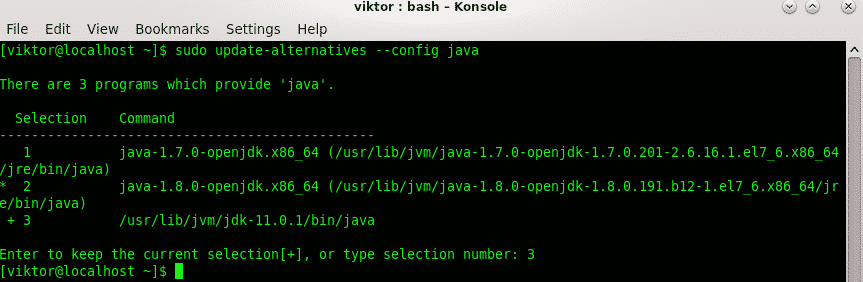
 How to install Java on CentOS 7