Before you can use an SD card or USB drive, it needs to be formatted and partitioned. Typically most USB drives and SD cards come preformatted using the FAT file system and do not need to be formatted out of the box. However, in some cases, you may need to format the drive.
In Linux, you can use a graphical tool like GParted or command-line tools such as fdisk or parted to format the drive and create the required partitions.
This article explains how to format a USB Drive or SD Card on Linux using the parted utility.
It’s important to note that formatting is a destructive process, and it will erase all the existing data. If you have data on the UDB drive or the SD card, make sure you back it up.
Installing parted
GNU Parted is a tool for creating and managing partition tables. The parted package is pre-installed on most Linux distros nowadays. You can check if it is installed on your system by typing:
Before formatting the drive, you can securely wipe out all the data on it by overwriting the entire drive with random data. This ensures that the data cannot be recovered by any data recovery tool.
You need to completely wipe the data only if the device is going to be given away. Otherwise, you can skip this step.
Be very careful before running the following command and irrevocably erase the drive data. The of=... part of the dd command must point to the target drive:
Depending on the size of the drive, the process will take some time to complete.
Once the disk is erased, the dd command will print “No space left on device”:
15455776768 bytes (15 GB, 14 GiB) copied, 780 s, 19.8 MB/s
dd: error writing '/dev/sdb': No space left on device
3777356+0 records in
3777355+0 records out
15472047104 bytes (15 GB, 14 GiB) copied, 802.296 s, 19.3 MB/s

Creating a Partition and Formatting

The most common file systems are exFAT and NTFS on Windows, EXT4 on Linux, and FAT32, which can be used on all operating systems.

We will show you how to format your USB drive or SD card to FAT32 or EXT4. Use EXT4 if you intend to use the drive only on Linux systems, otherwise format it with FAT32. A single partition is sufficient for most use cases.

Format with FAT32

First, create the partition table by running the following command:

$ sudo parted /dev/sdb --script -- mklabel msdos

Create a Fat32 partition that takes the whole space:
mke2fs 1.44.1 (24-Mar-2018)
/dev/sdb1 contains a vfat file system
Creating filesystem with 3777024 4k blocks and 944704 inodes
Filesystem UUID: 72231e0b-ddef-44c9-a35b-20e2fb655b1c
Superblock backups stored on blocks:
	32768, 98304, 163840, 229376, 294912, 819200, 884736, 1605632, 2654208

Allocating group tables: done
Writing inode tables: done
Creating journal (16384 blocks): done
Writing superblocks and filesystem accounting information: done
Verify it by printing the partition table:
$ sudo parted /dev/sdb --script print
The output should look something like this:Model:
Kingston DataTraveler 3.0 (scsi) Disk /dev/sdb: 15.5GB Sector size (logical/physical): 512B/512B Partition Table: gpt Disk Flags: Number Start End Size File system Name Flags 1 1049kB 15.5GB 15.5GB ext4 primary
Conclusion
Formatting a USB drive or SD card on Linux is a pretty straight forward process. All you need to do is insert the drive, create a partition table, and format it with FAT32 or your preferred file system.
So you were trying to customize your Ubuntu desktop but messed it up to end up with no Unity, no Launcher and no Dash? Don’t panic, there is a solution for this issue.
Fix no Unity, no Launcher, no Dash in Ubuntu 14.04 – 20.04.
At login time, use Ctrl+Alt+F1 to access the command line interface. You will have to use your username and password here. Once logged in, use the following commands:
Hope this fixes the issue with Ubuntu 14.04 – 20.04.
Alternative 1:
If the above solution did not work for you, try removing everything from config using the command below. You can still open the terminal using the shortcut Ctrl+Alt+T.
mv ~/.config ~/.config_backup
This will reset everything and your Ubuntu system will resemble to the looks of a fresh install. Installed applications will be untouched.
If even that did not work for you, there is another trick which I used in Ubuntu 12.10. But it still works for Ubuntu 17.10 GNOME.
Fix no Unity, no Launcher, no Dash in Ubuntu
I was installing Ubuntu on my friend’s laptop the other day when I encountered this strange scenario. After the fresh install when I boot into Ubuntu, there was no Unity, no side launcher, no dash, nothing. All it had was just the default wallpaper.
Ubuntu Desktop Without Unity
Clearly, something was broken. I tried the good old technique to reset Unity and Compiz in Ubuntu, did not work. After looking for hours in the forum, I came up with this awesome one-liner solution.
Use Ctrl+Alt+T to open the terminal. Now use the following command in the terminal:
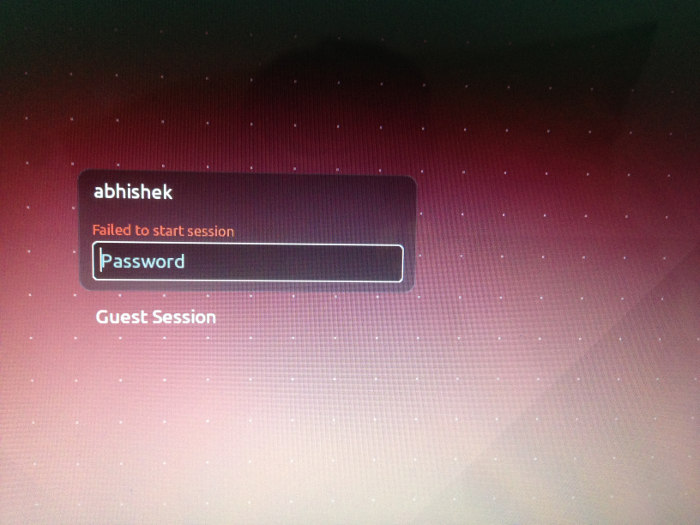
Unable to log in to Ubuntu because of ‘failed to start session’ error? Here’s what you could try.
I was trying to log in to Ubuntu as usual. I entered my password and it did not log me in even with the correct password. Instead, it showed me failed to start session in red colors. I could not even log in to the guest session.
In this quick post, we shall see how to fix failed to start session issue in Ubuntu 16.04-20.04 and earlier versions.
Fix failed to start session in Ubuntu
The reason here is that somehow your Unity desktop has been messed up. You can try several way to recover it. Let’s see how to do it.
When you are at login, press Ctrl+Alt+F1. It will take you to command line interface from the GUI. In here, type your username and password. Now, you can try the following command to install Unity Desktop:
sudo apt-get install ubuntu-desktop
If it is already installed, try reinstalling:
sudo apt-get install --reinstall ubuntu-desktop
Once it is installed or reinstalled. Use the following command to reboot the system:
sudo reboot
It will reboot and bring you back to login screen. Try login now. You should be able to log in. If you are still unlucky, try to use the alternative below:
Alternative method:
As an alternative you can use the command below to reconfigure the packaging:
sudo dpkg-reconfigure -a
At times, this should fix the failed to start session issue in Ubuntu. But it was not that easy for me. I used another approach which is slightly dirty. When I noticed that reinstalling Unity and reconfiguring the packages did not make any difference, I installed GNOME instead using a command like this:
This time at reboot, I was able to boot in to GNOME desktop or even choose to boot in to Ubuntu default, i.e. Unity. A word of warning, Unity may seem broken after installing Gnome. Change the theme and icons to that of Ambiance, instead of the default (Adawita).
That helped me fix “failed to load session” error in Ubuntu. Did it work for you? Do let me know if you have questions or suggestions.
Kubernetes is an open-source container orchestration platform that automates the deployment, scaling, and management of containerized applications.
What is a container?
A container is a lightweight, standalone, executable software package that includes everything needed to run an application, including code, runtime, system tools, libraries, and settings.
What are the benefits of using Kubernetes?
Kubernetes automates application deployment, scaling, and management, making it easy to deploy and manage container-based applications at scale. Other benefits include: Simplified application management Improved scaling and availability Easy deployment and rollback Improved resource utilization Increased portability and flexibility
What is a Kubernetes cluster?
A Kubernetes cluster is a set of nodes that run containerized applications managed by the Kubernetes control plane.
What is a node in Kubernetes?
A node is a worker machine in Kubernetes that runs containerized applications.
What is a pod in Kubernetes?
A pod is the smallest deployable unit in Kubernetes that represents a single instance of a running process in a container. Kubernetes Architecture
What is the Kubernetes control plane?
The Kubernetes control plane is a set of components that manages and orchestrates the Kubernetes cluster. It includes the following components: API server etcd kube-scheduler kube-controller-manager cloud-controller-manager
What is the API server in Kubernetes?
The API server is the front-end interface for the Kubernetes control plane that exposes the Kubernetes API.
What is etcd in Kubernetes?
etcd is a distributed, reliable, and highly available key-value store used to store the configuration data for the Kubernetes cluster.
What is the Kubernetes scheduler?
The Kubernetes scheduler is responsible for scheduling pods to run on available nodes in the cluster based on available resources and other scheduling requirements.
What is the kube-controller-manager?
The kube-controller-manager is responsible for running various controller processes that monitor the state of the cluster and make changes as necessary.
What is the cloud-controller-manager?
The cloud-controller-manager is responsible for managing integration with cloud providers, such as AWS, GCP, or Azure.
What is a Kubernetes worker node?
A Kubernetes worker node is a physical or virtual machine that runs containerized applications and services. It includes the following components: Kubelet kube-proxy container runtime
What is the kubelet in Kubernetes?
The kubelet is an agent that runs on each node and communicates with the Kubernetes API server to manage the container lifecycle.
What is the kube-proxy in Kubernetes?
The kube-proxy is responsible for managing network routing between pods and services in the Kubernetes cluster.
What is a container runtime in Kubernetes?
A container runtime is responsible for starting and stopping containers on a node. Examples include Docker, containerd, and CRI-O.
Why use namespace in Kubernetes?
Namespaces in Kubernetes are used for dividing cluster resources between users. It helps the environment where more than one user spread projects or teams and provides a scope of resources.
Kubernetes Networking:
What is a Kubernetes service?
A Kubernetes service is an abstraction layer that exposes a set of pods as a network service, allowing them to communicate with each other and with other services outside the cluster.
What is a Kubernetes DNS?
Kubernetes DNS is a service that provides DNS resolution for services and pods in a Kubernetes cluster.
What is a pod network in Kubernetes?
A pod network is a network overlay that connects pods in a Kubernetes cluster.
What is the Kubernetes CNI (Container Networking Interface)?
The Kubernetes CNI is a specification that defines a standardized interface for integrating with container networking plugins. Deploying Applications in Kubernetes
What is a Kubernetes deployment?
A Kubernetes deployment defines a desired state for a group of replicas of a pod, and manages the rollout and rollback of updates to the pod replicas.
What is a Kubernetes pod template?
A Kubernetes pod template defines the desired configuration for a pod, including the container image, environment variables, and other settings.
What is a Kubernetes replica set?
A Kubernetes replica set ensures that a specified number of replicas of a pod are running at any given time.
What is a Kubernetes stateful set?
A Kubernetes stateful set manages the deployment, scaling, and ongoing state of a set of stateful pods, such as databases or other stateful applications.
What is a Kubernetes daemon set?
A Kubernetes daemon set ensures that a specific pod runs on all or some nodes in the cluster.
What is a Kubernetes job?
A Kubernetes job runs a specific task to completion, such as running a batch job or performing a data processing task.
Kubernetes Scheduling and Scaling:
What is Kubernetes scheduling?
Kubernetes scheduling is the process of assigning a running pod to a node in the cluster.
What is Kubernetes scheduling policy?
Kubernetes scheduling policy is a set of rules and criteria used to determine which node in the cluster should run a specific pod.
What is a Kubernetes affinities?
Kubernetes affinities are rules that determine the preferred scheduling of pods based on various factors, such as the existence of a specific data volume or the location of a specific node.
What is a Kubernetes anti-affinities?
Kubernetes anti-affinities are rules that determine the preferred scheduling of pod based on factors that should be avoided, such as running two replicas of a pod on the same node.
What is Kubernetes horizontal pod autoscaling (HPA)?
Kubernetes HPA automatically scales the number of replicas of a pod based on the current demand for resources.
What is Kubernetes Vertical Pod Autoscaling (VPA)?
Kubernetes VPA automatically adjusts the resource requirements of a pod based on the current resource usage.
What is Kubernetes cluster autoscaling?
Kubernetes cluster autoscaling automatically scales the number of nodes in a cluster based on the current demand for resources. Monitoring and Logging in Kubernetes
What is Kubernetes monitoring?
Kubernetes monitoring is the process of monitoring the health and performance of a Kubernetes cluster and its applications.
What is Kubernetes logging?
Kubernetes logging is the process of collecting and analyzing the logs generated by the applications and services running in a Kubernetes cluster.
What is Kubernetes Prometheus?
Kubernetes Prometheus is an open-source monitoring and alerting toolkit that collects metrics and data from the Kubernetes API server.
What is Kubernetes Grafana?
Kubernetes Grafana is an open-source data visualization and analysis tool that provides real-time monitoring and analysis of Kubernetes clusters.
What is Kubernetes Fluentd?
Kubernetes Fluentd is an open-source data collection and forwarding tool that aggregates logs and sends them to a central location for analysis and storage.
What is Kubernetes Kibana?
Kubernetes Kibana is an open-source data visualization and analysis tool that provides real-time analysis of logs and other data generated by Kubernetes clusters.
Kubernetes Security:
What is Kubernetes RBAC (Role-Based Access Control)?
Kubernetes RBAC is a method of controlling access to Kubernetes resources based on user roles and permissions.
What is Kubernetes TLS (Transport Layer Security)?
Kubernetes TLS is a security protocol used to secure client-server communications within a Kubernetes cluster.
What is Kubernetes network policies?
Kubernetes network policies are rules that control the flow of network traffic between pods and services within a Kubernetes cluster.
What is Kubernetes pod security policies?
Kubernetes pod security policies are a set of policies that control the security settings for pods deployed in a Kubernetes cluster.
What is Kubernetes secrets?
Kubernetes secrets are a secure way to store sensitive information, such as passwords, API keys, and other authentication tokens, used by applications running in a Kubernetes cluster.
What is Kubernetes pod security context?
Kubernetes pod security context provides a way to set security-related attributes on a per-pod basis, such as user and group IDs, and file permissions.
Kubernetes Tools and APIs:
What is kubectl?
kubectl is the command-line tool used to interact with a Kubernetes cluster.
What is the Kubernetes API?
The Kubernetes API is a RESTful API used to manage and operate Kubernetes clusters.
What is Kubernetes Helm?
Kubernetes Helm is a package manager for Kubernetes that helps you deploy, manage and upgrade Kubernetes applications.
What is Kubernetes Dashboard?
Kubernetes Dashboard is a web-based user interface for managing and monitoring Kubernetes clusters.
Debugging and Troubleshooting in Kubernetes:
What is Kubernetes pod readiness probe?
Kubernetes pod readiness probe is used to determine if a pod is ready to serve traffic.
What is Kubernetes pod liveness probe?
Kubernetes pod liveness probe is used to determine if a pod is alive and running.
How do you troubleshoot a Kubernetes pod?
Troubleshooting a Kubernetes pod involves checking logs, investigating resource utilization, and inspecting the pod status and events.
What is Kubernetes kubectl logs?
Kubernetes kubectl logs is the command to retrieve the logs generated by a specific pod.
What is Kubernetes kubectl describe?
Kubernetes kubectl describe is the command to get detailed information about a Kubernetes object, such as a pod, replication controller, or service. Kubernetes Cluster Administration:
What is Kubernetes cluster management?
Kubernetes cluster management involves configuring and maintaining the Kubernetes control plane, worker nodes, and network settings.
What is Kubernetes API server authorization?
Kubernetes API server authorization controls who can access and perform actions against the Kubernetes API server.
What is Kubernetes cluster backup and restore?
Kubernetes cluster backup and restore involves backing up and restoring the configuration and data stored in the Kubernetes objects, such as pods, services, and deployments.
How does Kubernetes perform a rolling update?
Kubernetes performs a rolling update by gradually upgrading the replicas of a pod, ensuring that the application remains available and responsive during the update.
Kubernetes Best Practices:
What are the best practices for deploying applications in Kubernetes?
Best practices for deploying applications in Kubernetes include: Using declarative deployment methods, such as Deployments or Helm charts Separating concerns between services by deploying them in separate namespaces Using liveness and readiness probes to ensure the health of the application Setting resource limits and requests to ensure adequate resources for the application
What are the best practices for Kubernetes cluster security?
Best practices for Kubernetes cluster security include: Implementing Role-Based Access Control (RBAC) Using network policies to control traffic within the cluster Restricting external access to cluster components and API servers Implementing secured node access and communication between nodes in the cluster
What are the best practices for Kubernetes performance optimization?
Best practices for Kubernetes performance optimization include: Setting resource limits and requests to ensure adequate resources for the application Using horizontal and vertical pod autoscaling Optimizing container images for size and performance Monitoring and tuning system and application performance Developing with Kubernetes
What is Kubernetes operator?
Kubernetes operator is an extension of the Kubernetes API that enables the automation of complex application or cluster management operations.
What is Kubernetes custom resource definition?
Kubernetes custom resource definition is a way to extend the Kubernetes API with custom resources and APIs that are specific to a particular application or framework.
What is Kubernetes CRD controller?
Kubernetes CRD controller is used to define the behavior of the custom resources and their interactions with other Kubernetes components. Kubernetes Networking
What is Kubernetes Istio?
Kubernetes Istio is an open-source service mesh that provides traffic management, observability, and security for microservices-based applications.
What is Kubernetes service mesh?
Kubernetes service mesh is a dedicated infrastructure layer for managing service-to-service communication within a Kubernetes cluster.
What is Kubernetes Ingress?
Kubernetes Ingress is an API object that defines rules for directing inbound traffic to Kubernetes services.
What is Kubernetes gateway?
Kubernetes gateway is a network entry point that manages incoming and outgoing traffic for a service mesh.
Kubernetes Runtime:
What is Kubernetes containerd?
Kubernetes containerd is a lightweight, non-intrusive container runtime for Kubernetes.
What is Kubernetes CRI-O?
Kubernetes CRI-O is a container runtime designed specifically for Kubernetes, providing a lightweight and fast container runtime for Kubernetes environments.
What is Kubernetes KubeVirt?
Kubernetes KubeVirt is an open-source virtual machine runtime for Kubernetes, allowing users to deploy and manage virtual machines alongside Kubernetes workloads.
What is Kubernetes Kata Containers?
Kubernetes Kata Containers is a secure container runtime option for Kubernetes, providing hardware-implemented isolation to ensure security and isolation between containers.
Kubernetes Cloud-Native Development:
What is Kubernetes cloud-native development?
Kubernetes cloud-native development is a software development methodology that maximizes the use of Kubernetes to build, deploy, and manage cloud-native applications.
What is Kubernetes software development kit (SDK)?
Kubernetes software development kit (SDK) is a set of tools and libraries that help developers build, deploy and manage cloud-native applications on Kubernetes.
What is Kubernetes Helm?
Kubernetes Helm is a package manager for Kubernetes that provides templating and deployment automation for cloud-native applications.
Miscellaneous: What is the difference between a deployment and a stateful set in Kubernetes?
Deployments are used for stateless applications, while stateful sets are used for stateful applications, such as databases or other applications that require persistent and stable storage.
What is Kubernetes Configuration Management?
Kubernetes Configuration Management is the automated management of configuration files and settings across a Kubernetes cluster.
What is Kubernetes container orchestration?
Kubernetes container orchestration is the automated process of deploying, scaling, and managing containerized applications in a Kubernetes cluster.
What is Kubernetes containerization?
Kubernetes containerization is the process of packaging an application and all its dependencies into a container for deployment and management.
What is Kubernetes cloud deployment?
Kubernetes cloud deployment is the deployment of Kubernetes clusters on cloud platforms, such as AWS, Azure, or GCP.
What is Kubernetes on-premises deployment?
Kubernetes on-premises deployment is the deployment of Kubernetes clusters on private or enterprise servers and data centers.
Conclusion: These are some of the most commonly asked Kubernetes questions with detailed answers.
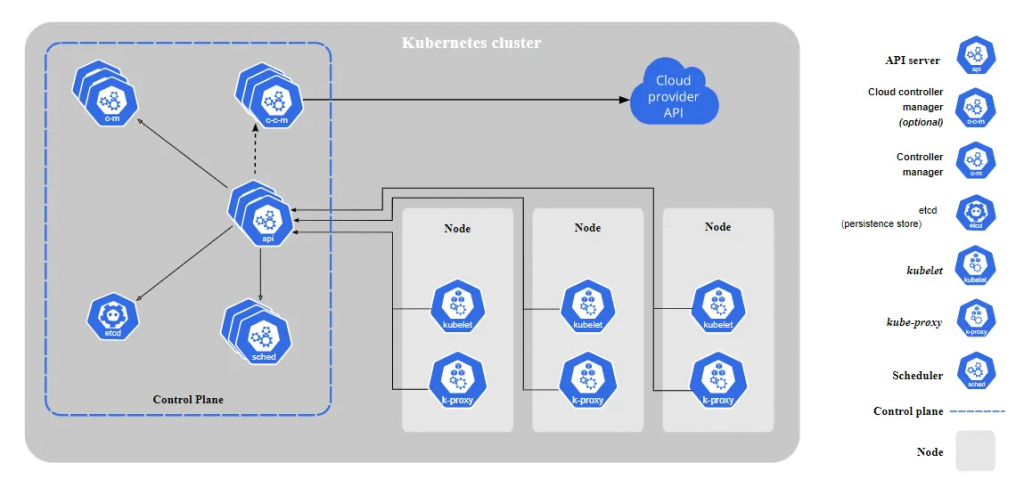
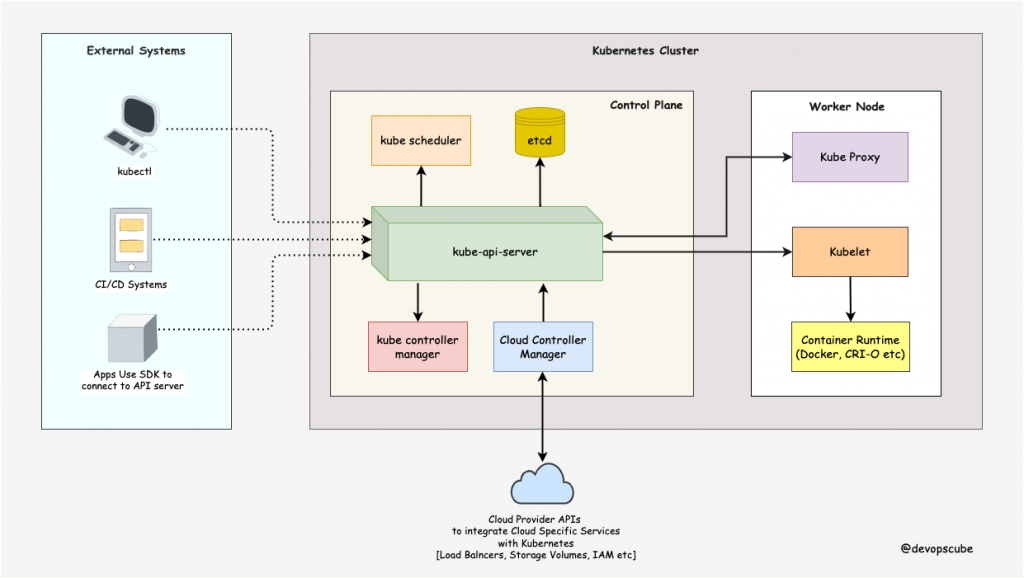
The following Kubernetes architecture diagram shows all the components of the Kubernetes cluster and how external systems connect to the Kubernetes cluster.
The first and foremost thing you should understand about Kubernetes is, that it is a distributed system. Meaning, it has multiple components spread across different servers over a network. These servers could be Virtual machines or bare metal servers. We call it a Kubernetes cluster.
A Kubernetes cluster consists of control plane nodes and worker nodes.
Control Plane
The control plane is responsible for container orchestration and maintaining the desired state of the cluster. It has the following components.
kube-apiserver
etcd
kube-scheduler
kube-controller-manager
cloud-controller-manager
Worker Node
The Worker nodes are responsible for running containerized applications. The worker Node has the following components.
kubelet
kube-proxy
Container runtime
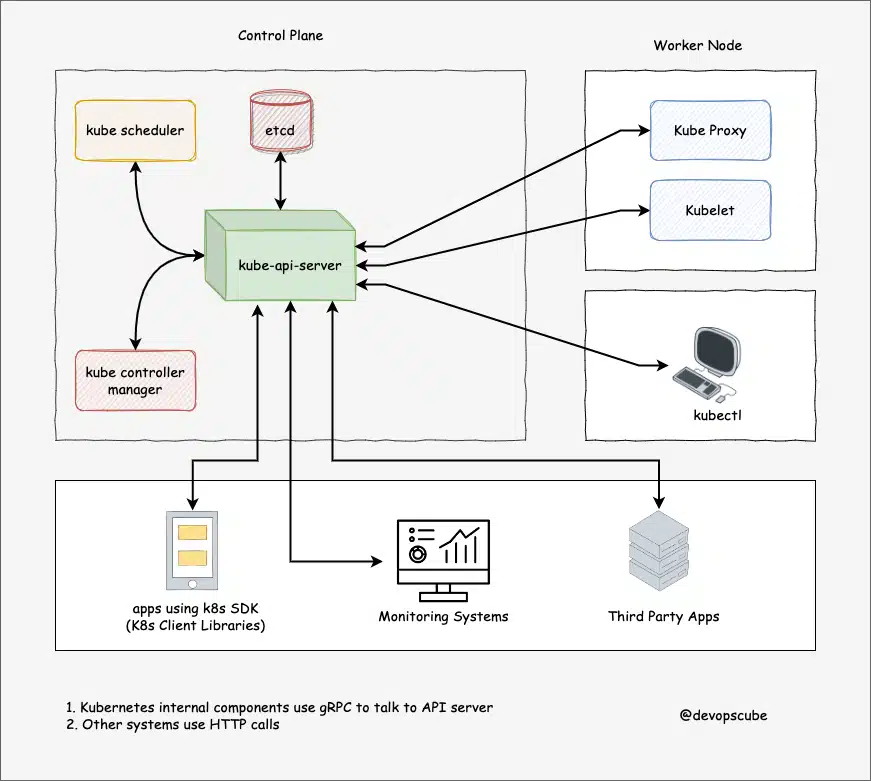
Kubernetes Control Plane Components
First, let’s take a look at each control plane component and the important concepts behind each component.
1. kube-apiserver
The kube-api server is the central hub of the Kubernetes cluster that exposes the Kubernetes API.
End users, and other cluster components, talk to the cluster via the API server. Very rarely monitoring systems and third-party services may talk to API servers to interact with the cluster.
So when you use kubectl to manage the cluster, at the backend you are actually communicating with the API server through HTTP REST APIs. However, the internal cluster components like the scheduler, controller, etc talk to the API server using gRPC.
The communication between the API server and other components in the cluster happens over TLS to prevent unauthorized access to the cluster.
Kubernetes api-server is responsible for the following
API management: Exposes the cluster API endpoint and handles all API requests.
Authentication (Using client certificates, bearer tokens, and HTTP Basic Authentication) and Authorization (ABAC and RBAC evaluation)
Processing API requests and validating data for the API objects like pods, services, etc. (Validation and Mutation Admission controllers)
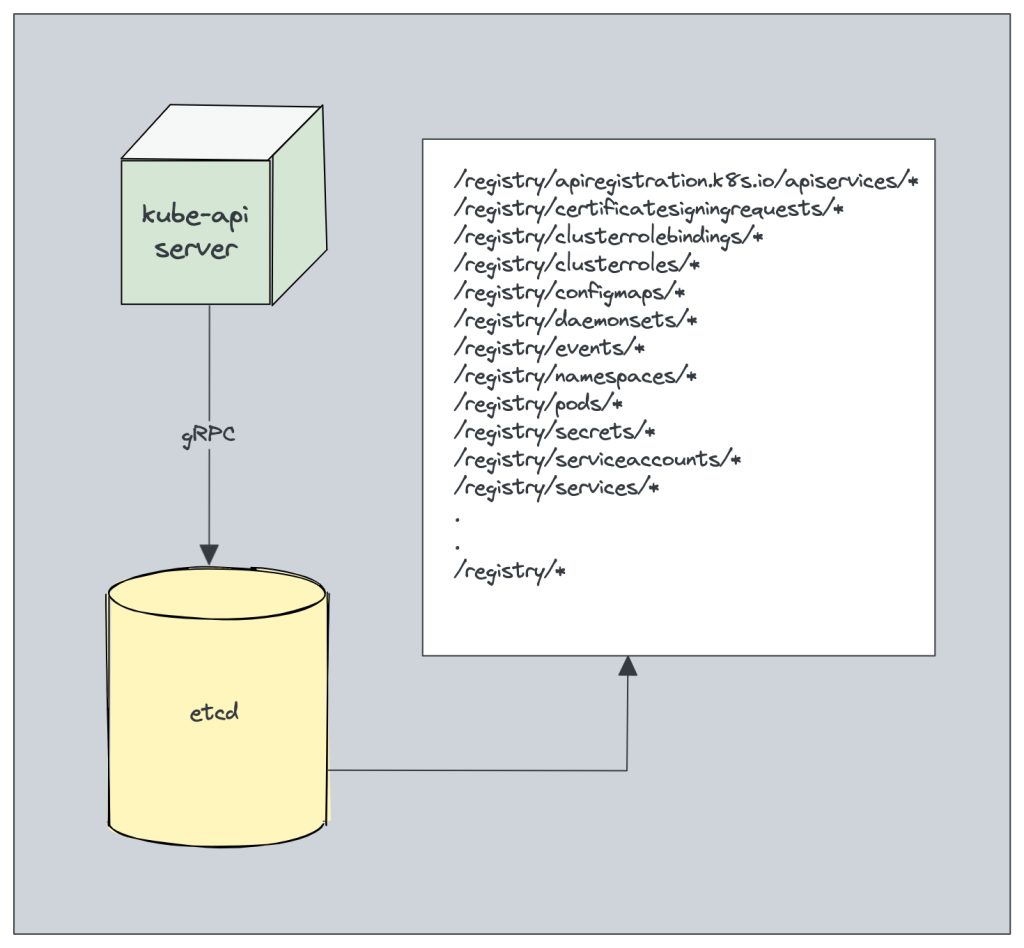
It is the only component that communicates with etcd.
api-server coordinates all the processes between the control plane and worker node components.
api-server has a built-in bastion apiserver proxy. It is part of the API server process. It is primarily used to enable access to ClusterIP services from outside the cluster, even though these services are typically only reachable within the cluster itself.
Note: To reduce the cluster attack surface, it is crucial to secure the API server. The Shadowserver Foundation has conducted an experiment that discovered 380 000 publicly accessible Kubernetes API servers.
2. etcd
Kubernetes is a distributed system and it needs an efficient distributed database like etcd that supports its distributed nature. It acts as both a backend service discovery and a database. You can call it the brain of the Kubernetes cluster.
etcd is an open-source strongly consistent, distributed key-value store. So what does it mean?
Strongly consistent: If an update is made to a node, strong consistency will ensure it gets updated to all the other nodes in the cluster immediately. Also if you look at CAP theorem, achieving 100% availability with strong consistency and & Partition Tolerance is impossible.
Distributed: etcd is designed to run on multiple nodes as a cluster without sacrificing consistency.
Key Value Store: A nonrelational database that stores data as keys and values. It also exposes a key-value API. The datastore is built on top of BboltDB which is a fork of BoltDB.
etcd uses raft consensus algorithm for strong consistency and availability. It works in a leader-member fashion for high availability and to withstand node failures.
So how does etcd work with Kubernetes?
To put it simply, when you use kubectl to get kubernetes object details, you are getting it from etcd. Also, when you deploy an object like a pod, an entry gets created in etcd.
In a nutshell, here is what you need to know about etcd.
etcd stores all configurations, states, and metadata of Kubernetes objects (pods, secrets, daemonsets, deployments, configmaps, statefulsets, etc).
etcd allows a client to subscribe to events using Watch() API . Kubernetes api-server uses the etcd’s watch functionality to track the change in the state of an object.
etcd exposes key-value API using gRPC. Also, the gRPC gateway is a RESTful proxy that translates all the HTTP API calls into gRPC messages. This makes it an ideal database for Kubernetes.
etcd stores all objects under the /registry directory key in key-value format. For example, information on a pod named Nginx in the default namespace can be found under /registry/pods/default/nginx
Also, etcd it is the only Statefulset component in the control plane.
3. kube-scheduler
The kube-scheduler is responsible for scheduling Kubernetes pods on worker nodes.
When you deploy a pod, you specify the pod requirements such as CPU, memory, affinity, taints or tolerations, priority, persistent volumes (PV), etc. The scheduler’s primary task is to identify the create request and choose the best node for a pod that satisfies the requirements.
The following image shows a high-level overview of how the scheduler works.
In a Kubernetes cluster, there will be more than one worker node. So how does the scheduler select the node out of all worker nodes?
Here is how the scheduler works.
To choose the best node, the Kube-scheduler uses filtering and scoring operations.
In filtering, the scheduler finds the best-suited nodes where the pod can be scheduled. For example, if there are five worker nodes with resource availability to run the pod, it selects all five nodes. If there are no nodes, then the pod is unschedulable and moved to the scheduling queue. If It is a large cluster, let’s say 100 worker nodes, and the scheduler doesn’t iterate over all the nodes. There is a scheduler configuration parameter called percentageOfNodesToScore. The default value is typically 50%. So it tries to iterate over 50% of nodes in a round-robin fashion. If the worker nodes are spread across multiple zones, then the scheduler iterates over nodes in different zones. For very large clusters the default percentageOfNodesToScore is 5%.
In the scoring phase, the scheduler ranks the nodes by assigning a score to the filtered worker nodes. The scheduler makes the scoring by calling multiple scheduling plugins. Finally, the worker node with the highest rank will be selected for scheduling the pod. If all the nodes have the same rank, a node will be selected at random.
Once the node is selected, the scheduler creates a binding event in the API server. Meaning an event to bind a pod and node.
Here is shat you need to know about a scheduler.
It is a controller that listens to pod creation events in the API server.
The scheduler has two phases. Scheduling cycle and the Binding cycle. Together it is called the scheduling context.Thescheduling cycle selects a worker node and the binding cycle applies that change to the cluster.
The scheduler always places the high-priority pods ahead of the low-priority pods for scheduling. Also, in some cases, after the pod starts running in the selected node, the pod might get evicted or moved to other nodes. If you want to understand more, read the Kubernetes pod priority guide
You can create custom schedulers and run multiple schedulers in a cluster along with the native scheduler. When you deploy a pod you can specify the custom scheduler in the pod manifest. So the scheduling decisions will be taken based on the custom scheduler logic.
The scheduler has a pluggable scheduling framework. Meaning, that you can add your custom plugin to the scheduling workflow.
4. Kube Controller Manager
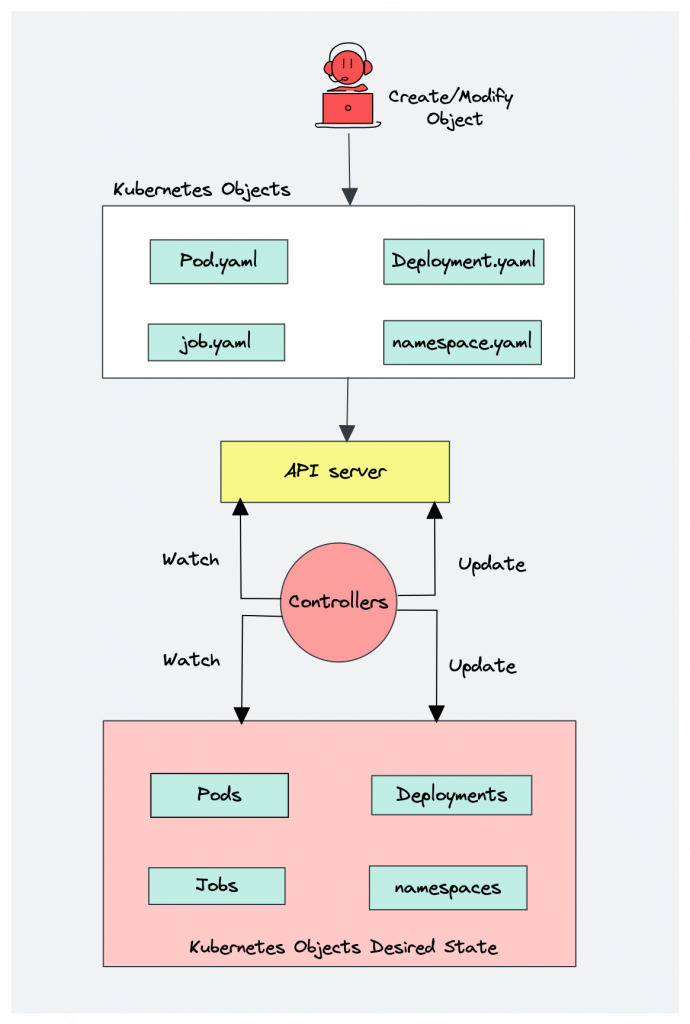
What is a controller? Controllers are programs that run infinite control loops. Meaning it runs continuously and watches the actual and desired state of objects. If there is a difference in the actual and desired state, it ensures that the kubernetes resource/object is in the desired state.
As per the official documentation,
In Kubernetes, controllers are control loops that watch the state of your cluster, then make or request changes where needed. Each controller tries to move the current cluster state closer to the desired state.
Let’s say you want to create a deployment, you specify the desired state in the manifest YAML file (declarative approach). For example, 2 replicas, one volume mount, configmap, etc. The in-built deployment controller ensures that the deployment is in the desired state all the time. If a user updates the deployment with 5 replicas, the deployment controller recognizes it and ensures the desired state is 5 replicas.
Kube controller manager is a component that manages all the Kubernetes controllers. Kubernetes resources/objects like pods, namespaces, jobs, replicaset are managed by respective controllers. Also, the Kube scheduler is also a controller managed by the Kube controller manager.
Following is the list of important built-in Kubernetes controllers.
Here is what you should know about the Kube controller manager.
It manages all the controllers and the controllers try to keep the cluster in the desired state.
You can extend kubernetes with custom controllers associated with a custom resource definition.
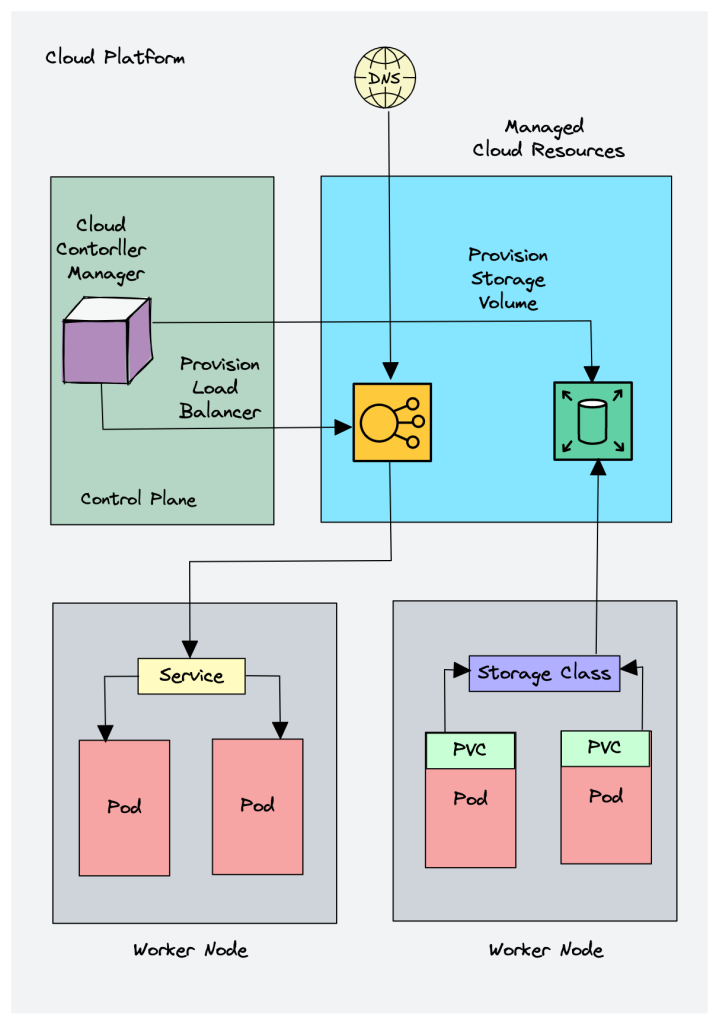
5. Cloud Controller Manager (CCM)
When kubernetes is deployed in cloud environments, the cloud controller manager acts as a bridge between Cloud Platform APIs and the Kubernetes cluster.
This way the core kubernetes core components can work independently and allow the cloud providers to integrate with kubernetes using plugins. (For example, an interface between kubernetes cluster and AWS cloud API)
Cloud controller integration allows Kubernetes cluster to provision cloud resources like instances (for nodes), Load Balancers (for services), and Storage Volumes (for persistent volumes).
Cloud Controller Manager contains a set of cloud platform-specific controllers that ensure the desired state of cloud-specific components (nodes, Loadbalancers, storage, etc). Following are the three main controllers that are part of the cloud controller manager.
Node controller: This controller updates node-related information by talking to the cloud provider API. For example, node labeling & annotation, getting hostname, CPU & memory availability, nodes health, etc.
Route controller: It is responsible for configuring networking routes on a cloud platform. So that pods in different nodes can talk to each other.
Service controller: It takes care of deploying load balancers for kubernetes services, assigning IP addresses, etc.
Following are some of the classic examples of cloud controller manager.
Deploying Kubernetes Service of type Load balancer. Here Kubernetes provisions a Cloud-specific Loadbalancer and integrates with Kubernetes Service.
Provisioning storage volumes (PV) for pods backed by cloud storage solutions.
Overall Cloud Controller Manager manages the lifecycle of cloud-specific resources used by kubernetes.
Kubernetes Worker Node Components
Now let’s look at each of the worker node components.
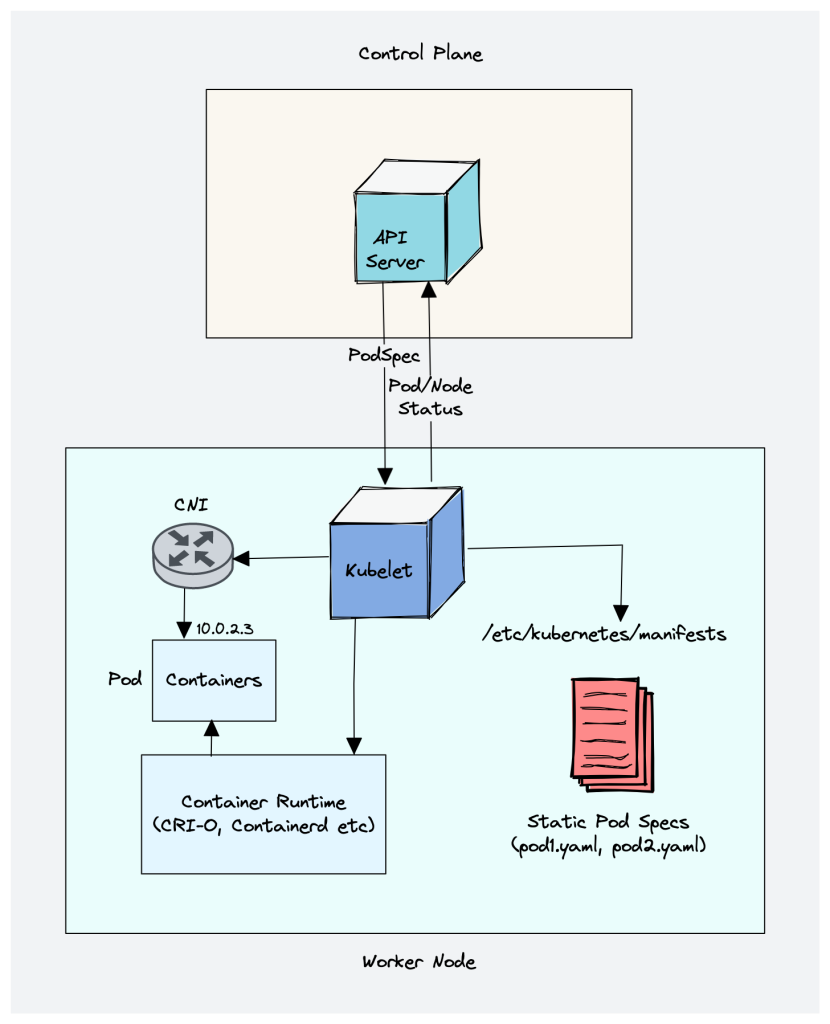
1. Kubelet
Kubelet is an agent component that runs on every node in the cluster. t does not run as a container instead runs as a daemon, managed by systemd.
It is responsible for registering worker nodes with the API server and working with the podSpec (Pod specification – YAML or JSON) primarily from the API server. podSpec defines the containers that should run inside the pod, their resources (e.g. CPU and memory limits), and other settings such as environment variables, volumes, and labels.
It then brings the podSpec to the desired state by creating containers.
To put it simply, kubelet is responsible for the following.
Creating, modifying, and deleting containers for the pod.
Responsible for handling liveliness, readiness, and startup probes.
Responsible for Mounting volumes by reading pod configuration and creating respective directories on the host for the volume mount.
Collecting and reporting Node and pod status via calls to the API server with implementations like cAdvisor and CRI.
Kubelet is also a controller that watches for pod changes and utilizes the node’s container runtime to pull images, run containers, etc.
Other than PodSpecs from the API server, kubelet can accept podSpec from a file, HTTP endpoint, and HTTP server. A good example of “podSpec from a file” is Kubernetes static pods.
Static pods are controlled by kubelet, not the API servers.
This means you can create pods by providing a pod YAML location to the Kubelet component. However, static pods created by Kubelet are not managed by the API server.
Here is a real-world example use case of the static pod.
While bootstrapping the control plane, kubelet starts the api-server, scheduler, and controller manager as static pods from podSpecs located at /etc/kubernetes/manifests
Following are some of the key things about kubelet.
Kubelet uses the CRI (container runtime interface) gRPC interface to talk to the container runtime.
It also exposes an HTTP endpoint to stream logs and provides exec sessions for clients.
Uses the CSI (container storage interface) gRPC to configure block volumes.
It uses the CNI plugin configured in the cluster to allocate the pod IP address and set up any necessary network routes and firewall rules for the pod.
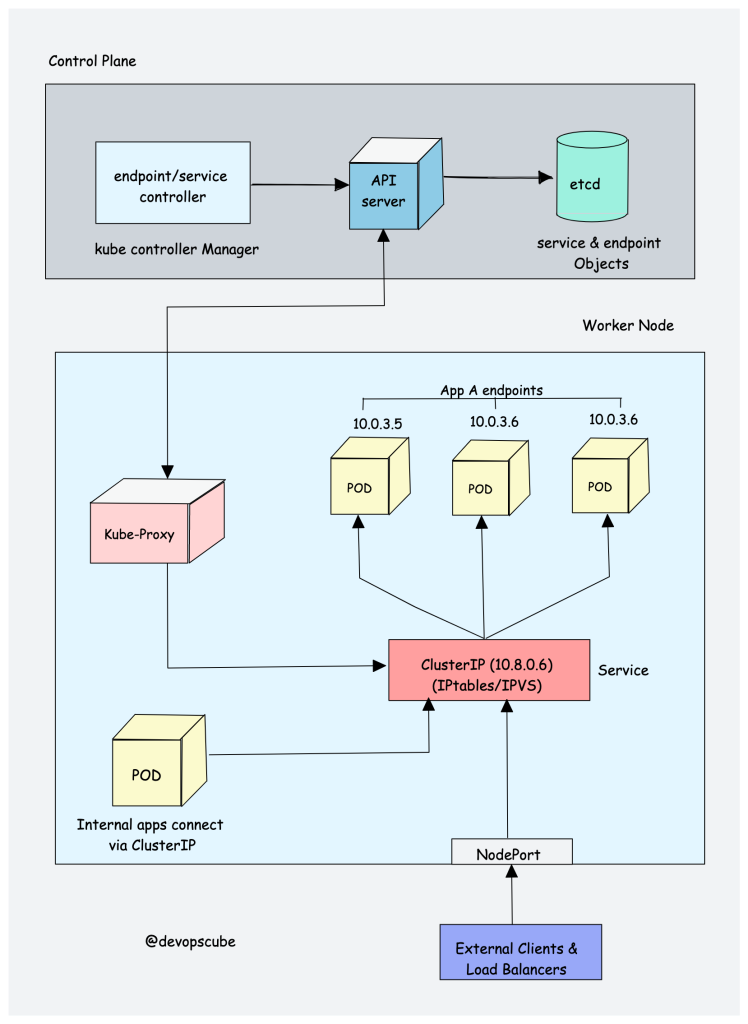
2. Kube proxy
To understand Kube proxy, you need to have a basic knowledge of Kubernetes Service & endpoint objects.
Service in Kubernetes is a way to expose a set of pods internally or to external traffic. When you create the service object, it gets a virtual IP assigned to it. It is called clusterIP. It is only accessible within the Kubernetes cluster.
The Endpoint object contains all the IP addresses and ports of pod groups under a Service object. The endpoints controller is responsible for maintaining a list of pod IP addresses (endpoints). The service controller is responsible for configuring endpoints to a service.
You cannot ping the ClusterIP because it is only used for service discovery, unlike pod IPs which are pingable.
Now let’s understand Kube Proxy.
Kube-proxy is a daemon that runs on every node as a daemonset. It is a proxy component that implements the Kubernetes Services concept for pods. (single DNS for a set of pods with load balancing). It primarily proxies UDP, TCP, and SCTP and does not understand HTTP.
When you expose pods using a Service (ClusterIP), Kube-proxy creates network rules to send traffic to the backend pods (endpoints) grouped under the Service object. Meaning, all the load balancing, and service discovery are handled by the Kube proxy.
So how does Kube-proxy work?
Kube proxy talks to the API server to get the details about the Service (ClusterIP) and respective pod IPs & ports (endpoints). It also monitors for changes in service and endpoints.
Kube-proxy then uses any one of the following modes to create/update rules for routing traffic to pods behind a Service
IPTables: It is the default mode. In IPTables mode, the traffic is handled by IPtable rules. This means that for each service, IPtable rules are created. These rules capture the traffic coming to the ClusterIP and then forward it to the backend pods. Also, In this mode, kube-proxy chooses the backend pod random for load balancing. Once the connection is established, the requests go to the same pod until the connection is terminated.
IPVS: For clusters with services exceeding 1000, IPVS offers performance improvement. It supports the following load-balancing algorithms for the backend.
rr: round-robin : It is the default mode.
lc: least connection (smallest number of open connections)
dh: destination hashing
sh: source hashing
sed: shortest expected delay
nq: never queue
Userspace (legacy & not recommended)
Kernelspace: This mode is only for Windows systems.
If you would like to understand the performance difference between kube-proxy IPtables and IPVS mode, read this article.
Also, you can run a Kubernetes cluster without kube-proxy by replacing it with Cilium.
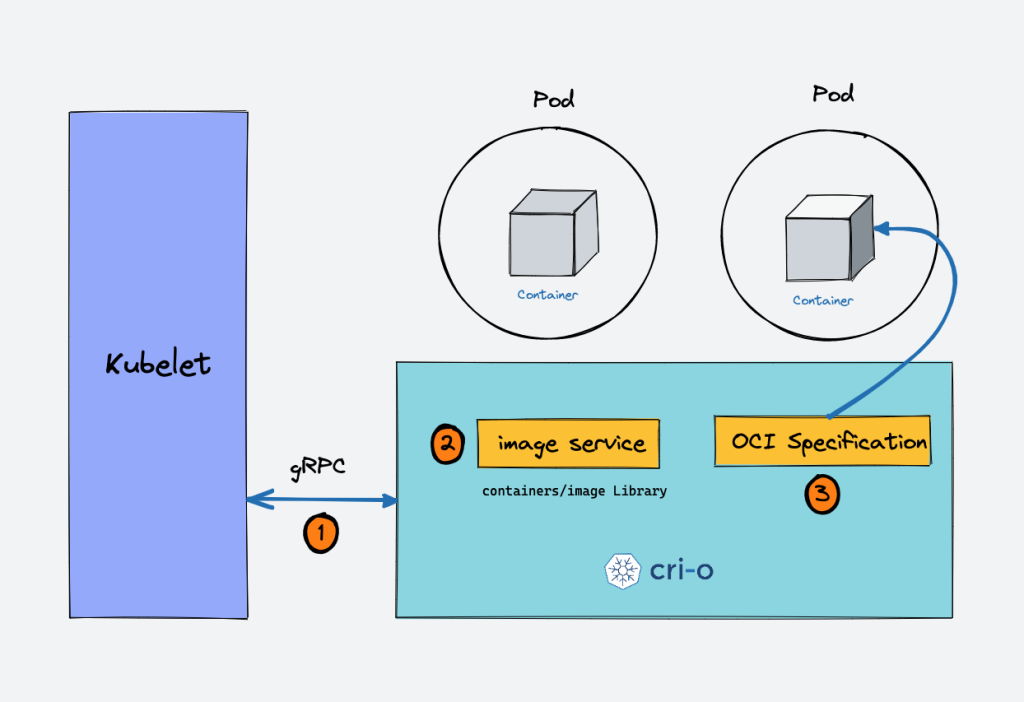
3. Container Runtime
You probably know about Java Runtime (JRE). It is the software required to run Java programs on a host. In the same way, container runtime is a software component that is required to run containers.
Container runtime runs on all the nodes in the Kubernetes cluster. It is responsible for pulling images from container registries, running containers, allocating and isolating resources for containers, and managing the entire lifecycle of a container on a host.
To understand this better, let’s take a look at two key concepts:
Container Runtime Interface (CRI): It is a set of APIs that allows Kubernetes to interact with different container runtimes. It allows different container runtimes to be used interchangeably with Kubernetes. The CRI defines the API for creating, starting, stopping, and deleting containers, as well as for managing images and container networks.
Open Container Initiative (OCI): It is a set of standards for container formats and runtimes
Kubernetes supports multiple container runtimes (CRI-O, Docker Engine, containerd, etc) that are compliant with Container Runtime Interface (CRI). This means, all these container runtimes implement the CRI interface and expose gRPC CRI APIs (runtime and image service endpoints).
So how does Kubernetes make use of the container runtime?
As we learned in the Kubelet section, the kubelet agent is responsible for interacting with the container runtime using CRI APIs to manage the lifecycle of a container. It also gets all the container information from the container runtime and provides it to the control plane.
Let’s take an example of CRI-O container runtime interface. Here is a high-level overview of how container runtime works with kubernetes.
When there is a new request for a pod from the API server, the kubelet talks to CRI-O daemon to launch the required containers via Kubernetes Container Runtime Interface.
CRI-O checks and pulls the required container image from the configured container registry using containers/image library.
CRI-O then generates OCI runtime specification (JSON) for a container.
CRI-O then launches an OCI-compatible runtime (runc) to start the container process as per the runtime specification.
Kubernetes Cluster Addon Components
Apart from the core components, the kubernetes cluster needs addon components to be fully operational. Choosing an addon depends on the project requirements and use cases.
Following are some of the popular addon components that you might need on a cluster.
CNI Plugin (Container Network Interface)
CoreDNS (For DNS server): CoreDNS acts as a DNS server within the Kubernetes cluster. By enabling this addon, you can enable DNS-based service discovery.
Metrics Server (For Resource Metrics): This addon helps you collect performance data and resource usage of Nodes and pods in the cluster.
Web UI (Kubernetes Dashboard): This addon enables the Kubernetes dashboard to manage the object via web UI.
It is a plugin-based architecture with vendor-neutral specifications and libraries for creating network interfaces for Containers.
It is not specific to Kubernetes. With CNI container networking can be standardized across container orchestration tools like Kubernetes, Mesos, CloudFoundry, Podman, Docker, etc.
When it comes to container networking, companies might have different requirements such as network isolation, security, encryption, etc. As container technology advanced, many network providers created CNI-based solutions for containers with a wide range of networking capabilities. You can call it CNI-Plugins
This allows users to choose a networking solution that best fits their needs from different providers.
How does the CNI Plugin work with Kubernetes?
The Kube-controller-manager is responsible for assigning pod CIDR to each node. Each pod gets a unique IP address from the pod CIDR.
Kubelet interacts with container runtime to launch the scheduled pod. The CRI plugin which is part of the Container runtime interacts with the CNI plugin to configure the pod network.
CNI Plugin enables networking between pods spread across the same or different nodes using an overlay network.
Following are high-level functionalities provided by CNI plugins.
Pod Networking
Pod network security & isolation using Network Policies to control the traffic flow between pods and between namespaces.
Some popular CNI plugins include:
Calico
Flannel
Weave Net
Cilium (Uses eBPF)
Amazon VPC CNI (For AWS VPC)
Azure CNI (For Azure Virtual network)Kubernetes networking is a big topic and it differs based on the hosting platforms.
Kubernetes Native Objects
Till now we have learned about the core kubernetes components and how each component works.
All these components work towards managing the following key Kubernetes objects.
Pod
Namespaces
Replicaset
Deployment
Daemonset
Statefulset
Jobs & Cronjobs
Also, Kubernetes is extendable using CRDs, and Custom Controllers. So the cluster components also manage the objects created using custom controllers and custom resource definitions.
Kubernetes Architecture FAQs
What is the main purpose of the Kubernetes control plane?
The control plane is responsible for maintaining the desired state of the cluster and the applications running on it. It consists of components such as the API server, etcd, Scheduler, and controller manager.
What is the purpose of the worker nodes in a Kubernetes cluster?
Worker nodes are the servers (either bare-metal or virtual) that run the container in the cluster. They are managed by the control plane and receive instructions from it on how to run the containers that are part of pods.
How is communication between the control plane and worker nodes secured in Kubernetes?
Communication between the control plane and worker nodes is secured using PKI certificates and communication between different components happens over TLS. This way, only trusted components can communicate with each other.
What is the purpose of the etcd key-value store in Kubernetes?
Etcd primarily stores the kubernetes objects, cluster information, node information, and configuration data of the cluster, such as the desired state of the applications running on the cluster.
What happens to Kubernetes applications if the etcd goes down?
While the running applications will not be affected if etcd experiences an outage, it will not be possible to create or update any objects without a functioning etcd
Conclusion
Understanding Kubernetes architecture helps you with day-to-day Kubernetes implementation and operations.
When implementing a production-level cluster setup, having the right knowledge of Kubernetes components will help you run and troubleshoot applications.
Next, you can start with step-by-step kubernetes tutorials to get hands-on experience with Kubernetes objects and resources.
If you’re having trouble reading the directories in the $PATH variable, you can make use of the tr command to replace the colons with the newline characters so each directory is displayed on a single line.
Hello Debian users, are you looking to install the widely used LAMP Stack on your system? This will empower you to develop and deploy incredible websites.
If you’re interested, follow along with this comprehensive guide that outlines the installation process for LAMP on your Debian 12 system.
Contents :
What is LAMP?
Install Apache in Debian 12
Install MariaDB in Debian 12
Install PHP, Perl, and Python in Debian 12
Install PHP in Debian
Install Python in Debian
Install Python in Debian
Check PHP Info on Debian
Create a Virtual Hosting for a Website Using LAMP
Host a Website on LAMP Stack
Conclusion
What is LAMP?
LAMP is a combination of four powerful open-source tools (Linux, Apache, MariaDB, PHP) which aid in building and hosting websites and applications.
Linux (Debian 12) is a free, open-source operating system, Apache serves as the web server, MariaDB is a powerful database server and PHP is the programming language.
Before MariaDB, MySQL was used in the LAMP stack. However, some people argue about using Python or Perl in place of PHP now.
Let’s initiate the process of LAMP Stack installation on a fresh Debian 12 installation.
Install Apache in Debian 12
Begin by executing the provided apt command to refresh the local package repository cache, which will update the package lists and upgrade any installed packages:
$ sudo apt update && sudo apt upgrade -y
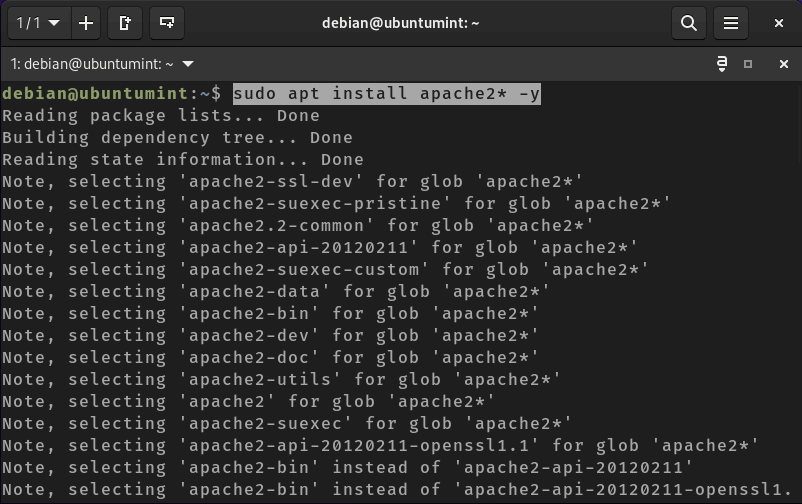
With your repositories and packages now up-to-date, proceed to install the Apache web server from the official repository:
$ sudo apt install apache2* -y
Install Apache in Debian
Now that Apache2 is installed on your system, verify its version by running the following command:
$ sudo apache2 -v
Server version: Apache/2.4.57 (Debian)
Server built: 2023-04-13T03:26:51
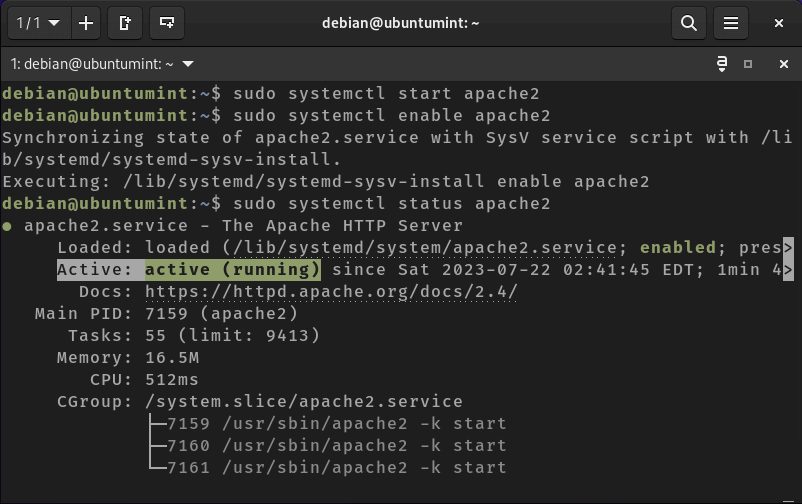
To initiate the service of your Apache2 web server, execute the ‘systemctl start‘ command provided below.
$ sudo systemctl start apache2
After initiating your web server service, you can also run the command to enable the Apache2 service to start automatically after a reboot:
$ sudo systemctl enable apache2
Moving forward, we can examine the status of the Apache2 service using the command below.
$ sudo systemctl status apache2
Check Apache Status
Next, you should configure your firewall to allow access to the Apache web server from any web browser:
$ sudo ufw allow 80
$ sudo ufw reload
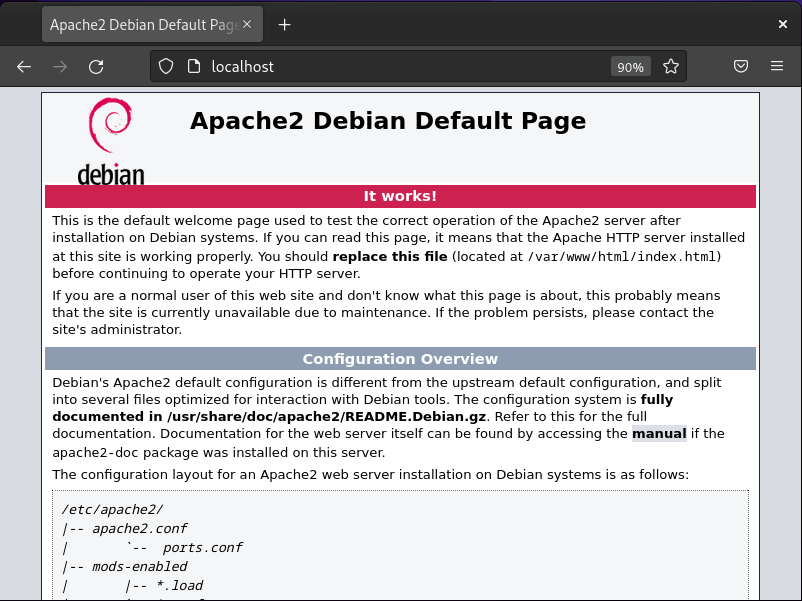
Next, let’s check if our Apache2 server is running successfully. To do this, open any web browser and enter “http://localhost” in the address bar.
Check Apache Web Page
However, you can also access the Apache page by entering your server’s IP address or domain name:
http://your_server_ip/
OR
http://your_domain.com/
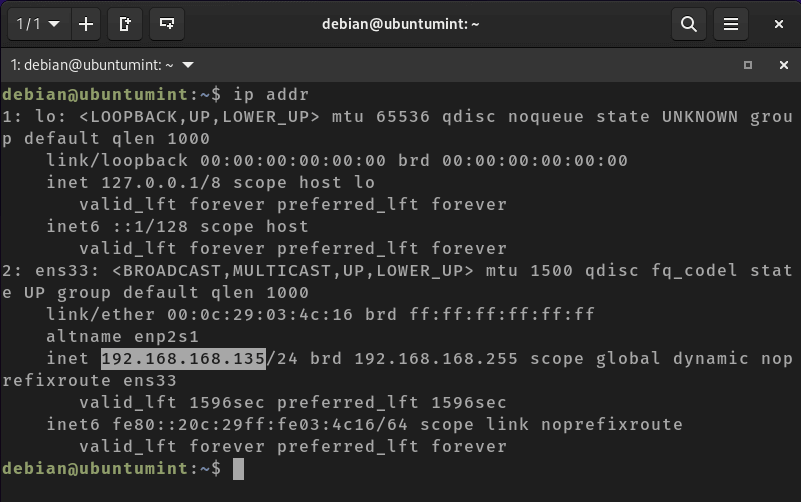
If you are unsure about your server’s IP address, run the ‘ip addr‘ command to locate it:
$ ip addr
Find Linux Server IP Address
Install MariaDB in Debian 12
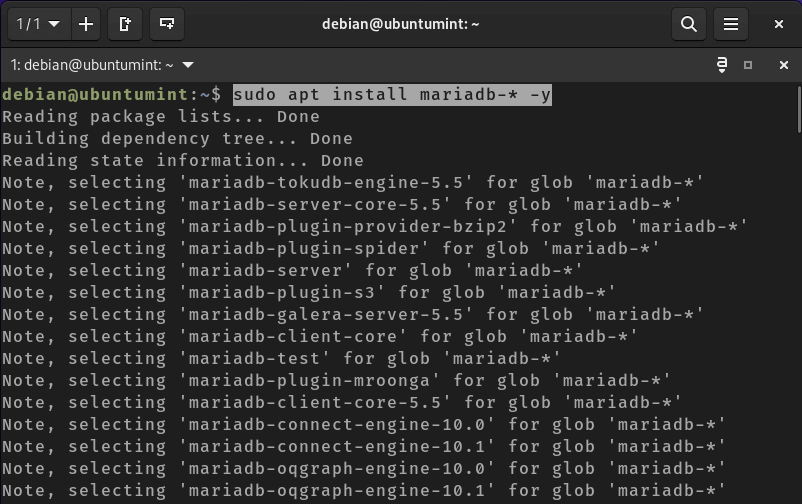
MariaDB is a widely used, high-speed, open-source relational database system that assists users in storing and organizing their data.
To utilize the MariaDB database server, execute the provided command to install it:
$ sudo apt install mariadb-* -y
Install MariaDB in Debian
To view the version of the installed MariaDB server, type the following:
$ mariadb -V
mariadb Ver 15.1 Distrib 10.11.3-MariaDB, for debian-linux-gnu (x86_64) using EditLine wrapper
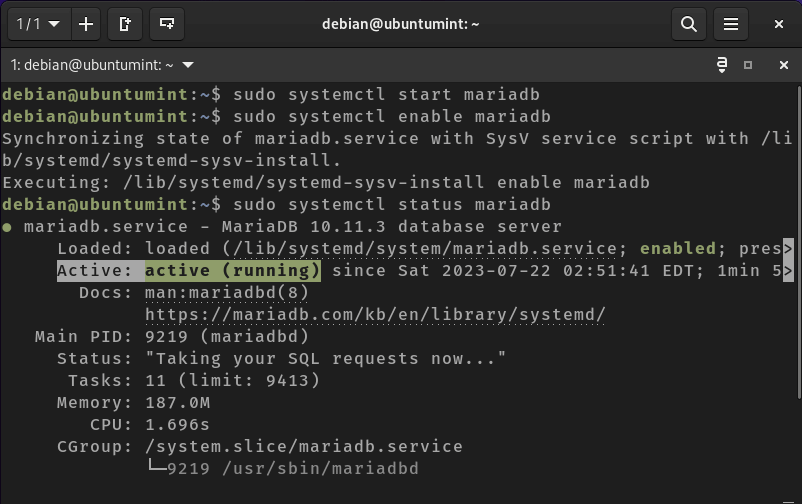
Next, initiate, enable, and verify the status of your MariaDB database server service:
$ sudo systemctl start mariadb
$ sudo systemctl enable mariadb
$ sudo systemctl status mariadb
Check MariaDB in Debian
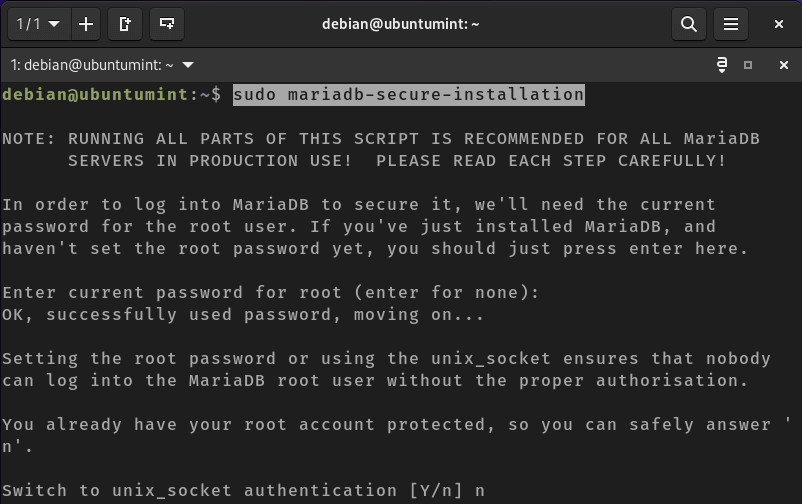
Lastly, we will run the following command to ensure the security of our database server:
$ sudo mariadb-secure-installation
Note: The primary aim of this command is to generate robust passwords, eliminate anonymous users and unnecessary databases, and disable remote logins. However, you can customize the security settings of your database according to your preferences.
The terminal will present various questions. Read and respond to them correctly.
Secure MariaDB in Debian
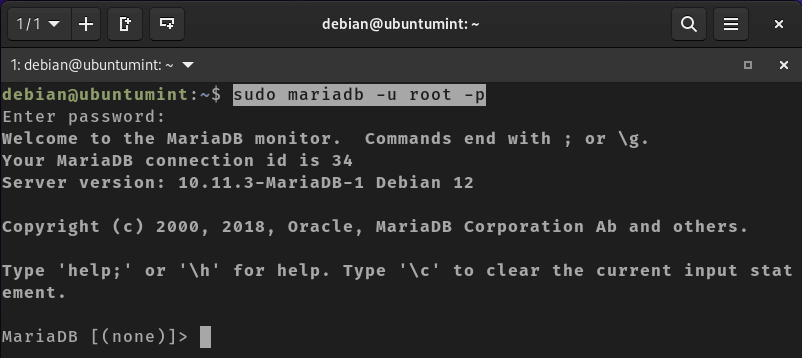
After securing your database, log in to it by executing the provided command. The terminal will request your password. Enter the password you previously set for your database to successfully access your database server:
$ sudo mariadb -u root -p
Connect MySQL to Debian
After successfully logging into your database server, you can create and manage your databases. Since we have already set up Linux and installed Apache and MariaDB, we can finalize our LAMP stack installation by adding PHP.
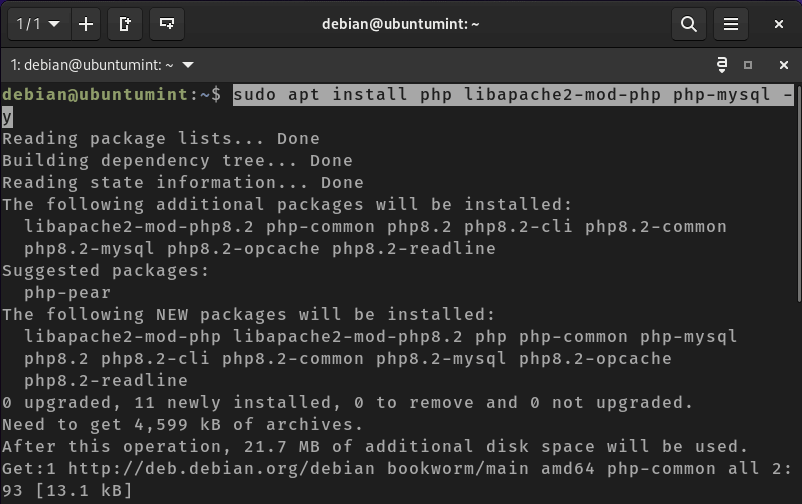
Install PHP, Perl, and Python in Debian 12
Although the ‘P‘ in the LAMP stack traditionally stands for the PHP programming language, there is an ongoing discussion about potentially replacing it with Perl or Python.
In this context, we will install PHP, Python, and Perl.
Install PHP in Debian
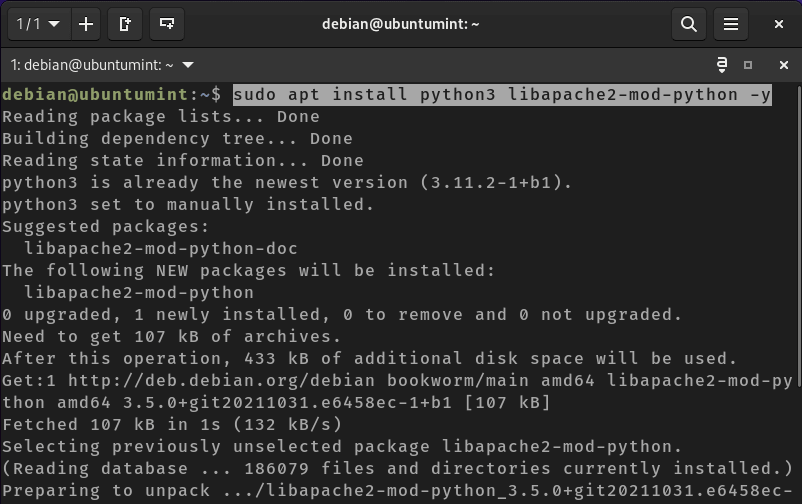
To install PHP, execute the command provided below:
To verify the installed version of Python3, enter the following command:
$ python3 –version
Python 3.11.2
With our LAMP stack now fully configured and operational, let’s assess its functionality by hosting a PHP website on it.
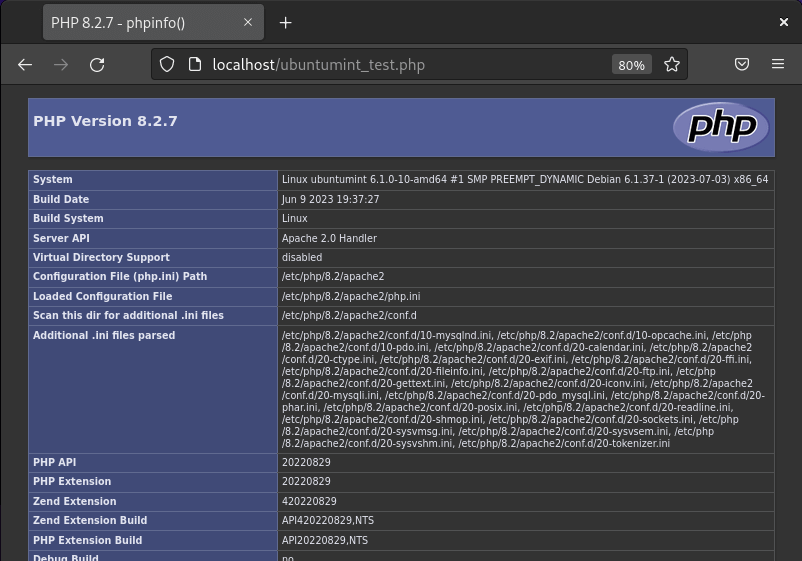
Check PHP Info on Debian
Begin by creating a PHP file named “ubuntumint_test.php” within the Apache2 directory using the nano editor:
$ sudo nano /var/www/html/ubuntumint_test.php
Next, add the following line to the file, which will display comprehensive information about the PHP installation and configuration:
<?php phpinfo(); ?>
Now, open a web browser and enter the following URL to view your successfully deployed webpage using the LAMP stack:
http://localhost/ubuntumint_test.php
OR
http://your_server_ip/ubuntumint_test.php
OR
http://your_domain.com/ubuntumint_test.php
Check PHP Info in Debian
Here, we can observe that our sample website is hosted on an Apache web server. Continuing, we will thoroughly test the functionality of our LAMP Stack by creating a virtual host and deploying a PHP website on it, along with connecting to a MariaDB database.
Create a Virtual Hosting for a Website Using LAMP
Apache provides the capability to create virtual hosts, a feature that enables hosting multiple domains on a single server.
In Debian 12, the default configuration of Apache includes a server block designed to serve a single website, with its documents located in the “/var/www/html” directory.
However, if your intention is to host multiple websites on Apache, you can accomplish this by creating a new directory within the “/var/www/” directory using the “mkdir” command. This new directory should be named after your domain:
$ sudo mkdir /var/www/ubuntumint
Now that we’ve successfully created a directory named “ubuntumint”, let’s assign ownership of this directory to the “$USER” environment variable, as illustrated below:
$ sudo chown -R $USER:$USER /var/www/ubuntumint
Next, generate a new configuration file named “ubuntumint.conf” within the “sites-available” directory, which will guide Apache on how to handle the specified domain name:
In this new file, copy and paste the code provided below. Remember to modify the values of “ServerName”, “ServerAlias”, “DocumentRoot”, and “Directory” to match your domain settings:
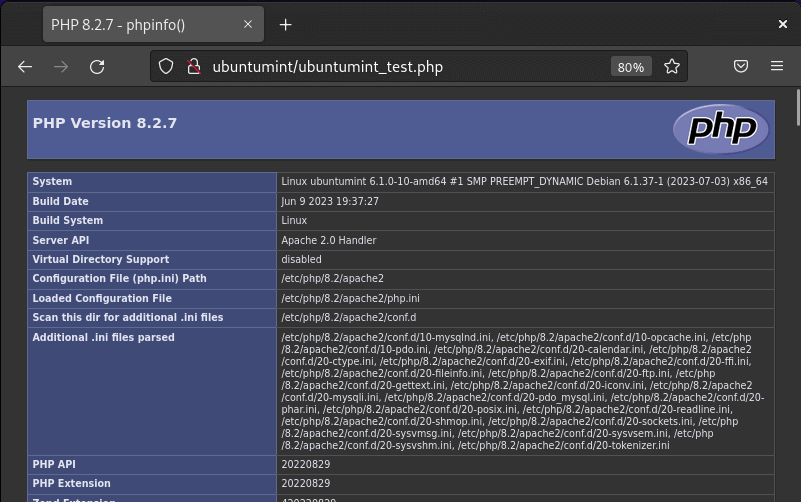
Now that you’ve established a domain for your website, you can access your website by entering the following URL into your web browser.
http://your_domain.com/ubuntumint_test.php
Verify Virtual Hosting Domain
Observe that your website is successfully hosted on the custom domain instead of localhost. This demonstrates how to configure your Apache web server for hosting any website.
Host a Website on LAMP Stack
In this step, we will cover the configuration and testing of the MariaDB database server and PHP for website creation. Subsequently, we will proceed to host this website using the custom domain on the Apache web server.
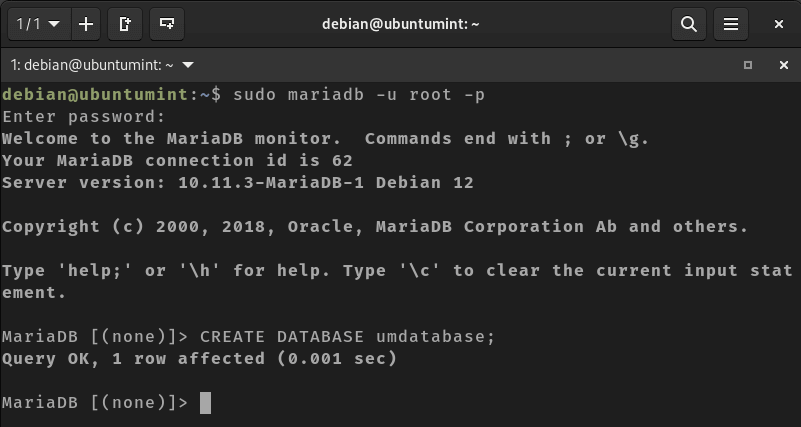
Now connect to the MariaDB database server and create a new database named “umdatabase”:
$ sudo mariadb -u root -p
$ CREATE DATABASE umdatabase;
Create MySQL Database
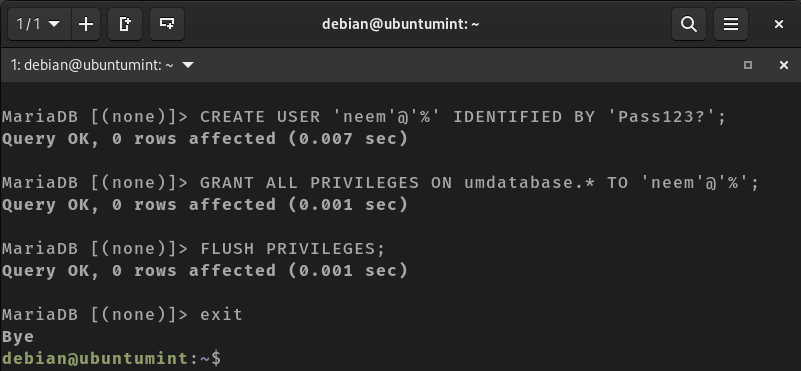
After successfully creating a new database, proceed to create a new user named “neem” for all databases and set its password as “Pass123?”. If you encounter any errors, consult MariaDB’s password policy for guidance:
CREATE USER ‘neem’@’%’ IDENTIFIED BY ‘Pass123?’;
Next, provide the necessary or all privileges to this user by executing the “GRANT” command:
GRANT ALL PRIVILEGES ON umdatabase.* TO ‘neem’@’%’;
After granting permissions, it’s necessary to reload the privileges by executing the following command:
FLUSH PRIVILEGES;
Create Database User
Continuing, let’s generate a new PHP file named “lampUser.php” in the domain’s directory using the nano editor:
$ sudo nano /var/www/ubuntumint/lampUser.php
In this file, copy and paste the code provided below to create a website capable of storing data in the MariaDB database. This code will establish a connection to the database and display an error message if any issues arise during the connection:
<?php // Database connection parameters
$dbHost = “localhost”; // Replace with your database host
$dbUsername = “neem”; // Replace with your database username $dbPassword = “Pass123?”; // Replace with your database password $dbName = “umdatabase”; // Replace with your database name
// change your database connection parameters according to your system
// Create a database connection
$conn = new mysqli($dbHost, $dbUsername, $dbPassword, $dbName);
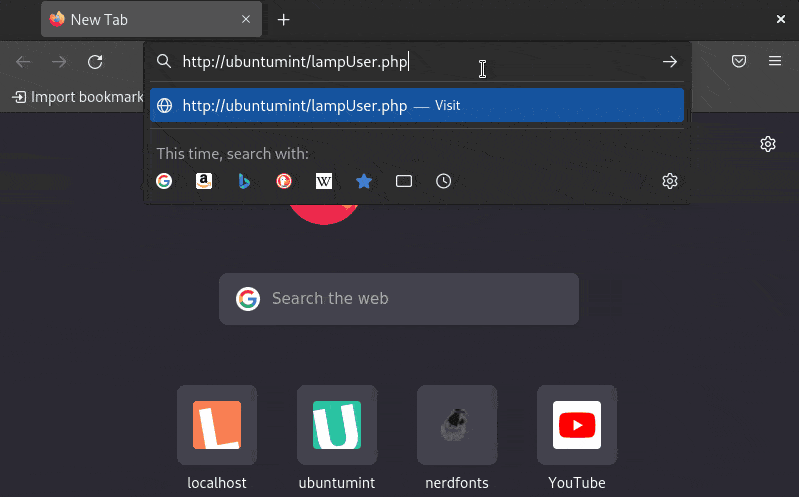
Save this file and open your web browser to test this PHP website, which can store data in the database table named “UMusers”:
http://your_domain/lampUser.php
Check the Website on the LAMP Stack
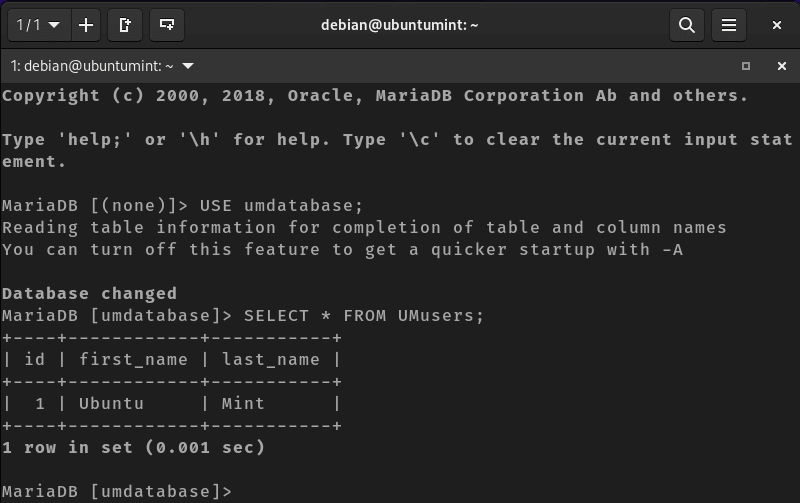
Let’s save some data using this website to verify if it will be stored in your MariaDB server or not:
$ sudo mariadb -u neem -p USE umdatabase;
SELECT * FROM UMusers;
Check Data on the Database
Conclusion
LAMP is a robust combination of four open-source tools that are essential for creating and hosting websites and applications. This article has presented a comprehensive guide for installing LAMP on Debian 12.
In today’s digital world, staying ahead in your career often means acquiring new skills. With the rapid evolution of technology, it’s crucial to keep up with the latest trends and tools to remain competitive.
Google, one of the tech giants, recognizes the importance of skill development and offers a range of free courses to help you stay relevant in 2023 and beyond.
Skill development enables individuals to adapt to changing environments and excel in their careers. In this highly competitive job market, employers are constantly seeking individuals with up-to-date skills. Whether you’re a recent graduate, a working professional, or someone looking to switch careers, improving your skill set is essential.
Google, a company renowned for innovation, has extended its support to skill development by enabling individual free courses in various domains such as digital marketing, IT support, cybersecurity, data analytics, project management, and UX design etc that are suitable for beginners as well as experienced professionals.
These free courses provide an ideal learning platform with practical knowledge and hands-on experience to upskill or supplant their knowledge in their line of profession. They are also a great choice for professionals looking for upward mobility in their careers or those transitioning into a different line of work.
Contents:
Key Benefits of Free Google Courses
10 Best FREE Google Courses
1. Application Development-Python
2. Applied Data Science with Python
3. Build Apps & Websites with Firebase
4. Google Ads Search Certification
5. YouTube Music Certification
6. Fundamentals of Digital Marketing
7. Build Apps with Flutter
8. Google Ads Display Certification
9. Introduction to ML: Language Processing
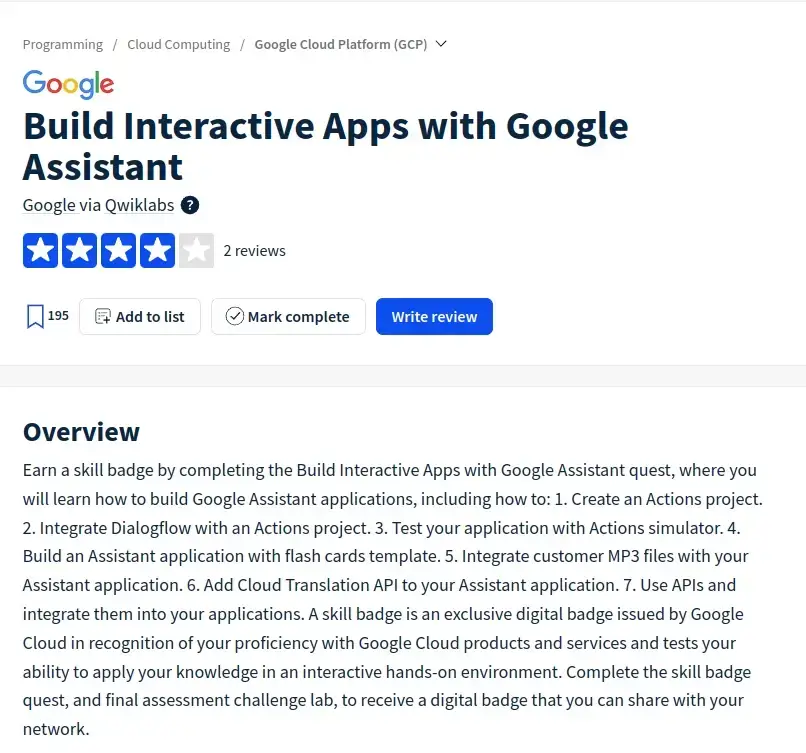
10. Build Interactive Apps with Google Assistant
How to Enroll in Free Google Courses
How to Obtain a Free Certificate From Google
Tips And Tricks To Crack The Interview Round
Best Free Google Courses to Become Skilled FAQs
1. Are Google certifications worth it?
2. How long does it take to complete a Google course?
3. What is the Process of Applying For A Job At Google?
4. What are the prerequisites for Google courses?
5. Are Google courses recognized by employers?
Conclusion
Key Benefits of Free Google Courses
Cost-Effective: These courses are entirely free, eliminating financial barriers to education.
Self-Paced Learning: Google’s courses allow you to learn at your own pace, accommodating to your busy schedules.
Certifications: Upon successful completion, you receive a certificate from Google, a well-recognized credential that will help you get employment in industries with high rates of growth.
Hands-on Experience: Many courses include practical assignments and real-world projects.
10 Best FREE Google Courses
This tutorial features some of the top free Google courses you can enroll in to boost your skills.
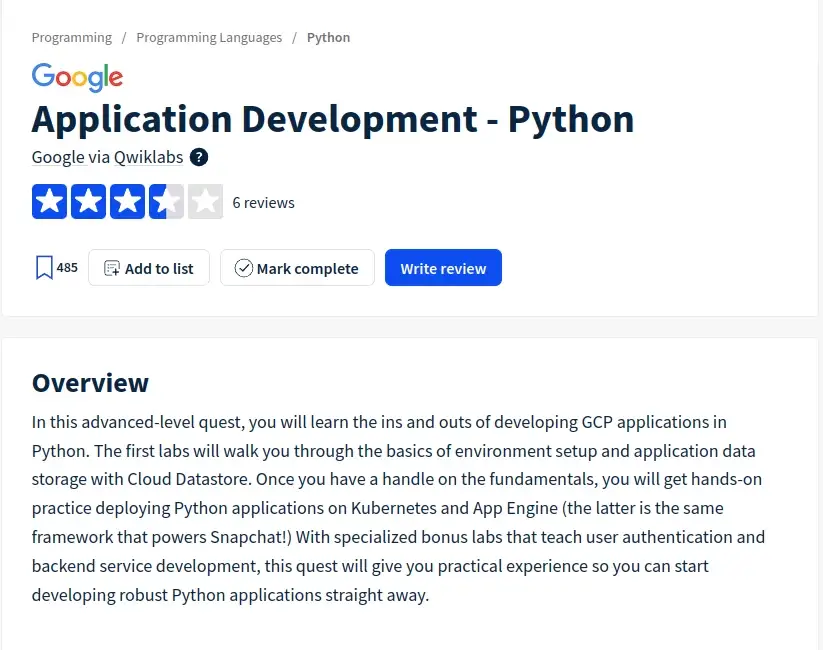
1. Application Development-Python
In this advanced course, you will learn how to Develop Python applications for Google Cloud Platform (GCP). In addition to receiving practical experience in deploying Python apps on Kubernetes and App Engine, you will study the fundamentals of setting up environments and storing application data with Cloud Datastore.
Moreover, the course incorporates special bonus labs that cover backend service development and user authentication. This course can be accessed through Google on Class Central.
Application Development – Python
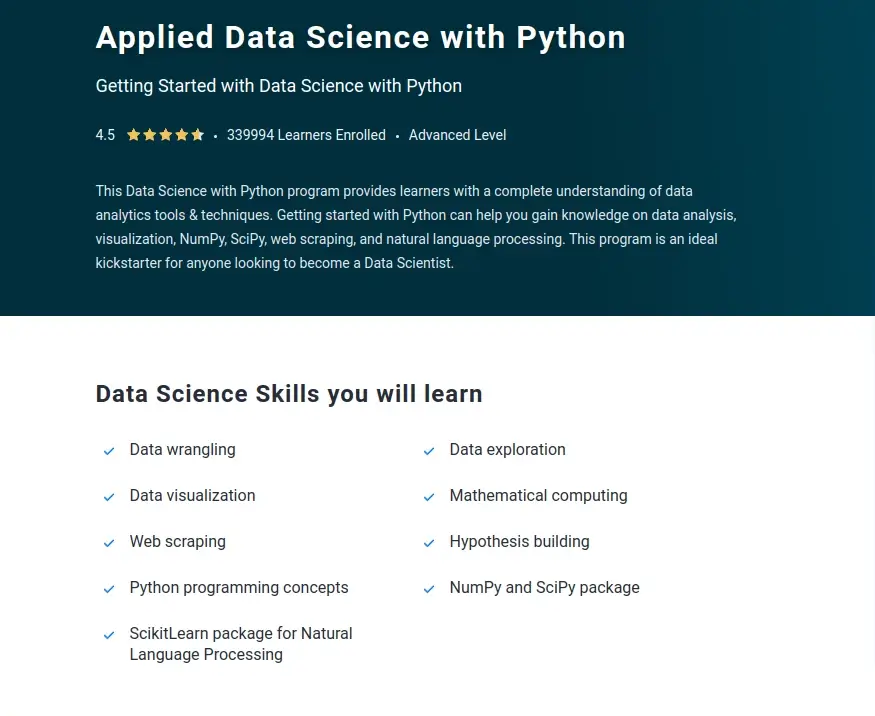
2. Applied Data Science with Python
This course includes a Data Science with Python curriculum that equips learners with data science skills, including knowledge of popular data science libraries in Python such as Numpy, SciPy, Plotly, and Pandas.
Anyone who wants to launch a career as a data scientist. this course material is a vaulable resource for Kickstarter with.
Learners who have a basic understanding of Python programming and want to get their hands dirty by using Python toolkits to apply social network analysis techniques, machine learning, information visualization, and text analysis to their data will find this course beneficial.
Applied Data Science with Python
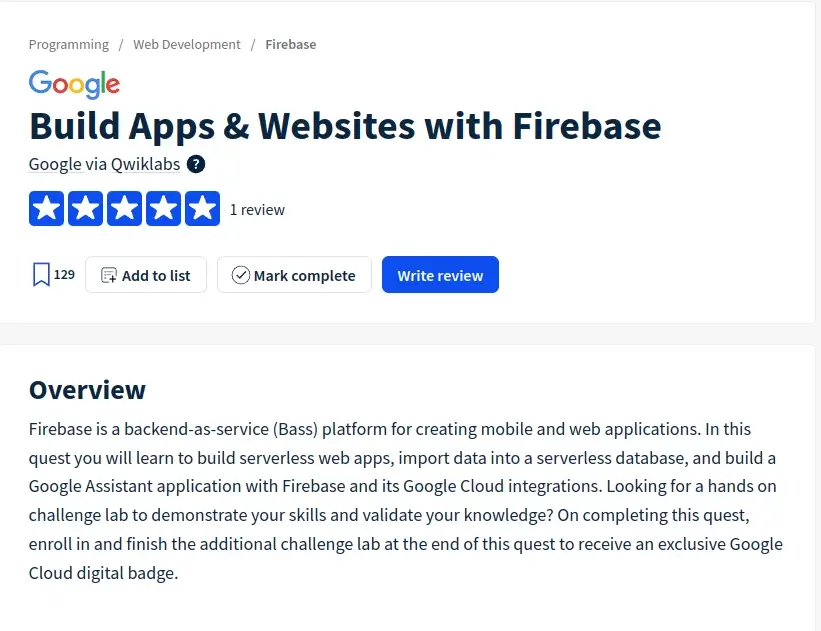
3. Build Apps & Websites with Firebase
The fundamentals of the Firebase application development platform are covered in this Google course. You will discover how to use Firebase and its Google Cloud connectors to create Google Assistant applications, construct serverless web apps, and load data into serverless databases.
To verify your knowledge and showcase your abilities, the course also contains a challenge lab. You will obtain a special digital badge from Google Cloud upon fulfilling this task.
Build your First Web App with Firebase
4. Google Ads Search Certification
Google Ads (previously Google Adwords) is the most widely used PPC system and a significant source of revenue for Google. To help marketers make the most of Google Ads’ features, they created several certification courses that are all freely accessible through Google Skillshop.
The Google Ads Search Certification is one of the Google Ads courses that will equip you with solid skills to manage Google search marketing campaigns.
Google Ads Search Certification
5. YouTube Music Certification
The YouTube Music Certification course is tailored for music content owners and examines the tactics and tools needed for teams to deliver content and manage musical assets at scale efficiently. The training addresses key elements such as rights management, commercialization, and promotion.
The certification is free, and you can add it to your LinkedIn profile upon completion.
YouTube Music Certification
6. Fundamentals of Digital Marketing
Google offers a free course on the Fundamentals of Digital Marketing, which Interactive Advertising Bureau Europe and the Open University have accredited.
By enrolling in this course, you’ll acquire the skills needed to manage multiple digital marketing channels, such as:
Online Marketing Strategy
Email Marketing
Content Marketing
Display Advertising
Mobile Marketing
eCommerce Marketing
This certification course is meant for beginners and requires a total of 40 hours of time commitment. To become certified, you must complete all 26 modules and ace the 40-question Google Garage exam.
Fundamentals of Digital Marketing
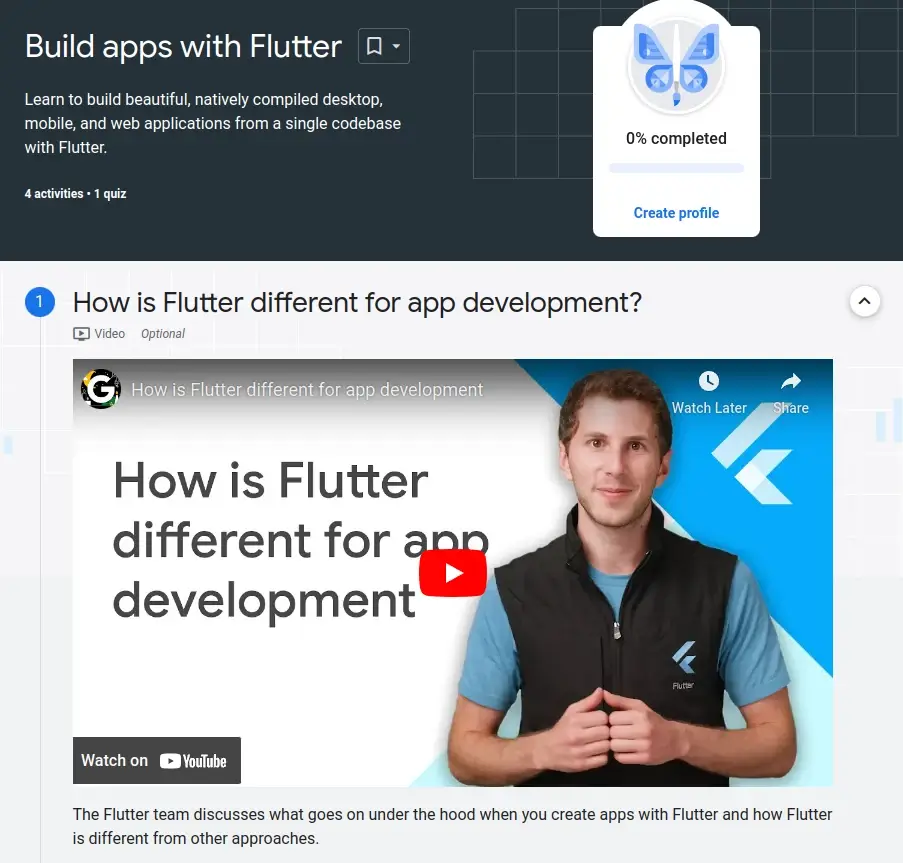
7. Build Apps with Flutter
Developed by Google, Flutter is a popular open-source framework for creating beautiful, responsive cross-platform web and mobile applications from a shared codebase.
Google is offering a free course called Build Apps with Flutter which comprises two codelabs, one quiz, and four activities. You will learn how to create your first Flutter app, how stateful widgets work best, and how Flutter differs from other app development frameworks.
Build Apps with Flutter
8. Google Ads Display Certification
The Google Ads Display Certification is provided by Google and is aimed at helping digital marketers prove their capacity to create successful Display strategies and campaigns that accomplish particular marketing objectives.
Upon earning this certification, you will have the skills to:
Develop a comprehensive strategy to enhance awareness, consideration, action, and retention.
Effectively target audiences, reaching both existing and prospective customers.
Make sure that the display marketing plan aligns properly with the digital marketing budget.
Initiate/start permission marketing campaigns.
Google Ads Display Certification
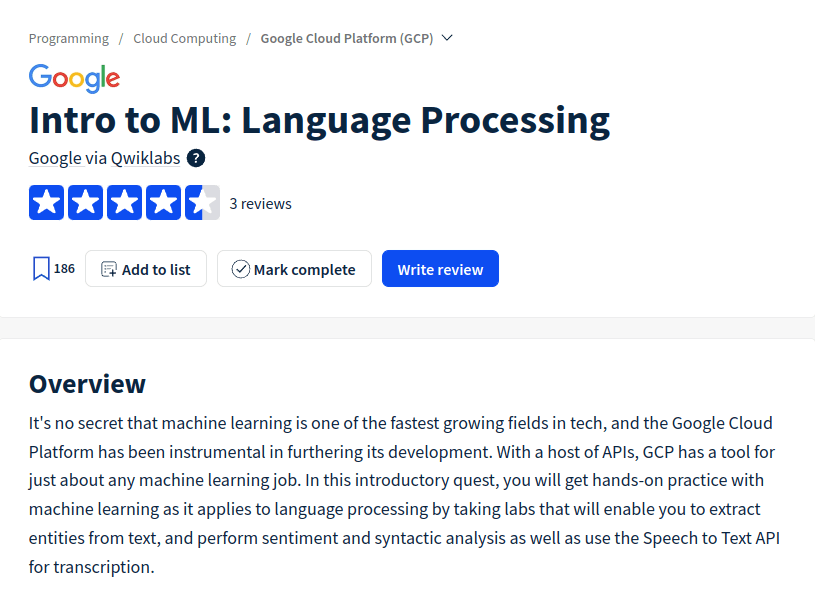
9. Introduction to ML: Language Processing
With Intro to ML: Language Processing, course you will learn about machine learning in the context of language processing and get practical experience with the technology. You’ll discover how to use the Speech-to-Text API for transcription, perform sentiment and syntactic analysis, and extract entities from text.
Through a series of labs, the course will teach you how to use AI Platform, Google Cloud Speech API, and Cloud Natural Language API to fully utilize machine learning. Upon completion, you will receive a special digital badge from Google Cloud.
The course teaches learners how to create Actions projects, integrate Dialogflow into Actions projects, test their applications using Actions Simulator, build Assistant apps using flash card templates, integrate customer MP3 files into Assistant apps, add Cloud Translation API to Assistant apps, and use APIs and integrate.
Build Interactive Apps with Google Assistant
How to Enroll in Free Google Courses
The Free Google Courses are available online without any cost. Getting started with Google’s free courses is very simple, Go to Google’s free online Courses, create an account, choose your course, and begin learning.
How to Obtain a Free Certificate From Google
Obtaining a free certificate from Google is a valuable accomplishment that can enhance your skills and boost your career prospects. Here’s a step-by-step guide on how to get a free certificate from Google.
Choose and Enroll in the Course: Select the course that aligns with your interests and career goals. and Enroll it. This involves creating an account on the Google learning platform.
Complete the Course: Google’s courses are designed to allow users to study at their own pace that suits their schedule.
Pass Project and Quiz: Complete the assessments and quizzes with a passing score.
Finish Practical Assignments: Some Google courses require you to complete practical projects.
Receive Certificate: After completing the course, you will be awarded a certificate from Google. You can view and print the certification on your profile page, and add it to your resume, and LinkedIn to maximize the value of the Google certificate.
Tips And Tricks To Crack The Interview Round
You can use Google Careers tips and techniques to prepare for a Google job interview. The tips include:
Do your homework before applying for the position and the company.
Use a whiteboard or paper to practice coding.
Expect behavioral inquiries; be ready.
Ask questions when necessary
Best Free Google Courses to Become Skilled FAQs
This FAQ section answers commonly asked questions about the Best Free Google Courses to Become Skilled.
1. Are Google certifications worth it?
Yes, Google certificates are worth pursuing because according to Google, 75% of certificate holders report achieving a good career outcome such as a new job, promotion, or raise, all within six months of completing the certificate.
For those with 0–5 years of professional experience, the median pay in various fields stands at $76,000 or higher.
Also, thanks to the value that employers and academic institutions place on Google certifications, you can find work in a variety of industries, including IT and digital marketing. The majority of certificates are free, and those that cost money are fairly priced.
2. How long does it take to complete a Google course?
The duration varies depending on the course, but they are self-paced, allowing you to learn at your speed.
3. What is the Process of Applying For A Job At Google?
Now, once you’ve gained the relevant skills needed and want to get employment at Google, you must register for a Google Careers account and submit your application online to apply for a job at Google. Your resume and cover letter must both be included in the application.
If your application is chosen for further consideration, you will receive an invitation to take part in an interview process that may involve several rounds of interviews with various teams.
4. What are the prerequisites for Google courses?
Most courses have no specific prerequisites, making them accessible to learners of all levels.
5. Are Google courses recognized by employers?
Yes, Google’s certifications are highly regarded by employers and can enhance your job prospects.
Conclusion
The free courses scheduled for 2023 are a priceless resource for students looking to advance or hone their knowledge in a variety of subject areas. Participants who acquire certification are acknowledged for their efforts and successes, in addition to learning new information.
Join Google Free Courses right away to begin your journey toward development and lifelong learning.
Ubuntu 22.04, codenamed Jammy Jellyfish, was released by Canonical on April 21 2022. It is the latest long-term support (LTS) release after its predecessor, Ubuntu 20.04 LTS.
Ubuntu 22.04 provides major enhancements, new capabilities, and a number of new software packages such as:
PHP 8.1.2
OpenSSL 3.0
Ruby 3.0
Python 3.10.4
MySQL 8.0.28
PostgreSQL 14.2
Linux kernel v5.15.0-25 & MESA 22
For a comprehensive list of all the new features and software packages, check out the release notes.
In this tutorial, we will walk you through the process of how to upgrade Ubuntu 20.04 to Ubuntu 22.04.
Prerequisites
Before you begin the upgrade, ensure you meet the following requirements:
At least 20 GB of free disk space. You can check the available disk space using the df -Th command.
Ensure you have a regular user configured with sudo privileges with access to SSH or the terminal app. This is the user you will use to perform the upgrade process.
In addition, ensure you have a fast and stable internet connection. Do not cancel the operation once it’s begun.
Ensure your UPS or battery are fully charged and working.
Close all open applications.
Step 1: Backup all your data
It is prudent to take a backup of all your databases and files before embarking on any major upgrade of an operating system. This ensures you will not lose your data in case something goes wrong during the upgrade process.
Cloud server providers offer snapshot services. Therefore, if you are running a virtual machine or cloud VPS, ensure you take a complete snapshot so that you can restore your instance in case it breaks.
Step 2: Upgrade all the system packages
Once the backup is in place, log in to your instance and upgrade all the packages to their latest versions. This upgrades the entire system to the latest Ubuntu release.
To list upgradable packages, run the command (note: if you haven’t done this in a while, you may want to run the sudo apt update command first to get the most current details possible):
$ sudo apt list –upgradable
Next, refresh the local package index and upgrade the packages in one single command as follows:
$ sudo apt update && sudo apt upgrade -y
This might take a while depending on the number of installed packages with pending upgrades. Once the upgrade is complete, reboot your system to take advantage of the latest kernel that will come with the upgrade.
$ sudo reboot
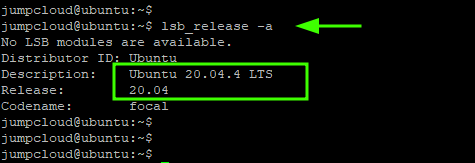
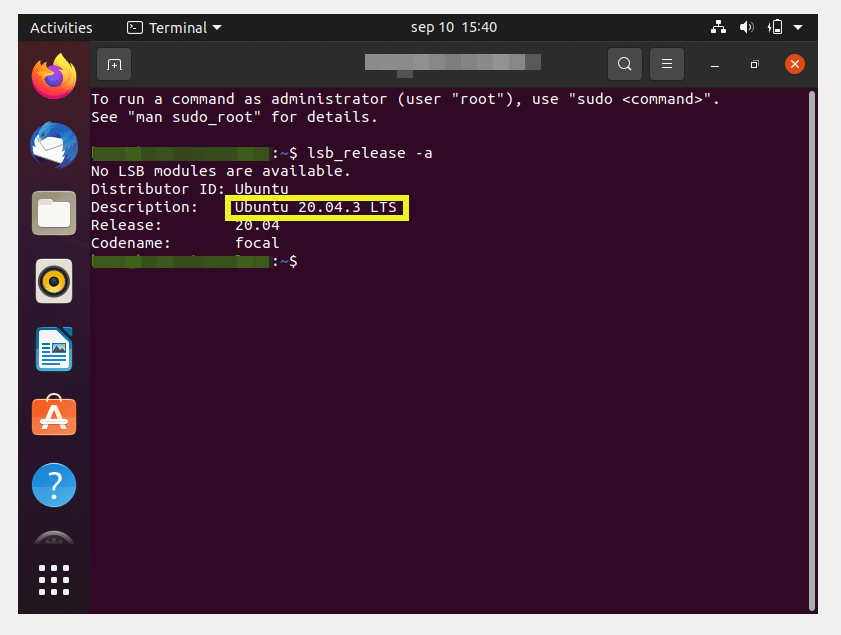
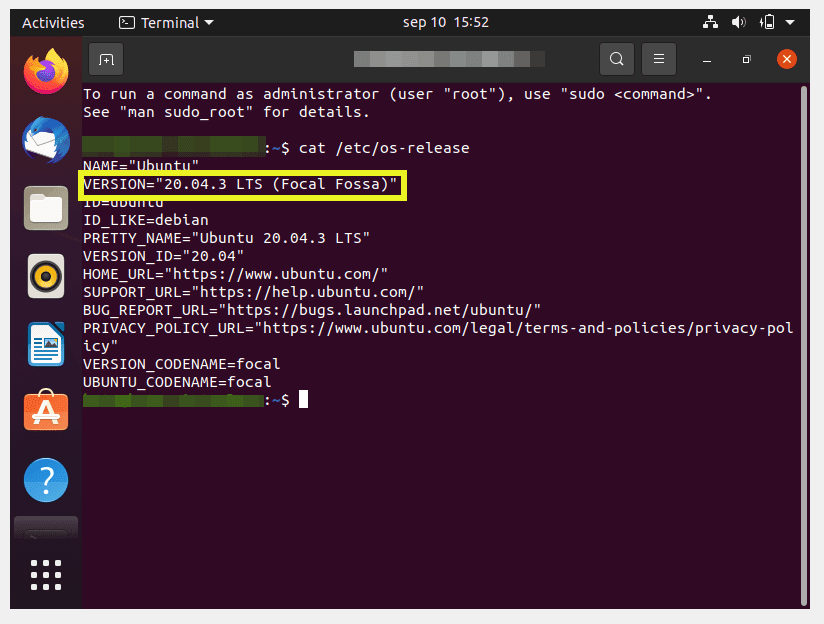
Then log back into the system and confirm it has been upgraded to the latest release, which, at the time of publishing this guide, is Ubuntu 20.04.4 LTS.
$ lsb_release -a
Step 3: Open TCP port 1022
If you are connected to your Ubuntu instance via SSH, the upgrade tool will open another SSH port (1022) as a fallback port in case the SSH connection drops on port 22.
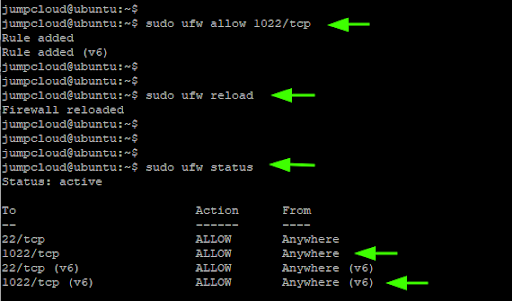
To simplify things, we recommend that you open port 1022 on your firewall as follows. We also recommend speaking with your networking team beforehand to ensure you are minimizing potential security risks. Be sure to follow Step 6 below to close the port when you are done.
$ sudo ufw allow 1022/tcp
To apply the firewall rule, reload the firewall.
$ sudo ufw reload
Then verify that the port has been opened by probing the firewall status as shown.
$ sudo ufw status
Step 4: Upgrade to Ubuntu 22.04 Jammy Jellyfish
At this point, upgrading to Ubuntu 22.04 will be a straightforward and seamless process. There are two ways to upgrade to the latest Ubuntu version: You can use the do-release-upgrade tool, which works for both CLI and GUI instances, or the GUI update tool.
In this guide, we will use the do-release-upgrade tool. If it is not installed, you can install it by running the command:
$ sudo apt install update-manager-core
To commence the upgrade, run the command:
$ sudo do-release-upgrade
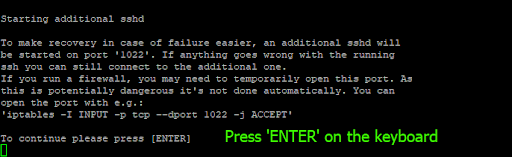
During the upgrade, the upgrade tool will probe for the latest LTS release and walk you through a series of prompts.
First and foremost, it will detect your SSH connection and notify you that an additional SSH service will be started on port 1022. Simply type “Y” to proceed.
Next, the upgrade tool will notify you to open port 1022, which will be used as an alternative SSH port in case of an SSH connection interruption on the default port. Since you already opened the port, just hit ENTER.
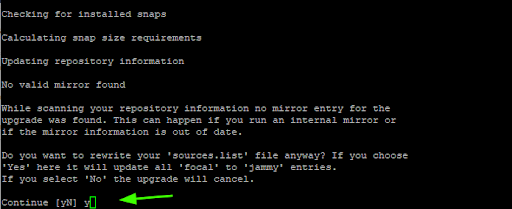
Next, you will be prompted to update the “sources.list” file from ‘focal’ to ‘jammy’ entries. To proceed with the upgrade, press “Y” and press ENTER.
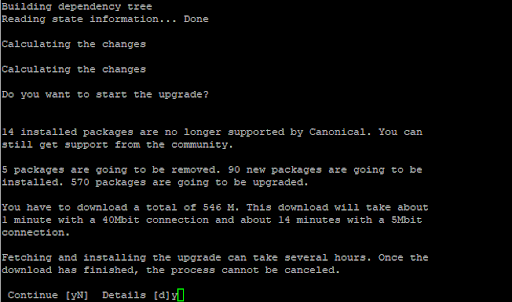
The update tool will calculate all the changes and provide a summary of the following:
Installed packages that are no longer supported by Canonical.
The number of packages to be removed.
The number of new packages that will be installed.
The number of packages that will be upgraded.
Total download size and how long the download will take.
To continue, once again, press “Y” and press ENTER.
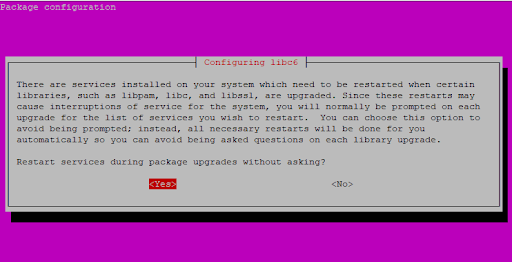
Some services will need to be restarted once some libraries and packages are upgraded. On this pop-up, select ‘Yes‘ to restart these services during package upgrades without being prompted.
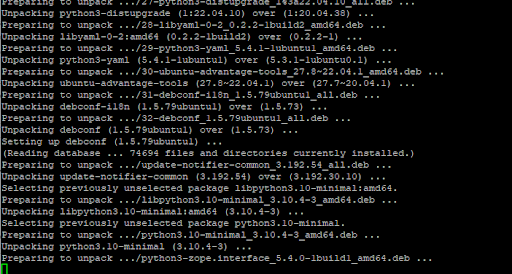
From here, the upgrade tool will proceed to download all the requisite packages from the official Ubuntu repositories and upgrade them.
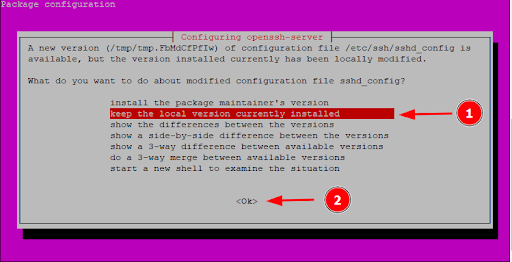
When prompted on what to do with the modified “sshd_config” configuration file, you can choose to install the package maintainer’s version or keep the local version installed. Then, select ‘Ok’.
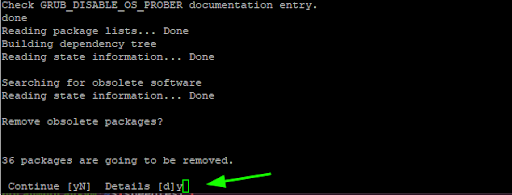
Next, press “Y” and hit ENTER to remove obsolete packages.
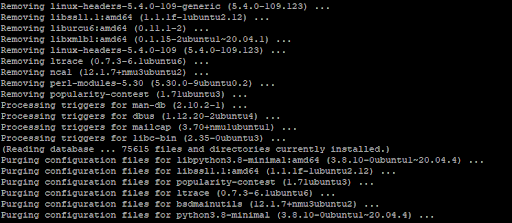
Thereafter, all the old packages alongside their configuration files will be removed.
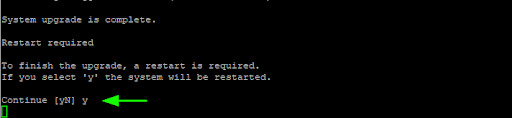
The entire process takes quite some time, so patience will be required. This is a good time to take a break and grab some coffee.
Once the upgrade is complete, you will be prompted to restart the system to finish the upgrade. Press “Y” and hit ENTER to reboot. This will cause you to lose connection to the server.
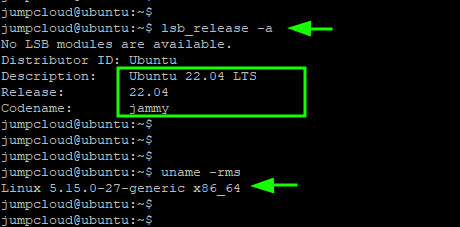
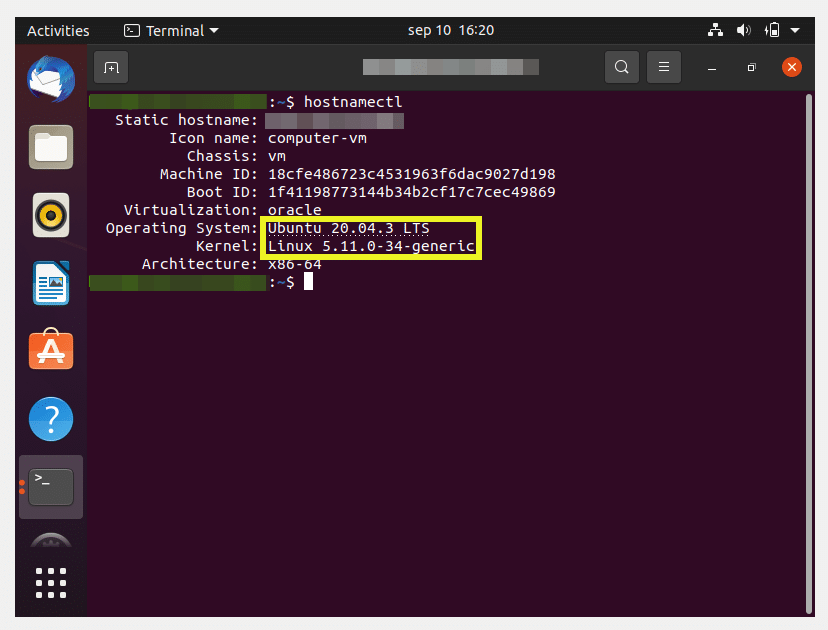
Step 5: Verify the upgrade to Ubuntu 22.04
After rebooting, log back in and confirm the upgrade was successful.
The command:
$ lsb_release -a
checks the version of Linux, while the command
$ uname -mrs
checks the kernel version.
From the output below, you can see that we are now currently running Ubuntu 22.04 LTS. Also, note that we are using kernel 5.15 which is the kernel version that comes with Ubuntu 22.04 by default.
Step 6: Delete the firewall rule you created
Now that you are finished with the update and no longer need port 1022 open, run the following command to close the port and prevent it from becoming a security vulnerability.
$ sudoufw delete allow 1022/tcp
Step 7: Enable third-party repositories
During the upgrade, all third-party repositories are disabled. You might want to re-enable them now that the upgrade is complete. You can find these repositories in the/etc/apt/sources.list.d directory.
To display these repositories, run the command:
$ ls -l etc/apt/sources.list.d/
To enable them, simply open each file and uncomment the entries by deleting the # sign at the beginning of each line.
Finally, free up the disk space by removing all the unnecessary packages as follows:
$ sudo apt autoremove –purge
Conclusion
As you have seen, upgrading Ubuntu 20.04 to Ubuntu 22.04 is a simple process that requires just a few commands.
If you are an IT admin overseeing the updates of multiple Ubuntu systems, in addition to macOS and Windows device updates, your workflow can become quite complicated very quickly.
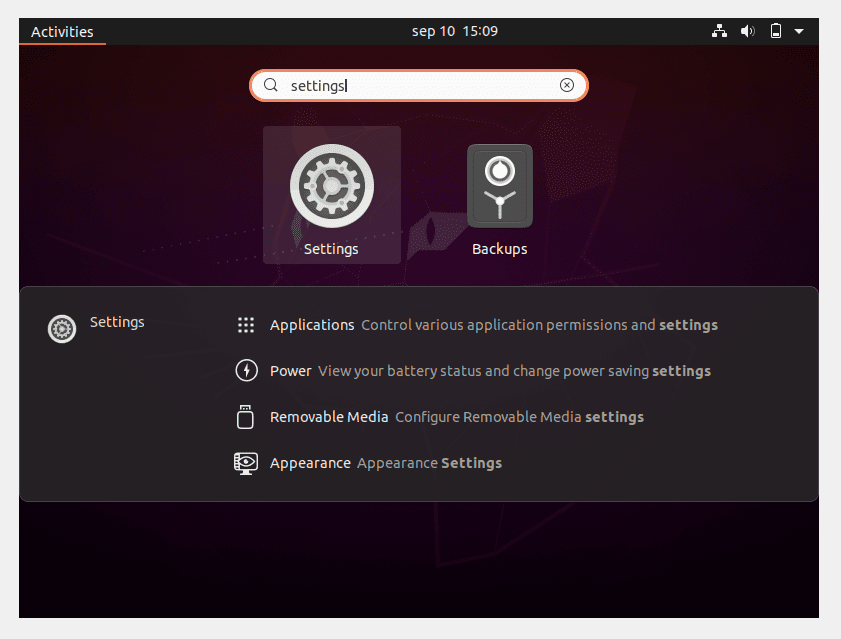
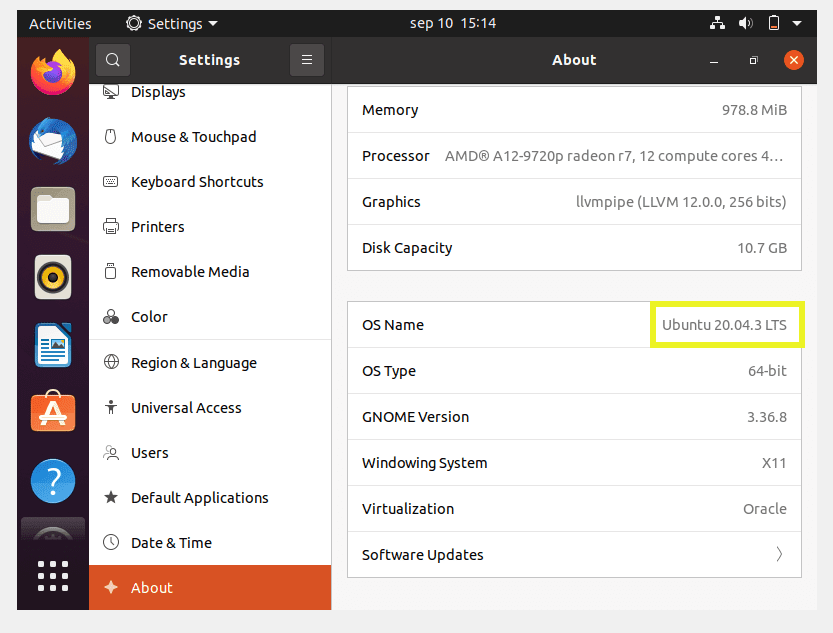
Ubuntu is an open source Operating System (OS) used by people all over the world. Although it is user-friendly and customizable, it may not always be compatible with additional software. As such, you’ll need to check if your version of Ubuntu will integrate with other programs.
Fortunately, it’s relatively easy to check your Ubuntu version. You can do so using commands in the terminal or by accessing the settings in the Graphical User Interface (GUI).
In this guide, we’ll discuss what Ubuntu is and why you might want to check which version of it you are running. Then, we’ll explain how to perform this check using various easy methods. Let’s get started!
An Overview of Ubuntu (and Why You Might Need to Check Your Version of It)
Ubuntu is a Linux-based OS popular across the world. You can use the desktop, server, or core versions, depending on your needs.
Ubuntu
The platform is entirely free. It also has some advantages over other OS such as Windows or macOS.
For example, it uses open source software and provides a secure development environment. As such, Ubuntu can be a helpful tool for web developers.
You can also customize most aspects of your User Interface (UI) and User Experience (UX). Therefore, Ubuntu could be an excellent choice if you feel limited by other OS options.
There are updated releases of Ubuntu approximately every six months. New versions of the software usually include maintenance and hardware updates that help the OS run more smoothly. As such, it’s in your best interest to stay up to date with the latest release.
However, you may not know if you’re running the latest version of Ubuntu. Therefore, you might like to check your OS and see if you need to update it.
Furthermore, you may need to check your Ubuntu version when installing third-party software. Not all other platforms may be compatible with the OS updates, so it’s worth investigating this before you install them.
Finally, you may run into some issues when using Ubuntu. If this happens, you can turn to technical support forums such as the official Ubuntu Forums.
Ubuntu forums
You can improve your forum experience by providing your version of Ubuntu. With this information, other members can assist you more precisely.
Wondering if your version of Ubuntu will integrate with other programs? 🤔 It’s easy to check… and this guide is here to help! 💪
How To Check Your Ubuntu Version in the Command Line (4 Methods)
You can check your Ubuntu version quickly using the command line (also known as the terminal). You can access this tool by using the keyboard shortcut Ctrl + Alt + T.
Once you have the command line open, you can use a few different methods to find out your Ubuntu version. Let’s explore some of them.
Use the lsb_release -a Command
Use the /etc/lsb-release or /etc/os-release Command
Check the /etc/issue File
Use the hostnamectl Command
1. Use the lsb_release -a Command
The lsb_release command shows you details about your Linux distribution. For example, it displays data concerning LSB modules. It also shows the ID and release number of the distributor.
When you add “-a” to the end of this command, it returns all possible information. This method is pretty straightforward, so you might want to utilize it if you need to find out your Ubuntu version quickly.
To start, open up your terminal and type in this command:
lsb_release -a
Then hit your Enter key to return the results. They should look something like this.
You can see your Ubuntu version next to the Description heading. You can also see data about your LSB modules and the codename for your distributor.
2. Use the /etc/lsb-release or /etc/os-release Command
The /etc/lsb-release command can show you your Ubuntu version with separate lines for the release number and its description. It is designed for older systems, so you may like to use it if you’re running an outdated version of Ubuntu.
You can also obtain the same information using the /etc/os-release command. This is compatible with Ubuntu 16.04 and higher.
As before, open your terminal and enter one of the above commands. You’ll need to add “cat” before either of them:
cat etc/os-release
Then, you’ll see a list of information that includes the number of your Ubuntu version and its release name. Additionally, there are a few links to the Ubuntu website and resources that can help you.
Ubuntu version and release name
Using the /etc/lsb-release command will return simpler results that show you the release ID, description, and codename. It doesn’t include the links and the Ubuntu version name.
3. Check the /etc/issue File
The /etc/issue file is a text-based document. It contains system identification data.
Using this method is simpler because the command won’t display anything other than your Ubuntu version. As such, you may like to utilize this file if you’re in a hurry and don’t need to gather any additional information about your system.
As with the previous commands, you’ll need to enter “cat” before the command. Type this into your terminal:
cat /etc/issue
Hit Enter, and you’ll see a single line of text.
Your version of Ubuntu is the series of numbers before LTS. You don’t need to do anything else here.
4. Use the hostnamectl Command
Finally, you can use the hostnamectl command. This is typically used when you want to change the hostname of your system. However, it also returns information such as your Ubuntu version and machine ID.
Open up your terminal and type in this command:
hostnamectl
Next, press your Enter key and you’ll see a list of information.
Here you can see both your Ubuntu version and your Ubuntu Linux kernel version. That’s it! Those are the main methods you can use to find the version of your Ubuntu OS.
How To Check Your Ubuntu Version in the GUI Settings?
If you’d rather not use the command line, you can also find your Ubuntu version in your GUI settings. You might prefer to use this method if you’re still getting used to working with the OS and its layout. However, it is a bit more time-consuming.
First, head to Show Applications. It’s the icon in the bottom left of your screen:
Next, click on Settings. If you can’t find it, type “settings” into the search bar at the top of the screen.
Then select the About tab from the left menu. You’ll need to scroll to the bottom of the list of items to find it. Here, you will be able to see your Ubuntu version next to the OS Name heading.
Find and select the “About” tab
For example, we’re currently running Ubuntu 20.04.3 on our system. It’s that easy!
Summary
Ubuntu is an open source OS that provides an excellent web development environment. However, it isn’t perfect and may not integrate with all the latest software. Therefore, you might need to check your version of Ubuntu before installing new programs.
To recap, you can check your Ubuntu version using any of the following methods:
Use the lsb_release -a command.
Use the /etc/lsb-release or /etc/os-release command.