Lighttpd is an open source, secure, fast, flexible and more optimized web server designed for speed-critical environments with less memory utilization as compared to other web servers.
It can handle up-to 10,000 connections parallel in one server with effective cpu-load management and comes with advanced feature set such as FastCGI, SCGI, Auth, Output-Compression, URL-Rewriting and many more.
Lighttpd is the excellent solution for every Linux server, due to its high speed io-infrastructure that allows us to scale several times better performance with the same hardware than with other alternative web-servers.
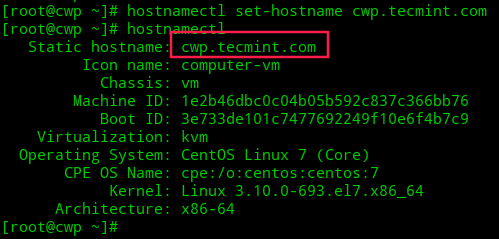
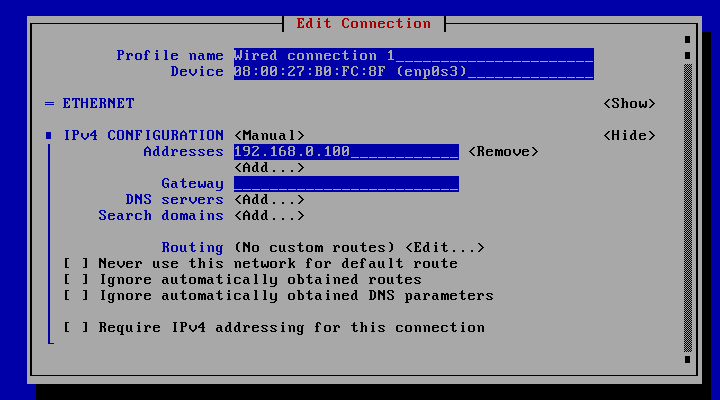
In this tutorial, we will explain how to install Lighttpd with PHP-FPM and MariaDB on CentOS/RHEL 7distributions with hostname tecmint.example.com and IP address 192.168.0.103.
Step 1: Install Lighttpd on CentOS 7
1. To install Lighttpd, first you need to update your system software packages and available repositories using following command.
# yum -y update
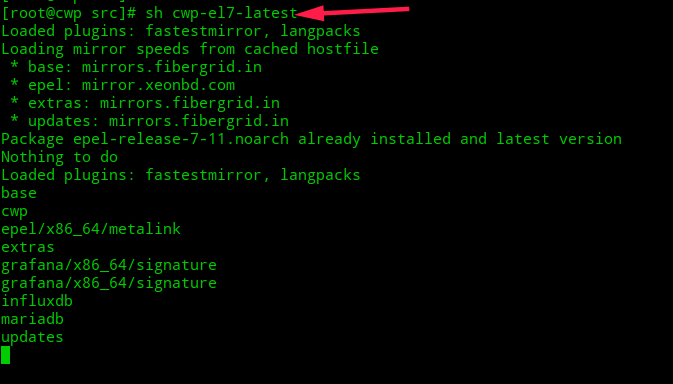
2. Next, you need to enable EPEL repository on your system and update software packages using following commands.
# yum -y install epel-release
# yum -y update
3. Once you’ve enabled EPEL repository, you can now install Lighttpd by running the following command.
# yum install lighttpd
4. Once the Lighttpd packages are installed, you can start and enable the service to automatically start at boot time and make sure to verify the status using the following commands.
# systemctl start lighttpd
# systemctl enable lighttpd
# systemctl status lighttpd
If you see any error message similar to below in the status, you need to fix few things to get it start properly without displaying any error messages.
Dec 10 02:14:26 tecmint.com lighttpd[1463]: 2018-12-10 02:14:26: (network.c.167) warning: please use server.use-ipv6 only for hostnames, not without server.bind / empty address...ONLY changes
Dec 10 02:14:26 tecmint.com lighttpd[1463]: 2018-12-10 02:14:26: (server.c.1352) can't have more connections than fds/2:  1024 1024
Hint: Some lines were ellipsized, use -l to show in full.
Open the file called /etc/lighttpd/lighttpd.conf with any editor.
# vi /etc/lighttpd/lighttpd.conf
Change the line that says server.use-ipv6 from enable to disable. It will fix error messages shown above.
##
## Use IPv6?
##
server.use-ipv6 = "disable"
Now try again to start Lighttpd, it should work 100% without any error messages.
# systemctl restart lighttpd
# systemctl status lighttpd
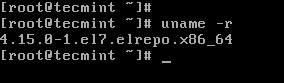
5. Now verify the version of Lighttpd installed on your system using the following command.
# lighttpd -v

lighttpd/1.4.51 (ssl) - a light and fast webserver
6. Now you need to allow HTTP and HTTPS traffic on your firewall.
# firewall-cmd --permanent --zone=public --add-service=http
# firewall-cmd --permanent --zone=public --add-service=https
# firewall-cmd --reload
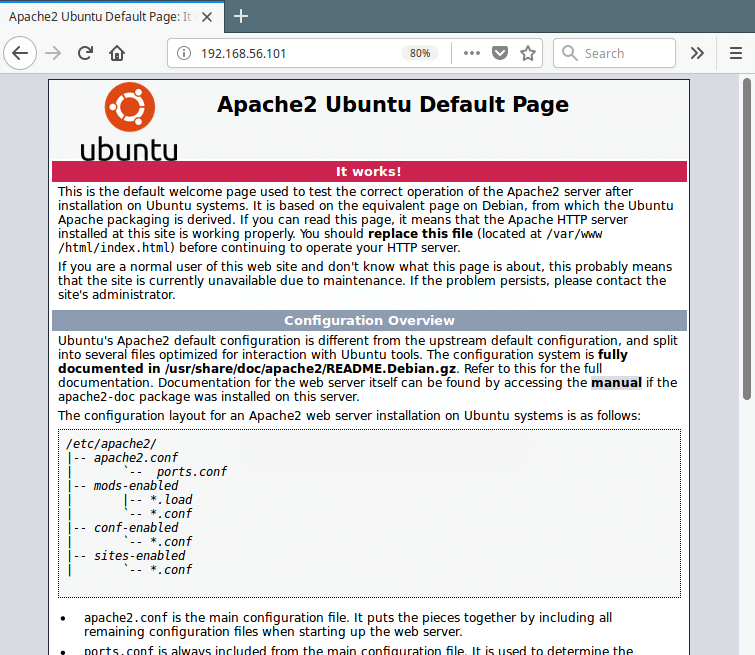
7. Now open your browser and point to the following URL to see your Lighttpd web server working.
http://Your-Domain.com
OR
http://Your-IP-addr
Check Lighttpd Page
The default document root directory for Lighttpd is /var/www/lighttpd/ and the main configuration file is located under /etc/lighttpd/lighttpd.conf.
Step 2: Installing MariaDB as MySQL in CentOS 7
8. Next, install MySQL support for Lighttpd using following commands.
# yum -y install mariadb mariadb-server
9. Once the installation is complete, start, enable and verify the status of MariaDB using following commands.
# systemctl start mariadb.service
# systemctl enable mariadb.service
# systemctl status mariadb.service
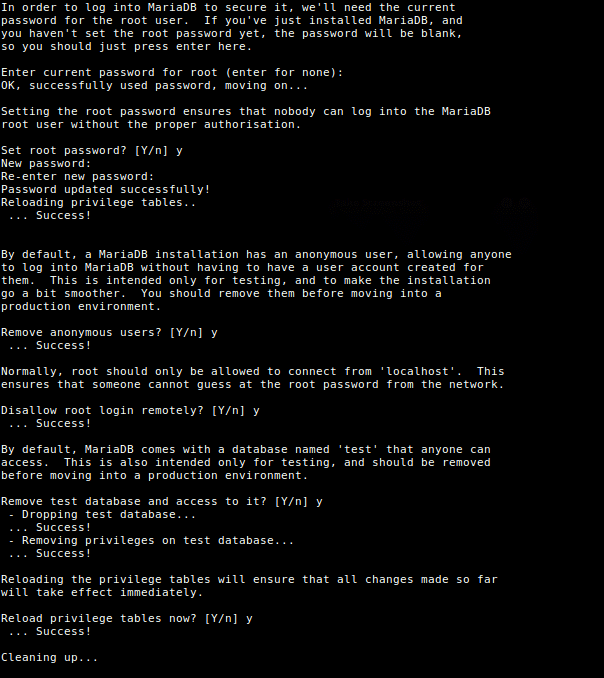
10. Finally, you will need to secure your MariaDB installation by issuing the following command.
# mysql_secure_installation
You will be prompted a few different questions regarding your MariaDB installation and how you would like to secure it. You can change the database root user password, disable the test database, disable anonymous users, and disable root login remotely.
Sample Output
NOTE: RUNNING ALL PARTS OF THIS SCRIPT IS RECOMMENDED FOR ALL MariaDB
      SERVERS IN PRODUCTION USE!  PLEASE READ EACH STEP CAREFULLY!

In order to log into MariaDB to secure it, we'll need the current
password for the root user.  If you've just installed MariaDB, and
you haven't set the root password yet, the password will be blank,
so you should just press enter here.

Enter current password for root (enter for none): Enter OK, successfully used password, moving on... Setting the root password ensures that nobody can log into the MariaDB root user without the proper authorisation. Set root password? [Y/n] y New password: Re-enter new password: Password updated successfully! Reloading privilege tables.. ... Success! By default, a MariaDB installation has an anonymous user, allowing anyone to log into MariaDB without having to have a user account created for them. This is intended only for testing, and to make the installation go a bit smoother. You should remove them before moving into a production environment. Remove anonymous users? [Y/n] y ... Success! Normally, root should only be allowed to connect from 'localhost'. This ensures that someone cannot guess at the root password from the network. Disallow root login remotely? [Y/n] y ... Success! By default, MariaDB comes with a database named 'test' that anyone can access. This is also intended only for testing, and should be removed before moving into a production environment. Remove test database and access to it? [Y/n] y - Dropping test database... ... Success! - Removing privileges on test database... ... Success! Reloading the privilege tables will ensure that all changes made so far will take effect immediately. Reload privilege tables now? [Y/n] y ... Success! Cleaning up... All done! If you've completed all of the above steps, your MariaDB installation should now be secure. Thanks for using MariaDB!
11. Try connecting to MySQL server and review the existing databases on your database server with following commands on the terminal.
# mysql -u root -p
Sample Output
Enter password:
Welcome to the MariaDB monitor.  Commands end with ; or \g.
Your MariaDB connection id is 10
Server version: 5.5.60-MariaDB MariaDB Server

Copyright (c) 2000, 2018, Oracle, MariaDB Corporation Ab and others.

Type 'help;' or '\h' for help. Type '\c' to clear the current input statement.

MariaDB [(none)]> show databases;
+--------------------+
| Database           |
+--------------------+
| information_schema |
| mysql              |
| performance_schema |
+--------------------+
3 rows in set (0.00 sec)

MariaDB [(none)]>
Step 3: Installing PHP and PHP-FPM with FastCGI on CentOS 7
12. To enable PHP-FPM with FastCGI support, first you need to install PHP along with necessary extensions using following command.
# yum -y install php php-mysqlnd php-pdo php-gd php-mbstring
13. Once PHP installed, now enable PHP-FPM and FastCGI support for Lighttpd, to do this you need to install these packages too.
# yum -y install php-fpm lighttpd-fastcgi
14. Now open a file called /etc/php-fpm.d/www.conf.
# vi /etc/php-fpm.d/www.conf
Set the user and group to lighttpd.
; Unix user/group of processes
; Note: The user is mandatory. If the group is not set, the default user's group
;       will be used.
; RPM: apache Choosed to be able to access some dir as httpd
user = lighttpd
; RPM: Keep a group allowed to write in log dir.
group = lighttpd
15. Now start PHP-FPM service and make sure to enable it to automatically start at boot time using the following commands.
# systemctl start php-fpm.service
# systemctl enable php-fpm.service
Step 4: Enabling PHP and PHP-FPM with FastCGI in Lighttpd
16. Here, we need to modify three files /etc/php.ini, /etc/lighttpd/modules.conf and /etc/lighttpd/conf.d/fastcgi.conf to enable PHP support for Lighttpd.
Open first file /etc/php.ini.
# vi /etc/php.ini
Un-comment the following line that says line cgi.fix_pathinfo=1.
; cgi.fix_pathinfo provides *real* PATH_INFO/PATH_TRANSLATED support for CGI.  PHP's
; previous behaviour was to set PATH_TRANSLATED to SCRIPT_FILENAME, and to not grok
; what PATH_INFO is.  For more information on PATH_INFO, see the cgi specs.  Setting
; this to 1 will cause PHP CGI to fix its paths to conform to the spec.  A setting
; of zero causes PHP to behave as before.  Default is 1.  You should fix your scripts
; to use SCRIPT_FILENAME rather than PATH_TRANSLATED.
; http://php.net/cgi.fix-pathinfo
cgi.fix_pathinfo=1
Then open second file called /etc/lighttpd/modules.conf.
# vi /etc/lighttpd/modules.conf
Un-comment the following line that says include “conf.d/fastcgi.conf”.
##
## FastCGI (mod_fastcgi)
##
include "conf.d/fastcgi.conf"
Next, open third file called /etc/lighttpd/conf.d/fastcgi.conf.
# vi /etc/lighttpd/conf.d/fastcgi.conf
Now add the following container at the bottom of the file and save it.
fastcgi.server += ( ".php" =>
        ((
                "host" => "127.0.0.1",
                "port" => "9000",
                "broken-scriptfilename" => "enable"
        ))
)
Restart the Lighttpd service to reflect changes and enable PHP support.
# systemctl restart lighttpd
Step 5: Testing PHP and PHP-FPM with FastCGI Support in Lighttpd
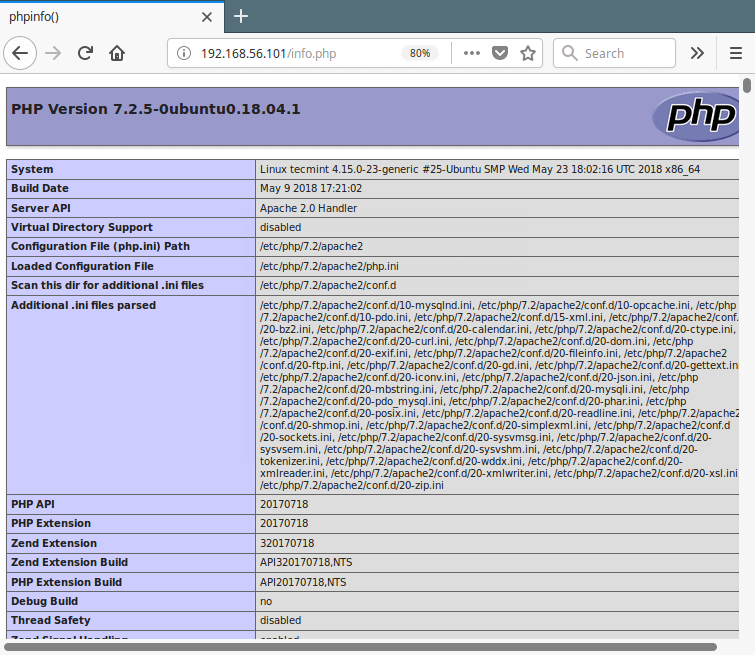
17. As We said above that the default document root for Lighttpd is /var/www/lighttpd/. So, here we will create a phpinfo.php file into this directory.
# vi /var/www/lighttpd/info.php
Add the following lines to it. This small piece of code will display information about PHP installation with their versions.
<?php
phpinfo();
?>
18. Open your browser and navigate to the following links.
http://Your-Domain.com
OR
http://Your-IP-addr
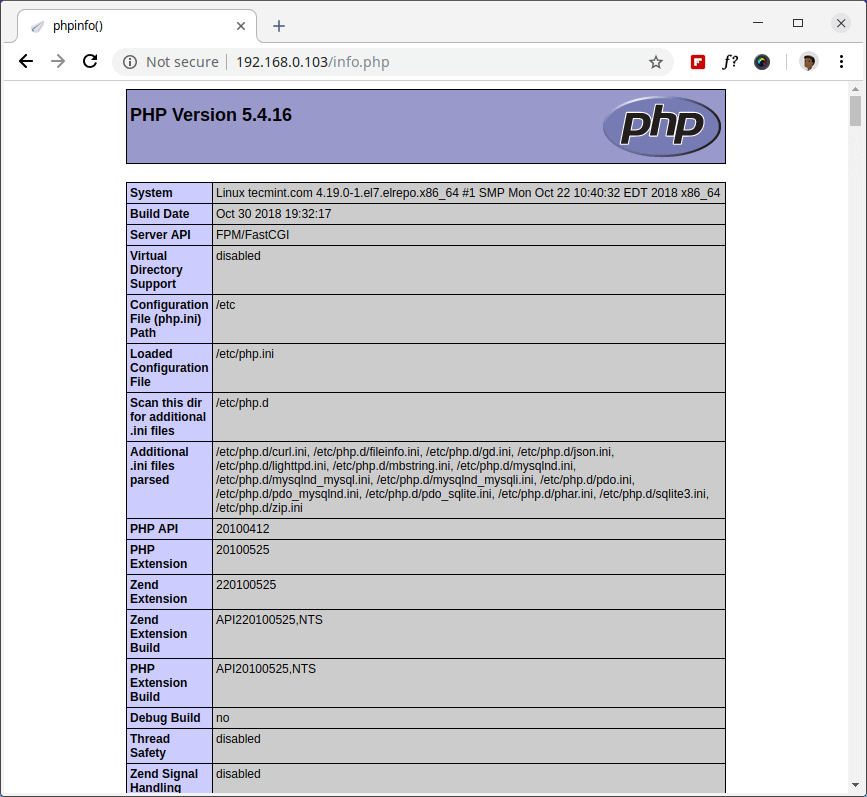
Check PHP Support in CentOS 7
You will see working information of PHP, PHP-FPM and MySQL with lots of other modules that are already enabled.
Source