Android (x86) is a project which aims to port Android system to Intel x86 processors to let users install it easily on any computer, the way they do this is by taking android source code, patching it to work on Intel x86 processors and some laptops and tablets.
Install Android 4.4 KitKat in Linux
A few days ago, the project released “Android KitKat 4.4 RC2”, and today we will explain how to install it on VirtualBox, there is a problem that the mouse pointer doesn’t work in android in VirtualBox, but you may use this guide to install it beside other systems as a main system and the mouse should work I guess, otherwise we’ll use the keyboard.
Step 1: Install VirtualBox in Linux
1. VirtualBox is available to install easily via official repositories in most Linux distributions, to install it on Ubuntu run.
$ sudo apt-get install virtualbox
For other Linux distributions like RHEL, CentOS and Fedora, use the following article to install Virtualbox.
- Install VirtualBox in RHEL, CentOS and Fedora
Step 2: Download and Install Android 4.4 KitKat in Virtualbox
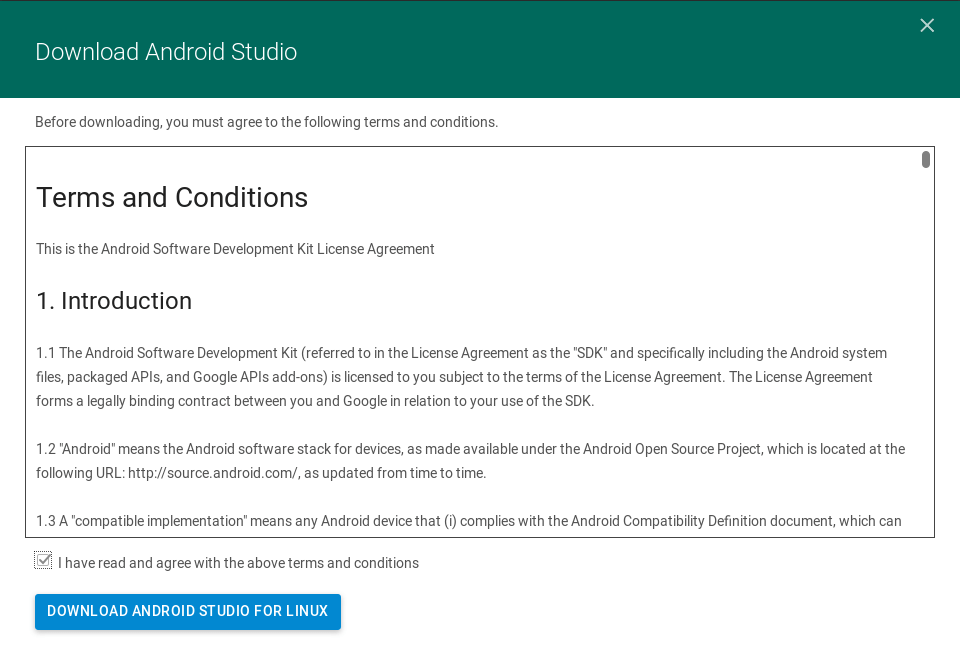
2. This is an easy step, just download Android 4.4 x86 Kit Kat file from the androud Sourceforge.net project.
3. To install Android 4.4 kitkat on VirtualBox, you need first to boot from the .iso image that you downloaded, to do so, open VirtualBox, Click on new to create a new virtual machine, and choose the settings as follow.
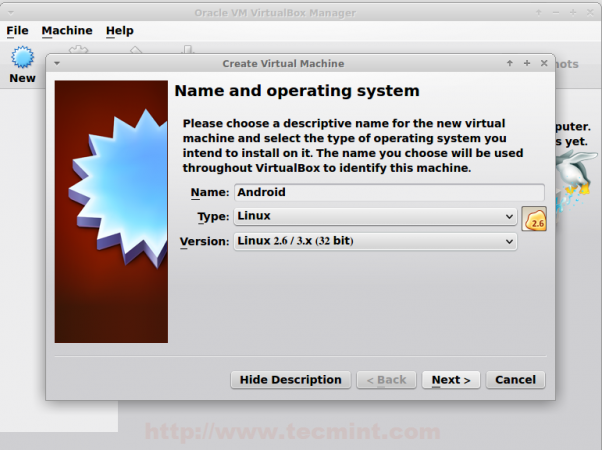
Create New Virtual Machine
4. Then it will ask you to choose a Memory size for the machine, Android 4.4 kitkat needs 1GB of RAM to work perfectly, but I will choose 512MB since I only have 1GB of RAM on my computer.
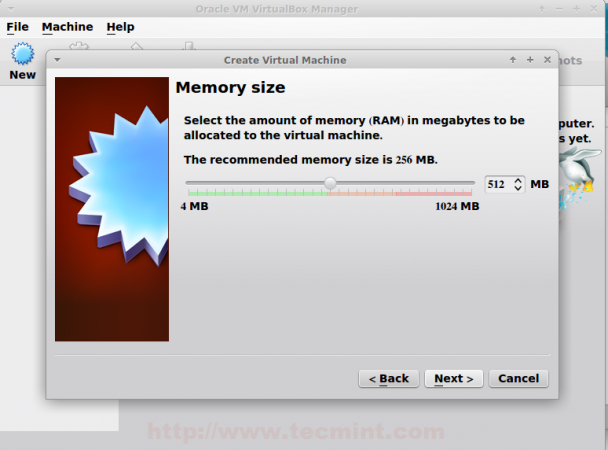
Set Memory to New Machine
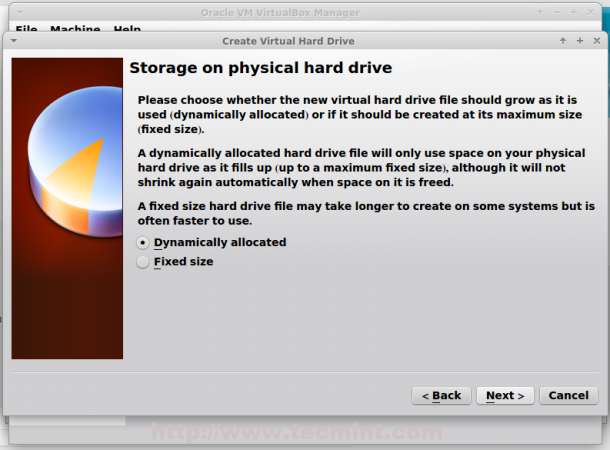
5. Now select “Create a virtual hard drive now” to create a new one.
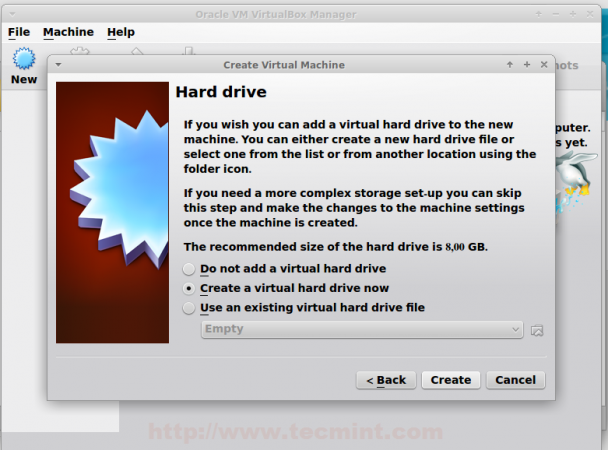
Create Virtual Hard Drive
6. It will now ask you for the type of the new virtual hard drive, select VDI.
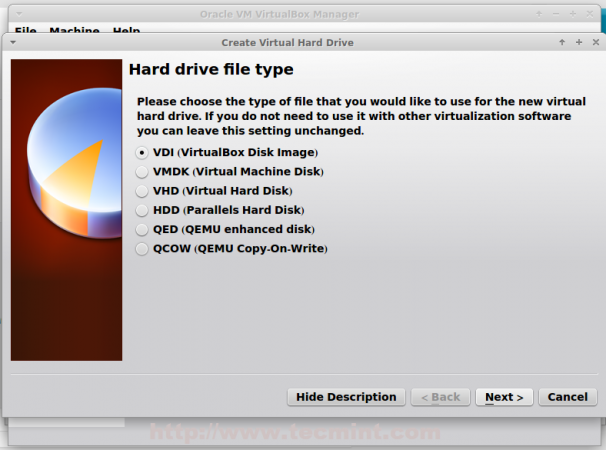
Select Hard Drive Type
Select Storage Type
7. Now choose the size of the virtual hard drive, you may choose any size you want, no less than 4GB so the system can be installed correctly beside any future apps that you want to install.
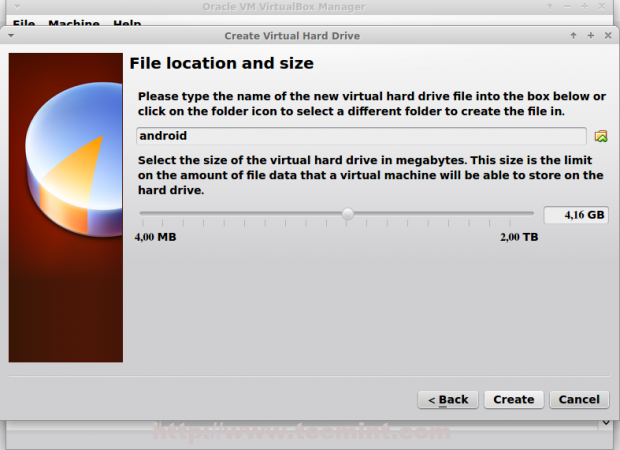
Set Size for Virtual Drive
8. Now that’s your first virtual machine is created, now to boot from the .iso file that you downloaded, select the virtual machine from the list on the left, click on Settings, and go for “storage”, do as follow and select the .isoimage of android 4.4 kitkat RC2.
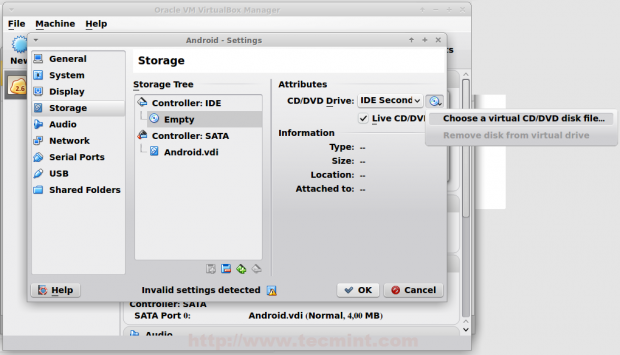
Select Android KitKat ISO
9. Click on OK, and start the machine to boot the .iso image, choose “Installation” to start installing the system on the virtual machine.
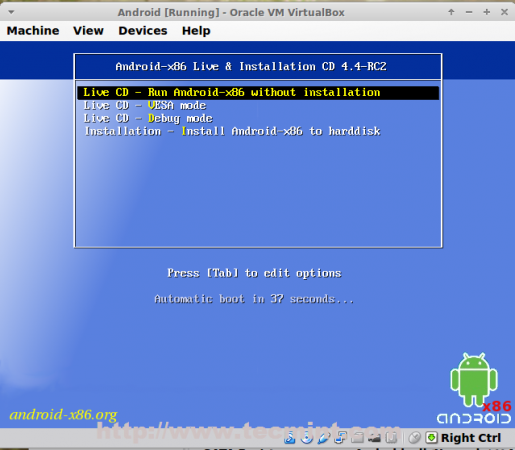
Select to Install Android Kit Kat
10. Please select a partition to install Android-x86.
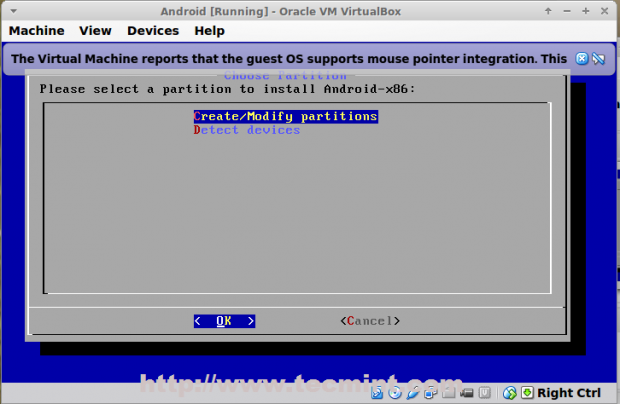
Select Partition Drive
11. Now you will be prompted cfdisk which is a partitioning tool that we will use to create a new hard drive, so we can install android 4.4 on it, Click on “New”.
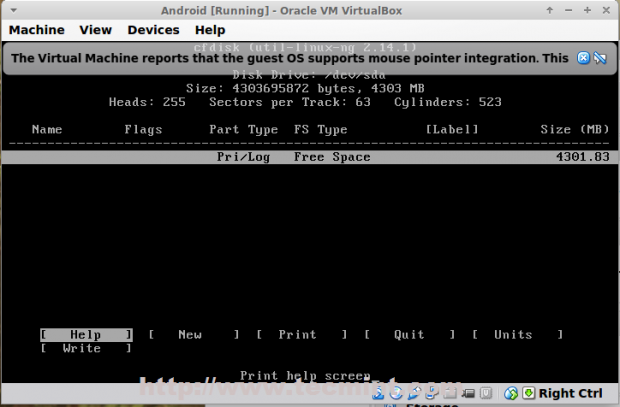
Create New Partition
12. Choose “Primary” as partition type.

Choose Primary Partition
13. Next, select the size of the partition.

Select Size of Partition
14. Now, we have to make the new hard drive bootable in order to be able to write changes to the disk, click on “Bootable” to give the bootable flag to the new partition, you won’t notice any changes in fact but the bootable flag will be given to that partition.

Make Partition Bootable
15. After that, click on “Write” to write the changes to the hard drive.
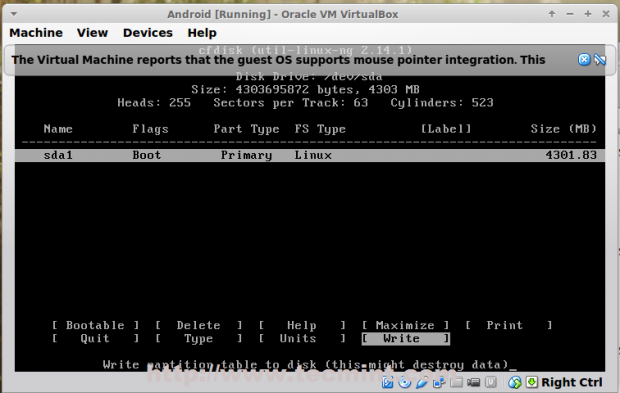
Apply Changes to Partition
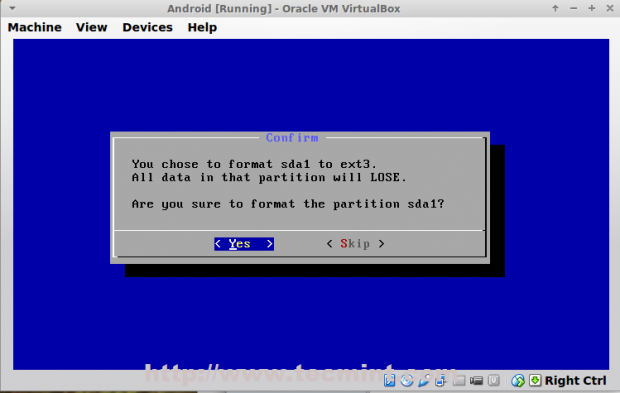
16. It will ask you if you are sure, write “yes” and click on Enter.
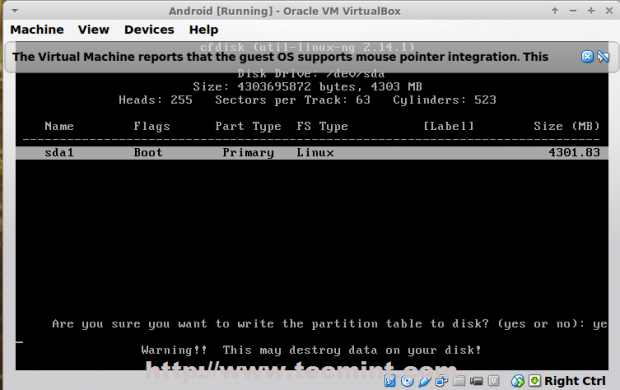
Confirm Partition Changes
17. Now that’s our new hard drive is created, now click on Quit and you will see something like this, select the partition that you created before in order to install android on it and hit Enter.
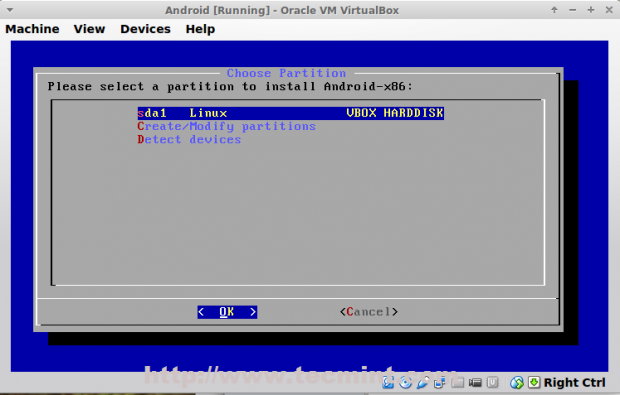
Choose Partition to Install Android
18. Choose “ext3” as a filesystem for the hard drive and format.
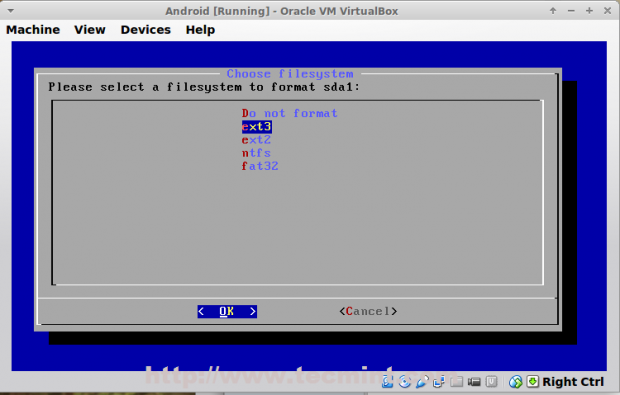
Select Ext3 Partition Type
Format Partition
19. You will be asked now if you want to install GRUB bootloader, of course you will select Yes, because if you don’t, you won’t be able to boot the new system, so choose “Yes” and hit Enter.

Install Boot Loader GRUB
20. Finally, you will be asked if you want to make the /system partition writeable, choose Yes, it will help in a lot of things later after you install the system.
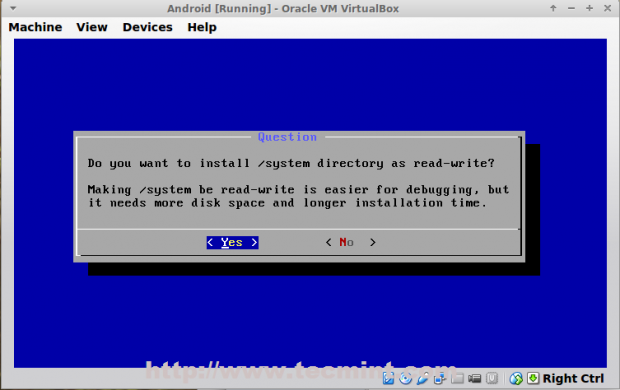
Make Partition Writeable
21. The installer will start it’s mission… after the installer finishes the job, choose Reboot, in my test, the “Run-Android x86” didn’t work for me, so you have to reboot.
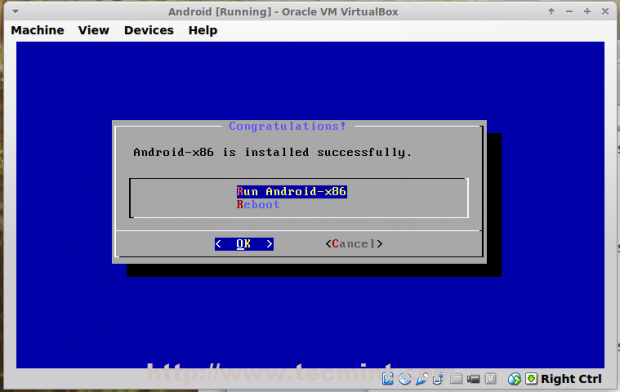
Android Kit Kat Installation
22. Now that’s we installed Android 4.4 KitKat RC2 on our hard drive, the problem is now that VirtualBox will keep loading the .iso image file instead of booting from the virtual hard drive, so to fix this problem, go to Settings, under “storage” select the .iso file and remove it from the booting menu.
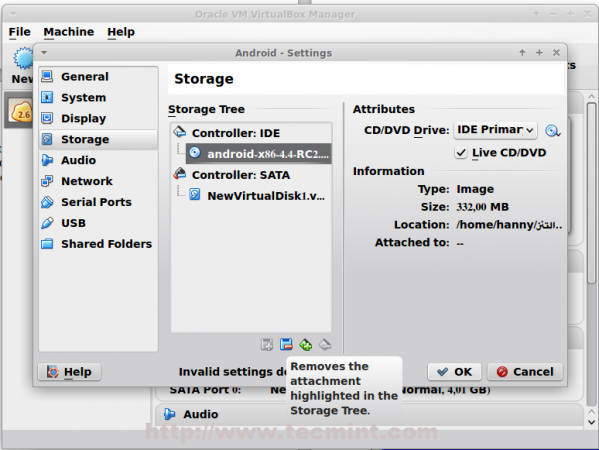
Remove Android Kit Kat Image
23. Now you can start the virtual machine with the installed android system.
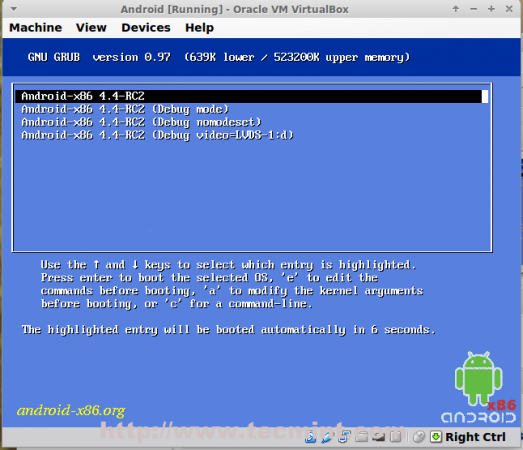
Start Android Kit Kat System
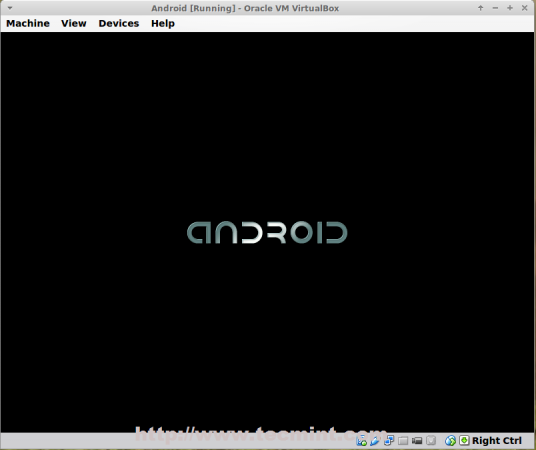
Android Splash Screen
24. Now you will start a wizard to configure some things before you start using Android. You will see a screen like this, Now the problem is, that the Mouse doesn’t work in android 4.4 KitKat, that means that we’ll be using our skills in keyboard, first choose the language you want using the Up and Down keys in the keyboard, and to go the next step, hit the Right arrow key and click Enter.
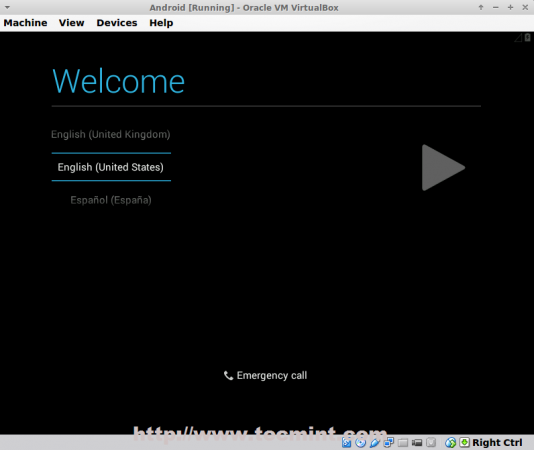
Android Welcome Screen
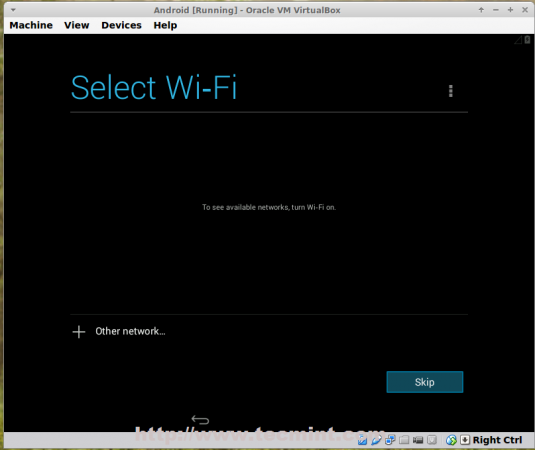
Select WiFi Network
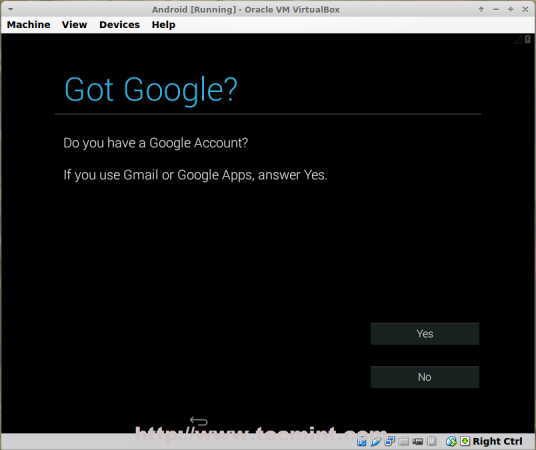
Create Android Google Account
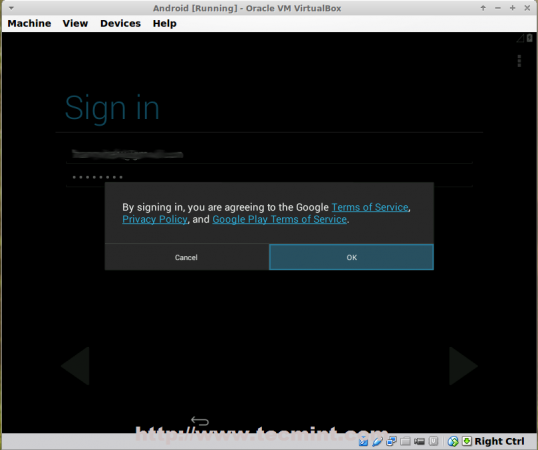
Sign in Google Account
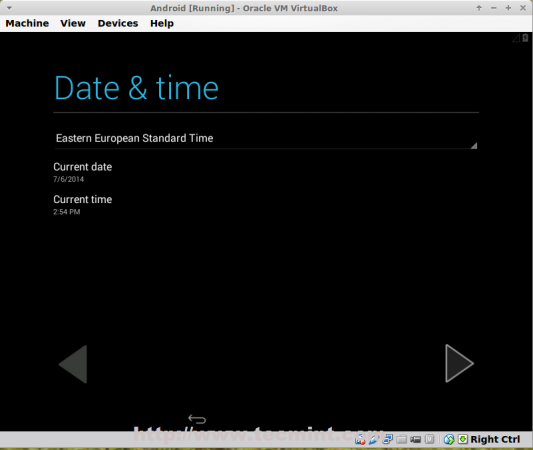
Set Date and Time
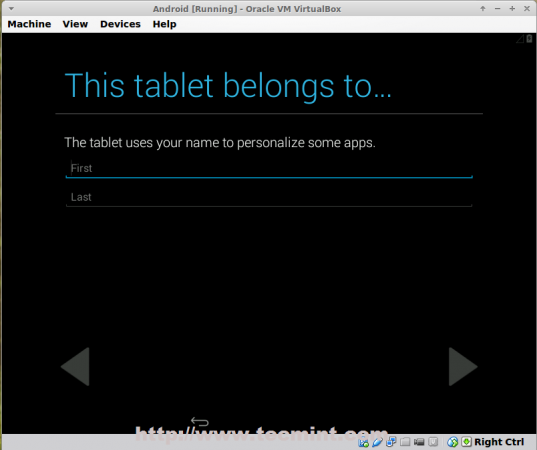
Enter Your Details
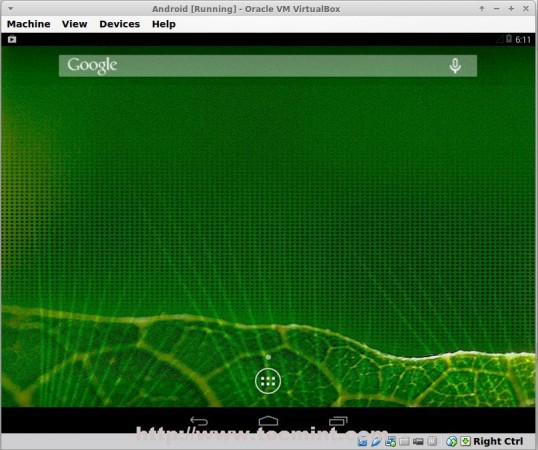
Android 4.4 Kit Kat Home Screen
Installing Android x86 will be good for you if you don’t have a smartphone and you want to use the Play Storeapps easily, have you ever tried to install android x86? What was the results? Do you think that android may become a “real operation system” targeting PCs in the feature?
Source