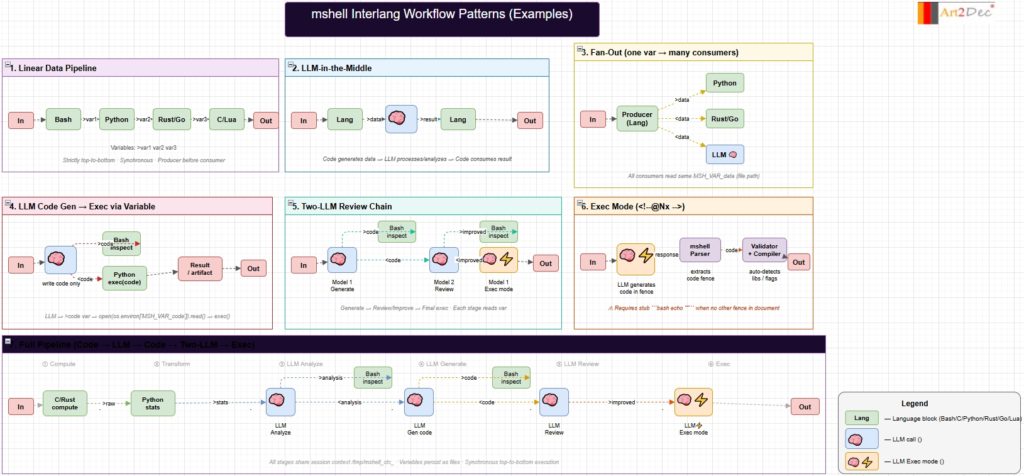
Docker throws weight behind Windows Subsystem for Linux, chucks Hyper-V option overboard • DEVCLASS

Docker has thrown its support behind Microsoft’s latest rev of the Windows Subsystem for Linux, promising a technical review of Docker Desktop for WSL-2 next month.

In a blog post yesterday, Docker’s Simon Ferquel, wrote that while the original WSL was “an impressive effort to emulate a Linux Kernel on top of Windows”, the fundamental differences were such that “it was impossible to run the Docker Engine and Kubernetes directly inside WSL.”

Docker had, consequently, developed “an alternative solution” using Hyper-V and LinuxKit.

However, the container innovator said that the new version, unveiled last month, delivered “a real Linux Kernel running inside a lightweight VM. This approach is architecturally very close to what we do with LinuxKit and Hyper-V today, with the additional benefit that it is more lightweight and more tightly integrated with Windows than Docker can provide alone.”

Consequently, wrote Ferquel, “We will replace the Hyper-V VM we currently use by a WSL 2 integration package.” He said this approach would provide the same features as the current approach: “Kubernetes 1-click setup, automatic updates, transparent HTTP proxy configuration, access to the daemon from Windows, transparent bind mounts of Windows files, and more.”

When it came to running Linux, he continued, “With WSL 2 integration, you will still experience the same seamless integration with Windows, but Linux programs running inside WSL will also be able to do the same.”

This would remove the need for running separate Linux and Windows build scripts, he continued, and “a developer at Docker can now work on the Linux Docker daemon on Windows, using the same set of tools and scripts as a developer on a Linux machine.”

The technical preview, “will run side by side with the current version of Docker Desktop, so you can continue to work safely on your existing projects. If you are running the latest Windows Insider build, you will be able to experience this first hand.”

Further features will be added over the coming months, “until the WSL 2 architecture is used in Docker Desktop for everyone running a compatible version of Windows.”

Microsoft and Docker have gotten steadily closer over the last year. The container outfit’s Docker Enterprise product has been tweaked to support ageing Windows architectures, giving Redmond’s customers a reason NOT to consider alternative platforms. At the same time, they have collaborated on specifications for running distributed applications.

Source

How to Install Latest MySQL 8.0 on RHEL/CentOS and Fedora

MySQL is an open source free relational database management system (RDBMS) released under GNU (General Public License). It is used to run multiple databases on any single server by providing multi-user access to each created database.

This article will walk through you the process of installing and updating latest MySQL 8.0 version on RHEL/CentOS 7/6/ and Fedora 28-26 using MySQL Yum repository via YUM utility.

Step 1: Adding the MySQL Yum Repository

1. We will use official MySQL Yum software repository, which will provides RPM packages for installing the latest version of MySQL server, client, MySQL Utilities, MySQL Workbench, Connector/ODBC, and Connector/Python for the RHEL/CentOS 7/6/ and Fedora 28-26.

Important: These instructions only works on fresh installation of MySQL on the server, if there is already a MySQL installed using a third-party-distributed RPM package, then I recommend you to upgrade or replace the installed MySQL package using the MySQL Yum Repository”.

Before Upgrading or Replacing old MySQL package, don’t forget to take all important databases backup and configuration files.

2. Now download and add the following MySQL Yum repository to your respective Linux distribution system’s repository list to install the latest version of MySQL (i.e. 8.0 released on 27 July 2018).

--------------- On RHEL/CentOS 7 ---------------
# wget https://repo.mysql.com/mysql80-community-release-el7-1.noarch.rpm
--------------- On RHEL/CentOS 6 ---------------
# wget https://dev.mysql.com/get/mysql80-community-release-el6-1.noarch.rpm
--------------- On Fedora 28 ---------------
# wget https://dev.mysql.com/get/mysql80-community-release-fc28-1.noarch.rpm
--------------- On Fedora 27 ---------------
# wget https://dev.mysql.com/get/mysql80-community-release-fc27-1.noarch.rpm
--------------- On Fedora 26 ---------------
# wget https://dev.mysql.com/get/mysql80-community-release-fc26-1.noarch.rpm

3. After downloading the package for your Linux platform, now install the downloaded package with the following command.

--------------- On RHEL/CentOS 7 ---------------
# yum localinstall mysql80-community-release-el7-1.noarch.rpm
--------------- On RHEL/CentOS 6 ---------------
# yum localinstall mysql80-community-release-el6-1.noarch.rpm
--------------- On Fedora 28 ---------------
# dnf localinstall mysql80-community-release-fc28-1.noarch.rpm
--------------- On Fedora 27 ---------------
# dnf localinstall mysql80-community-release-fc27-1.noarch.rpm
--------------- On Fedora 26 ---------------
# yum localinstall mysql80-community-release-fc26-1.noarch.rpm

The above installation command adds the MySQL Yum repository to system’s repository list and downloads the GnuPG key to verify the integrity of the packages.

4. You can verify that the MySQL Yum repository has been added successfully by using following command.

# yum repolist enabled | grep "mysql.*-community.*"
# dnf repolist enabled | grep "mysql.*-community.*"      [On Fedora versions]

Verify MySQL Yum Repository

Verify MySQL Yum Repository

Step 2: Installing Latest MySQL Version

5. Install latest version of MySQL (currently 8.0) using the following command.

# yum install mysql-community-server
# dnf install mysql-community-server      [On Fedora versions]

The above command installs all the needed packages for MySQL server mysql-community-servermysql-community-clientmysql-community-common and mysql-community-libs.

Step 3: Installing MySQL Release Series

6. You can also install different MySQL version using different sub-repositories of MySQL Community Server. The sub-repository for the recent MySQL series (currently MySQL 8.0) is activated by default, and the sub-repositories for all other versions (for example, the MySQL 5.x series) are deactivated by default.

To install specific version from specific sub-repository, you can use --enable or --disable options using yum-config-manager or dnf config-manager as shown:

# yum-config-manager --disable mysql57-community
# yum-config-manager --enable mysql56-community
------------------ Fedora Versions ------------------
# dnf config-manager --disable mysql57-community
# dnf config-manager --enable mysql56-community

Step 4: Starting the MySQL Server

7. After successful installation of MySQL, it’s time to start the MySQL server with the following command:

# service mysqld start

You can verify the status of the MySQL server with the help of following command.

# service mysqld status

This is the sample output of running MySQL under my CentOS 7 box.

Redirecting to /bin/systemctl status  mysqld.service
mysqld.service - MySQL Server
   Loaded: loaded (/usr/lib/systemd/system/mysqld.service; enabled)
   Active: active (running) since Thu 2015-10-29 05:15:19 EDT; 4min 5s ago
  Process: 5314 ExecStart=/usr/sbin/mysqld --daemonize $MYSQLD_OPTS (code=exited, status=0/SUCCESS)
  Process: 5298 ExecStartPre=/usr/bin/mysqld_pre_systemd (code=exited, status=0/SUCCESS)
 Main PID: 5317 (mysqld)
   CGroup: /system.slice/mysqld.service
           └─5317 /usr/sbin/mysqld --daemonize

Oct 29 05:15:19 localhost.localdomain systemd[1]: Started MySQL Server.

Check Mysql Status

Check Mysql Status

8. Now finally verify the installed MySQL version using following command.

# mysql --version

mysql  Ver 8.0.12 for Linux on x86_64 (MySQL Community Server - GPL)

Check MySQL Installed Version

Check MySQL Installed Version

Step 5: Securing the MySQL Installation

9. The command mysql_secure_installation allows you to secure your MySQL installation by performing important settings like setting the root password, removing anonymous users, removing root login, and so on.

Note: MySQL version 8.0 or higher generates a temporary random password in /var/log/mysqld.log after installation.

Use below command to see the password before running mysql secure command.

# grep 'temporary password' /var/log/mysqld.log

Once you know the password you can now run following command to secure your MySQL installation.

# mysql_secure_installation

Note: Enter new Root password means your temporary password from file /var/log/mysqld.log.

Now follow the onscreen instructions carefully, for reference see the output of the above command below.

Sample Output
Securing the MySQL server deployment.

Enter password for user root: Enter New Root Password

VALIDATE PASSWORD PLUGIN can be used to test passwords
and improve security. It checks the strength of password
and allows the users to set only those passwords which are
secure enough. Would you like to setup VALIDATE PASSWORD plugin?

Press y|Y for Yes, any other key for No: y

There are three levels of password validation policy:

LOW    Length >= 8
MEDIUM Length >= 8, numeric, mixed case, and special characters
STRONG Length >= 8, numeric, mixed case, special characters and dictionary                  file

Please enter 0 = LOW, 1 = MEDIUM and 2 = STRONG: 2
Using existing password for root.

Estimated strength of the password: 50 
Change the password for root ? ((Press y|Y for Yes, any other key for No) : y

New password: Set New MySQL Password

Re-enter new password: Re-enter New MySQL Password

Estimated strength of the password: 100 
Do you wish to continue with the password provided?(Press y|Y for Yes, any other key for No) : y
By default, a MySQL installation has an anonymous user,
allowing anyone to log into MySQL without having to have
a user account created for them. This is intended only for
testing, and to make the installation go a bit smoother.
You should remove them before moving into a production
environment.

Remove anonymous users? (Press y|Y for Yes, any other key for No) : y
Success.


Normally, root should only be allowed to connect from
'localhost'. This ensures that someone cannot guess at
the root password from the network.

Disallow root login remotely? (Press y|Y for Yes, any other key for No) : y
Success.

By default, MySQL comes with a database named 'test' that
anyone can access. This is also intended only for testing,
and should be removed before moving into a production
environment.

Remove test database and access to it? (Press y|Y for Yes, any other key for No) : y
 - Dropping test database...
Success.

 - Removing privileges on test database...
Success.

Reloading the privilege tables will ensure that all changes
made so far will take effect immediately.

Reload privilege tables now? (Press y|Y for Yes, any other key for No) : y
Success.

All done! 

Step 6: Connecting to MySQL Server

10. Connecting to newly installed MySQL server by providing username and password.

# mysql -u root -p

Sample Output:

Welcome to the MySQL monitor.  Commands end with ; or \g.
Your MySQL connection id is 19
Server version: 8.0.1 MySQL Community Server (GPL)

Copyright (c) 2000, 2015, Oracle and/or its affiliates. All rights reserved.

Oracle is a registered trademark of Oracle Corporation and/or its
affiliates. Other names may be trademarks of their respective
owners.

Type 'help;' or '\h' for help. Type '\c' to clear the current input statement.
mysql>

Step 7: Updating MySQL with Yum

11. Besides fresh installation, you can also do updates for MySQL products and components with the help of following command.

# yum update mysql-server
# dnf update mysql-server       [On Fedora versions]

Update MySQL Version

Update MySQL Version

When new updates are available for MySQL, it will auto install them, if not you will get a message saying NO packages marked for updates.

That’s it, you’ve successfully installed MySQL 8.0 on your system. If you’re having any trouble installing feel free to use our comment section for solutions.

Source

How to Check MySQL Database Size in Linux

In this article, I will show you how to check the size of MySQL/MariaDB databases and tables via the MySQL shell. You will learn how to determine the real size of a database file on the disk as well as size of data that it present in a database.

Read Also20 MySQL (Mysqladmin) Commands for Database Administration in Linux

By default MySQL/MariaDB stores all the data in the file system, and the size of data that exists on the databases may differ from the actual size of Mysql data on the disk that we will see later on.

In addition, MySQL uses the information_schema virtual database to store information about your databases and other settings. You can query it to gather information about size of databases and their tables as shown.

# mysql -u root -p
MariaDB [(none)]> SELECT table_schema AS "Database Name", 
ROUND(SUM(data_length + index_length) / 1024 / 1024, 2) AS "Size in (MB)" 
FROM information_schema.TABLES 
GROUP BY table_schema; 

Check MySQL Database Size

Check MySQL Database Size

To find out the size of a single MySQL database called rcubemail (which displays the size of all tables in it) use the following mysql query.

MariaDB [(none)]> SELECT table_name AS "Table Name",
ROUND(((data_length + index_length) / 1024 / 1024), 2) AS "Size in (MB)"
FROM information_schema.TABLES
WHERE table_schema = "rcubemail"
ORDER BY (data_length + index_length) DESC;

Check Size of MySQL Database

Check Size of MySQL Database

Finally, to find out the actual size of all MySQL database files on the disk (filesystem), run the du commandbelow.

# du -h /var/lib/mysql

Check MySQL Size on Disk

Check MySQL Size on Disk

You might also like to read these following MySQL related articles.

  1. 4 Useful Commandline Tools to Monitor MySQL Performance in Linux
  2. 12 MySQL/MariaDB Security Best Practices for Linux

For any queries or additional ideas you want to share regarding this topic, use the feedback form below.

Source

What Is Kubernetes? – Make Tech Easier

Kubernetes (pronounced “CUBE-A-NET-IS”) is an open-source platform that helps manage container applications such as Docker. Whether you are looking to automate or scale these containers across multiple hosts, Kubernetes can speed up deployment. To do this it may use internal components such as Kubernetes API or third-party extensions which run on Kubernetes.

This article will help you understand the basic concepts of Kubernetes and why it is causing such a seismic shift in the server market, with vendors as well as cloud providers, such as Azure and Google Cloud, offering Kubernetes services.

Kubernetes: A Brief History

Kubernetes is one of Google’s gifts to the open source community. The container platform was a part of Borg, an internal Google project for more than a decade. Borg let Google manage hundreds and even thousands of tasks (called “Borglets”) from different applications across clusters. Its objective was to efficiently utilize machines (and virtual machines) while ensuring high availability of run-time features.

High level architecture of Borg from Google AI

The same architecture was popular with other companies looking for ways to efficiently ensure high availability. Somewhere in 2015, as soon as Kubernetes 1.0 came out, Google gave up control over the technology. Kubernetes is now with a foundation called Cloud Native Computing Foundation (CNCF), which itself is part of the Linux Foundation.

Kubernetes as part of CNCF and Linux Foundation

How Kubernetes Works

Borrowing the ideas of the Borg Project, the “Borglets” gave way to “pods,” which are scheduler units housing the containers. Essentially, they have individual IP addresses which come into the picture whenever a container requires CPU, memory or storage.

containers-schematic

The pods ensure high availability by load balancing the traffic in a round-robin format. Furthermore, they are inside machines (or virtual machines) called “worker nodes,” also known as “minions.” From this point a “master node” controls the entire cluster by orchestrating containerization using the Kubernetes API. Docker is capable of running in each worker node where it can download images and start containers.

Kubernetes load balancing cluster

To get the API connection at a Kubernetes cluster, a CLI syntax called kubectl is used. This is a very important command because it single-handedly runs all the instructions which the Master node serves to worker nodes. Mastering kubectl requires a bit of learning, but once you learn, you can start utilizing Kubernetes clusters. Kubernetes as well as Docker are written in the Go programming language.

Applications

Kubernetes can drastically bring down server and data center costs because of its high efficiency in using the machines. Some of the common applications of Kubernetes include:

  • Managing application servers. Most application servers require security, configuration management, updates and more, which can run using Kubernetes.
  • Automatic rollouts and rollbacks. With Kubernetes, you don’t have to worry about product rollouts or rollbacks across multiple end nodes.
  • Deploying stateless apps. Web applications are now remotely controllable. For example, Kubernetes can help you run Nginx servers using a stateless application deployment.
  • Deploying stateful apps. Kubernetes can run a MySQL database.
  • Storing API objects. For different storage needs, Kubernetes ensures ideal storage because it uses container principles.
  • Out-of-the-box-ready. Kubernetes is very helpful in out-of-the-box applications such as service discovery, logging and monitoring and authentication.
  • IoT applications. Kubernetes is finding an increasing use in IoT because of its massive scaling capability.
  • Run anywhere. You can run Kubernetes anywhere, including inside a suitcase.

kubernetes-suitcase-cluster-assembly-twitter-ocasquero

In Summary

The objective of Kubernetes is to utilize computing resources to their maximum extent. Since you can orchestrate containers across multiple hosts, the end nodes will never have resource problems or failure. It helps scale automatically because you only have to give the command once from Master node, and to scale applicataions is nothing short of revolutionary.

To learn more about Kubernetes, visit its official website which contains tutorials.

Source

Swatchdog – Simple Log File Watcher in Real-Time in Linux

Swatchdog (the “Simple WATCH DOG”) is a simple Perl script for monitoring active log files on Unix-like systems such as Linux. It watches your logs based on regular expressions that you can define in a configuration file. You can run it from the command line or in the background, detached from any terminal using the daemon mode option.

Note that the program was originally called swatch (the “Simple Watcher”) but a request by the old Swiss watch company for a name change saw the developer change its name to swatchdog.

Read Also4 Good Open Source Log Monitoring and Management Tools for Linux

Importantly, swatchdog has grown from a script for watching logs produced by Unix’s syslog facility, and it can monitor just about any kind of logs.

How to Install Swatch in Linux

The package swatchdog is available to install from the official repositories of mainstream Linux distributions as a package “swatch” via a package manager as shown.

$ sudo apt install swatch	[On Ubuntu/Debian]
$ sudo yum install epel-release && sudo yum install swatch	[On RHEL/CentOS]
$ sudo dnf install swatch	[On Fedora 22+]

To install most latest version of swatchdog, you need to compile it from source using following commands in any Linux distribution.

$ git clone https://github.com/ToddAtkins/swatchdog.git
$ cd swatchdog/
$ perl Makefile.PL
$ make
$ sudo make install
$ sudo make realclean

Once you have installed the swatch, you need to create its configuration file (default location is /home/$USER/.swatchdogrc or .swatchrc), to determine what types of expression patterns to look for and what type of action(s) should be taken when a pattern is matched.

$ touch /home/tecmint/.swatchdogrc
OR
$ touch /home/tecmint/.swatchrc

Add your regular expression in this file and each line should contain a keyword and value (sometimes optional), separated by a space or an equal (=) sign. You need to specify a pattern and an action(s) to be taken when a pattern is matched.

We will use a simple configuration file, you can find more options in the swatchdog man page, for instance.

watchfor  /sudo/
	echo red
	mail=admin@tecmint.com, subject="Sudo Command"

Here, our regular expression is a literal string – “sudo”, means any time the string sudo appeared in the log file, would be printed to the terminal in red text and mail specify the action to be taken, which is to echo the matched pattern on the terminal and send an e-mail to the specified address, receptively.

After you have configured it, swatchdog reads the /var/log/syslog log file by default, if this file is not present, it reads /var/log/messages.

$ swatch     [On RHEL/CentOS & Fedora]
$ swatchdog  [On Ubuntu/Debian]

You can specify a different configuration file using the -c flag as shown in the following example.

First create a swatch configuration directory and a file.

$ mkdir swatch
$ touch swatch/secure.conf

Next, add the following configuration in the file to monitor failed login attempts, failed SSH login attempts, successful SSH logins from the /var/log/secure log file.

watchfor /FAILED/
echo red
mail=admin@tecmint.com, subject="Failed Login Attempt"

watchfor /ROOT LOGIN/
echo red
mail=admin@tecmint.com, subject="Successful Root Login"

watchfor /ssh.*: Failed password/
echo red
mail=admin@tecmint.com, subject="Failed SSH Login Attempt"

watchfor /ssh.*: session opened for user root/ 
echo red
mail=admin@tecmint.com, subject="Successful SSH Root Login"

Now run the Swatch by specifying the configuration file using the -c and log file using -t flag as shown.

$ swatchdog -c ~/swatch/secure.conf -t /var/log/secure

To run it in the background, use the --daemon flag; in this mode, it is detached from any terminal.

$ swatchdog ~/swatch/secure.conf -t /var/log/secure --daemon  

Now to test the swatch configuration, try to login into server from the different terminal, you see the following output printed to the terminal where Swatchdog is running.

*** swatch version 3.2.3 (pid:16531) started at Thu Jul 12 12:45:10 BST 2018

Jul 12 12:51:19 tecmint sshd[16739]: Failed password for root from 192.168.0.103 port 33324 ssh2
Jul 12 12:52:07 tecmint sshd[16739]: pam_unix(sshd:session): session opened for user root by (uid=0)

Monitor Linux Logs in Real Time

Monitor Linux Logs in Real Time

You can also run multiple swatch processes to monitor various log files.

$ swatchdog -c ~/site1_watch_config -t /var/log/nginx/site1/access_log --daemon  
$ swatchdog -c ~/messages_watch_config -t /var/log/messages --daemon
$ swatchdog -c ~/auth_watch_config -t /var/log/auth.log --daemon

For more information, check out the swatchdog man page.

$ man swatchdog

Swatchdog SourceForge Repository: https://sourceforge.net/projects/swatch/

The following are some additional log monitoring guides that you will find useful:

  1. 4 Ways to Watch or Monitor Log Files in Real Time
  2. How to Create a Centralized Log Server with Rsyslog
  3. Monitor Server Logs in Real-Time with “Log.io” Tool
  4. lnav – Watch and Analyze Apache Logs from a Linux Terminal
  5. ngxtop – Monitor Nginx Log Files in Real Time in Linux

Swatchdog is a simple active log file monitoring tool for Unix-like systems such as Linux. Try it out and share your thoughts or ask any questions in the comments section.

Source

How to Set Linux Process Priority Using nice and renice Commands

In this article, we’ll briefly explain the kernel scheduler (also known as the process scheduler), and process priority, which are topics beyond the scope of this guide. Then we will dive into a little bit of Linux process management: see how to run a program or command with modified priority and also change the priority of running Linux processes.

Read Also: How to Monitor Linux Processes and Set Process Limits on a Per-User Basis

Understanding the Linux Kernel Scheduler

The kernel scheduler is a unit of the kernel that determines the most suitable process out of all runnable processes to execute next; it allocates processor time between the runnable processes on a system. A runnable process is one which is waiting only for CPU time, it’s ready to be executed.

The scheduler forms the core of multitasking in Linux, using a priority-based scheduling algorithm to choose between the runnable processes in the system. It ranks processes based on the most deserving as well as need for CPU time.

Understanding Process Priority and Nice Value

The kernel stores a great deal of information about processes including process priority which is simply the scheduling priority attached to a process. Processes with a higher priority will be executed before those with a lower priority, while processes with the same priority are scheduled one after the next, repeatedly.

There are a total of 140 priorities and two distinct priority ranges implemented in Linux. The first one is nice value (niceness) which ranges from -20 (highest priority value) to 19 (lowest priority value) and the default is 0, this is what we will uncover in this guide. The other is the real-time priority, which ranges from 1 to 99 by default, then 100 to 139 are meant for user-space.

One important characteristic of Linux is dynamic priority-based scheduling, which allows nice value of a processes to be changed (increased or decreased) depending on your needs, as we’ll see later on.

How to Check Nice Value of Linux Processes

To see the nice values of processes, we can use utilities such as pstop or htop.

To view processes nice value with ps command in user-defined format (here the NI column shows niceness of processes).

$ ps -eo pid,ppid,ni,comm

View Linux Processes Nice Values

View Linux Processes Nice Values

Alternatively, you can use top or htop utilities to view Linux processes nice values as shown.

$ top
$ htop

Check Linux Process Nice Values using Top Command

Check Linux Process Nice Values using Top Command

Check Linux Process Nice Values using Htop Command

Check Linux Process Nice Values using Htop Command

Difference Between PR or PRI and NI

From the top and htop outputs above, you’ll notice that there is a column called PR and PRI receptively which show the priority of a process.

This therefore means that:

  • NI – is the nice value, which is a user-space concept, while
  • PR or PRI – is the process’s actual priority, as seen by the Linux kernel.
How To Calculate PR or PRI Values
Total number of priorities = 140
Real time priority range(PR or PRI):  0 to 99 
User space priority range: 100 to 139

Nice value range (NI): -20 to 19

PR = 20 + NI
PR = 20 + (-20 to + 19)
PR = 20 + -20  to 20 + 19
PR = 0 to 39 which is same as 100 to 139.

But if you see a rt rather than a number as shown in the screen shot below, it basically means the process is running under real time scheduling priority.

Linux rt Process

Linux rt Process

How to Run A Command with a Given Nice Value in Linux

Here, we will look at how to prioritize the CPU usage of a program or command. If you have a very CPU-intensive program or task, but you also understand that it might take a long time to complete, you can set it a high or favorable priority using the nice command.

The syntax is as follows:

$ nice -n niceness-value [command args] 
OR
$ nice -niceness-value [command args] 	#it’s confusing for negative values
OR
$ nice --adjustment=niceness-value [command args]

Important:

  • If no value is provided, nice sets a priority of 10 by default.
  • A command or program run without nice defaults to a priority of zero.
  • Only root can run a command or program with increased or high priority.
  • Normal users can only run a command or program with low priority.

For example, instead of starting a program or command with the default priority, you can start it with a specific priority using following nice command.

$ sudo nice -n 5 tar -czf backup.tar.gz ./Documents/*
OR
$ sudo nice --adjustment=5 tar -czf backup.tar.gz ./Documents/*

You can also use the third method which is a little confusing especially for negative niceness values.

$ sudo nice -5 tar -czf backup.tar.gz  ./Documents/*

Change the Scheduling Priority of a Process in Linux

As we mentioned before, Linux allows dynamic priority-based scheduling. Therefore, if a program is already running, you can change its priority with the renice command in this form:

$ renice -n  -12  -p 1055
$ renice -n -2  -u apache

Change Process Priority

Change Process Priority

From the sample top output below, the niceness of the teamspe+ with PID 1055 is now -12 and for all processes owned by user apache is -2.

Still using this output, you can see the formula PR = 20 + NI stands,

PR for ts3server = 20 + -12 = 8
PR for apache processes = 20 + -2 = 18

Watch Processes Nice Values

Watch Processes Nice Values

Any changes you make with renice command to a user’s processes nice values are only applicable until the next reboot. To set permanent default values, read the next section.

How To Set Default Nice Value Of a Specific User’s Processes

You can set the default nice value of a particular user or group in the /etc/security/limits.conf file. It’s primary function is to define the resource limits for the users logged in via PAM.

The syntax for defining a limit for a user is as follows (and the possible values of the various columns are explained in the file):

#<domain>   <type>  <item>  <value>

Now use the syntax below where hard – means enforcing hard links and soft means – enforcing the soft limits.

<username>  <hard|soft>  priority  <nice value>

Alternatively, create a file under /etc/security/limits.d/ which overrides settings in the main file above, and these files are read in alphabetical order.

Start by creating the file /etc/security/limits.d/tecmint-priority.conf for user tecmint:

# vi /etc/security/limits.d/tecmint-priority.conf

Then add this configuration in it:

tecmint  hard  priority  10

Save and close the file. From now on, any process owned by tecmint will have a nice value of 10 and PR of 30.

For more information, read the man pages of nice and renice:

$ man nice
$ man renice 

You might also like to read these following articles about Linux process management.

  1. How to Find and Kill Running Processes in Linux
  2. A Guide to Kill, Pkill and Killall Commands to Terminate a Process in Linux
  3. How to Monitor System Usage, Outages and Troubleshoot Linux Servers
  4. CPUTool – Limit and Control CPU Utilization of Any Process in Linux

In this article, we briefly explained the kernel scheduler, process priority, looked at how to run a program or command with modified priority and also change the priority of active Linux processes. You can share any thoughts regarding this topic via the feedback form below.

Source

Conky – The Ultimate X Based System Monitor Application

Conky is a system monitor application written in ‘C’ Programming Language and released under GNU General Public License and BSD License. It is available for Linux and BSD Operating System. The application is X (GUI) based that was originally forked from Torsmo.

Features

  1. Simple User Interface
  2. Higher Degree of configuration
  3. It can show System stats using built-in objects (300+) as well as external scripts either on the desktop or in it’s own container.
  4. Low on Resource Utilization
  5. Shows system stats for a wide range of system variables which includes but not restricted to CPU, memory, swap, Temperature, Processes, Disk, Network, Battery, email, System messages, Music player, weather, breaking news, updates and blah..blah..blah
  6. Available in Default installation of OS like CrunchBang Linux and Pinguy OS.
Lesser Known Facts about Conky
  1. The Name conky was derived from a Canadian Television Show.
  2. It has already been ported to Nokia N900.
  3. It is no more maintained officially.

Conky Installation and Usage in Linux

Before we install conky, we need to install packages like lm-sensorscurl and hddtemp using following command.

# apt-get install lm-sensors curl hddtemp

Time to detect-sensors.

# sensors-detect

Note: Answer ‘Yes‘ when prompted!

Check all the detected sensors.

# sensors
Sample Output
acpitz-virtual-0
Adapter: Virtual device
temp1:        +49.5°C  (crit = +99.0°C)

coretemp-isa-0000
Adapter: ISA adapter
Physical id 0:  +49.0°C  (high = +100.0°C, crit = +100.0°C)
Core 0:         +49.0°C  (high = +100.0°C, crit = +100.0°C)
Core 1:         +49.0°C  (high = +100.0°C, crit = +100.0°C)

Conky can be installed from repo as well as, can be compiled from source.

# yum install conky              [On RedHat systems]
# apt-get install conky-all      [On Debian systems]

Note: Before you install conky on Fedora/CentOS, you must have enabled EPEL repository.

After conky has been installed, just issue following command to start it.

$ conky &

Conky Monitor Window

Conky Monitor in Action

It will run conky in a popup like window. It uses the basic conky configuration file located at /etc/conky/conky.conf.

You may need to integrate conky with the desktop and won’t like a popup like window every-time. Here is what you need to do

Copy the configuration file /etc/conky/conky.conf to your home directory and rename it as ‘.conkyrc‘. The dot (.) at the beginning ensures that the configuration file is hidden.

$ cp /etc/conky/conky.conf /home/$USER/.conkyrc

Now restart conky to take new changes.

$ killall -SIGUSR1 conky

Conky Monitor Window

Conky Monitor Window

You may edit the conky configuration file located in your home dircetory. The configuration file is very easy to understand.

Here is a sample configuration of conky.

Conky Configuration

Conky Configuration

From the above window you can modify color, borders, size, scale, background, alignment and several other properties. By setting different alignments to different conky window, we can run more than one conky script at a time.

Using script other than the default for conky and where to find it?

You may write your own conky script or use one that is available over Internet. We don’t suggest you to use any script you find on the web which can be potentially dangerous unless you know what you are doing. However a few famous threads and pages have conky script that you can trust as mentioned below.

http://ubuntuforums.org/showthread.php?t=281865
http://conky.sourceforge.net/screenshots.html

At the above url, you will find every screenshot has a hyperlink, which will redirects to script file.

Testing Conky Script

Here I will be running a third party written conky-script on my Debian Jessie Machine, to test.

$ wget https://github.com/alexbel/conky/archive/master.zip
$ unzip master.zip 

Change current working directory to just extracted directory.

$ cd conky-master

Rename the secrets.yml.example to secrets.yml.

$ mv secrets.yml.example secrets.yml

Install Ruby before you could run this (ruby) script.

$ sudo apt-get install ruby
$ ruby starter.rb 

Conky Fancy Look

Conky Fancy Look

Note: This script can be modified to show your current weather, temperature, etc.

If you want to start conky at boot, add the below one liner to startup Applications.

conky --pause 10 
save and exit.

And Finally…such a lightweight and useful GUI eye candy like package is not in active stage and is not maintained officially anymore. The last stable release was conky 1.9.0 released on May 03, 2012. A thread on Ubuntu forum has gone over 2k pages of users sharing configuration. (link to forum : http://ubuntuforums.org/showthread.php?t=281865/)

Conky Homepage

That’s all for now. Keep connected. Keep commenting. Share your thoughts and configuration in comments below.

Source

5 Tools to Scan a Linux Server for Malware and Rootkits

There are constant level of high attacks and port scans on Linux servers all the time, while a properly configured firewall and regular security system updates adds a extra layer to keep the system safe, but you should also frequently watch if anyone got in. This will also helps to ensure that your server stays free of any program that aims at disrupting its normal operation.

The tools presented in this article are created for these security scans and they are able to identity Virus, Malwares, Rootkits, and Malicious behaviors. You can use these tools make regularly system scans e.g. every night and mail reports to your email address.

1. Lynis – Security Auditing and Rootkit Scanner

Lynis is a free, open source, powerful and popular security auditing and scanning tool for Unix/Linux like operating systems. It is a malware scanning and vulnerability detecting tool that scans systems for security information and issues, file integrity, configuration errors; performs firewall auditing, checks installed software, file/directory permissions and so much more.

Importantly, it doesn’t automatically perform any system hardening, however, it simply offers suggestions that enable you to harden your server.

We will install latest version of Lynis (i.e. 2.6.6) from the sources, using following commands.

# cd /opt/
# wget https://downloads.cisofy.com/lynis/lynis-2.6.6.tar.gz
# tar xvzf lynis-2.6.6.tar.gz
# mv lynis /usr/local/
# ln -s /usr/local/lynis/lynis /usr/local/bin/lynis

Now you can perform your system scanning with the command below.

# lynis audit system

Lynis Linux Security Auditing Tool

Lynis Linux Security Auditing Tool

To make run Lynis automatically at every night, add the following cron entry, which will run at 3am night and send reports to your email address.

0 3 * * * /usr/local/bin/lynis --quick 2>&1 | mail -s "Lynis Reports of My Server" you@yourdomain.com

2. Chkrootkit – A Linux Rootkit Scanners

Chkrootkit is also another free, open source rootkit detector that locally checks for signs of a rootkit on a Unix-like systems. It helps to detect hidden security holes. The chkrootkit package consists of a shell script that checks system binaries for rootkit modification and a number of programs that check various security issues.

The chkrootkit tool can be installed using following command on Debian-based systems.

$ sudo apt install chkrootkit

On CentOS-based systems, you need to install it from sources using following commands.

# yum update
# yum install wget gcc-c++ glibc-static
# wget -c ftp://ftp.pangeia.com.br/pub/seg/pac/chkrootkit.tar.gz
# tar –xzf chkrootkit.tar.gz
# mkdir /usr/local/chkrootkit
# mv chkrootkit-0.52/* /usr/local/chkrootkit
# cd /usr/local/chkrootkit
# make sense

To check your server with Chkrootkit run the following command.

$ sudo chkrootkit 
OR
# /usr/local/chkrootkit/chkrootkit

Once run, it will start checking your system for known Malwares and Rootkits and after the process is finished, you can see the summary of report.

To make run Chkrootkit automatically at every night, add the following cron entry, which will run at 3am night and send reports to your email address.

0 3 * * * /usr/sbin/chkrootkit 2>&1 | mail -s "chkrootkit Reports of My Server" you@yourdomain.com

Rkhunter – A Linux Rootkit Scanners

RKH (RootKit Hunter) is a free, open source, powerful, simple to use and well known tool for scanning backdoors, rootkits and local exploits on POSIX compliant systems such as Linux. As the name implies, it is a rootkit hunter, security monitoring and analyzing tool that is thoroughly inspects a system to detect hidden security holes.

The rkhunter tool can be installed using following command on Ubuntu and CentOS based systems.

$ sudo apt install rkhunter
# yum install epel-release
# yum install rkhunter

To check your server with rkhunter run the following command.

# rkhunter -c

To make run rkhunter automatically at every night, add the following cron entry, which will run at 3am night and send reports to your email address.

0 3 * * * /usr/sbin/rkhunter -c 2>&1 | mail -s "rkhunter Reports of My Server" you@yourdomain.com

4. ClamAV – Antivirus Software Toolkit

ClamAV is an open source, versatile, popular and cross-platform antivirus engine to detect viruses, malware, trojans and other malicious programs on a computer. It is one of the best free anti-virus programs for Linux and the open source standard for mail gateway scanning software that supports almost all mail file formats.

It supports virus database updates on all systems and on-access scanning on Linux only. In addition, it can scan within archives and compressed files and supports formats such as Zip, Tar, 7Zip, Rar among others and more other features.

The ClamAV can be installed using following command on Debian-based systems.

$ sudo apt-get install clamav

The ClamAV can be installed using following command on CentOS-based systems.

# yum -y update
# yum -y install clamav

Once installed, you can update the signatures and scan a directory with the following commands.

# freshclam
# clamscan -r -i DIRECTORY

Where DIRECTORY is the location to scan. The options -r, means recursively scan and the -i means to only show infected files.

5. LMD – Linux Malware Detect

LMD (Linux Malware Detect) is an open source, powerful and fully-featured malware scanner for Linux specifically designed and targeted at shared hosted environments, but can be used to detect threats on any Linux system. It can be integrated with ClamAV scanner engine for better performance.

It provides a full reporting system to view current and previous scan results, supports e-mail alert reporting after every scan execution and many other useful features.

For LMD installation and usage, read our article How to Install and Use Linux Malware Detect (LMD) with ClamAV as Antivirus Engine.

That’s all for now! In this article, we shared a list of 5 tools to scan a Linux server for malware and rootkits. Let us know of your thoughts in the comments section.

Source

WP2Social Auto Publish Powered By : XYZScripts.com