Splunk is a powerful, robust and fully integrated software for real-time enterprise log management to collection, store, search, diagnose and report any log and machine generated data, including structured, unstructured and complex multi-line application logs.
It allows you to collect, store, index, search, correlate, visualize, analyze and report on any log data or machine-generated data quickly and in a repeatable manner, to identify and resolve operational and security issues.
In addition, splunk supports a wide range of log management use cases such as log consolidation and retention, security, IT operations troubleshooting, application troubleshooting as well as compliance reporting and so much more.
Splunk Features:
- It’s easily scalable and fully integrated.
- Supports both local and remote data sources.
- Allows for indexing machine data.
- Supports searching and correlating any data.
- Allows you to drill down and up and pivot across data.
- Supports monitoring and alerting.
- Also supports reports and dashboards for visualization.
- Provides flexible access to relational databases, field delimited data in comma-separated value (.CSV) files or to other enterprise data stores such as Hadoop or NoSQL.
- Supports a wide range of log management use cases and much more.
In this article, we will show how to install the latest version of Splunk log analyzer and how to add a log file (data source) and search through it for events in CentOS 7 (also works on RHEL distribution).
Recommended System Requirements:
- A CentOS 7 Server or RHEL 7 Server with Minimal Install.
- Minimum 12GB RAM
Test Environment:
- Linode VPS with CentOS 7 minimal install.
Install Splunk Log Analyzer to Monitor CentOS 7 Logs
1. Go to the splunk website, create an account and grab the latest available version for your system from the Splunk Enterprise download page. RPM packages are available for Red Hat, CentOS, and similar versions of Linux.
Alternatively, you can download it directly via the web browser or get the download link, and use wget commandv to grab the package via the command line as shown.
# wget -O splunk-7.1.2-a0c72a66db66-linux-2.6-x86_64.rpm 'https://www.splunk.com/bin/splunk/DownloadActivityServlet?architecture=x86_64&platform=linux&version=7.1.2&product=splunk&filename=splunk-7.1.2-a0c72a66db66-linux-2.6-x86_64.rpm&wget=true'
2. Once you have downloaded the package, install the Splunk Enterprise RPM in the default directory /opt/splunk using the RPM package manager as shown.
# rpm -i splunk-7.1.2-a0c72a66db66-linux-2.6-x86_64.rpm

warning: splunk-7.1.2-a0c72a66db66-linux-2.6-x86_64.rpm: Header V4 DSA/SHA1 Signature, key ID 653fb112: NOKEY
useradd: cannot create directory /opt/splunk
complete
3. Next, use the Splunk Enterprise command-line interface (CLI) to start the service.
# /opt/splunk/bin/./splunk start
Read through the SPLUNK SOFTWARE LICENSE AGREEMENT by pressing Enter. Once you have completed reading it, you will be asked Do you agree with this license? Enter Y to continue.
Do you agree with this license? [y/n]: y
Then create credentials for the administrator account, your password must contain at least 8 total printable ASCII character(s).
Create credentials for the administrator account.
Characters do not appear on the screen when you type the password.
Password must contain at least:
   * 8 total printable ASCII character(s).
Please enter a new password:
Please confirm new password:
4. If all installed files are intact and all preliminary checks passed, the splunk server daemon (splunkd) will be started, a 2048 bit RSA private key will be generated and you can be able to access the splunk web interface.
All preliminary checks passed.

Starting splunk server daemon (splunkd)...
Generating a 2048 bit RSA private key
......................+++
.....+++
writing new private key to 'privKeySecure.pem'
-----
Signature ok
subject=/CN=tecmint/O=SplunkUser
Getting CA Private Key
writing RSA key
Done
                                                           [  OK  ]

Waiting for web server at http://127.0.0.1:8000 to be available............. Done


If you get stuck, we're here to help.
Look for answers here: http://docs.splunk.com

The Splunk web interface is at http://tecmint:8000
5. Next, open port 8000 which Splunk server listens on, in your firewall using the firewall-cmd.
# firewall-cmd --add-port=8000/tcp --permanent
# firewall-cmd --reload
6. Open a web browser and type the following URL to access the splunk web interface.
http://SERVER_IP:8000
To login, use Username: admin and the password you created during the installation process.
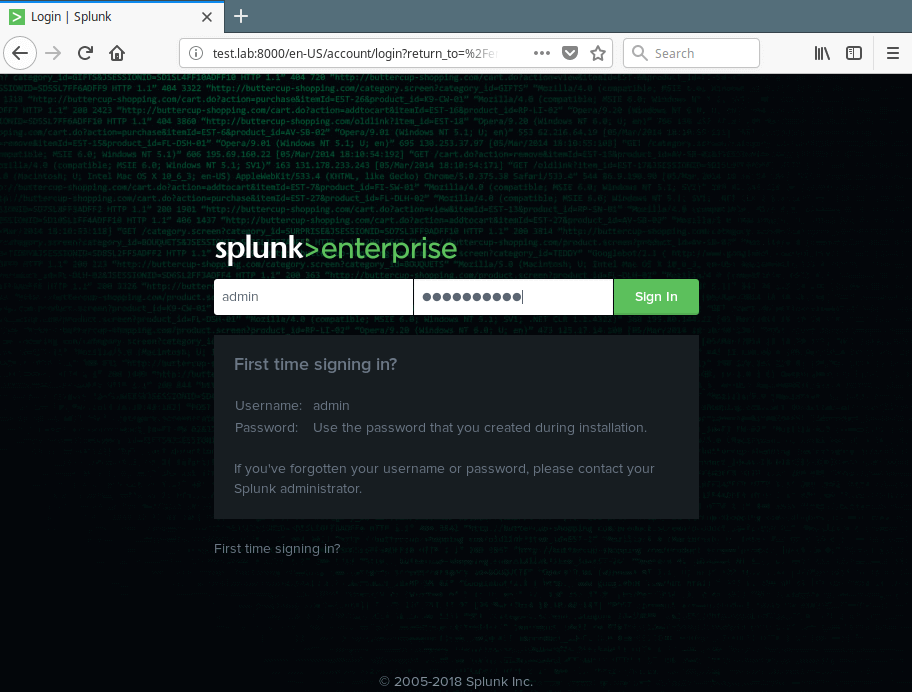
Splunk Login Page
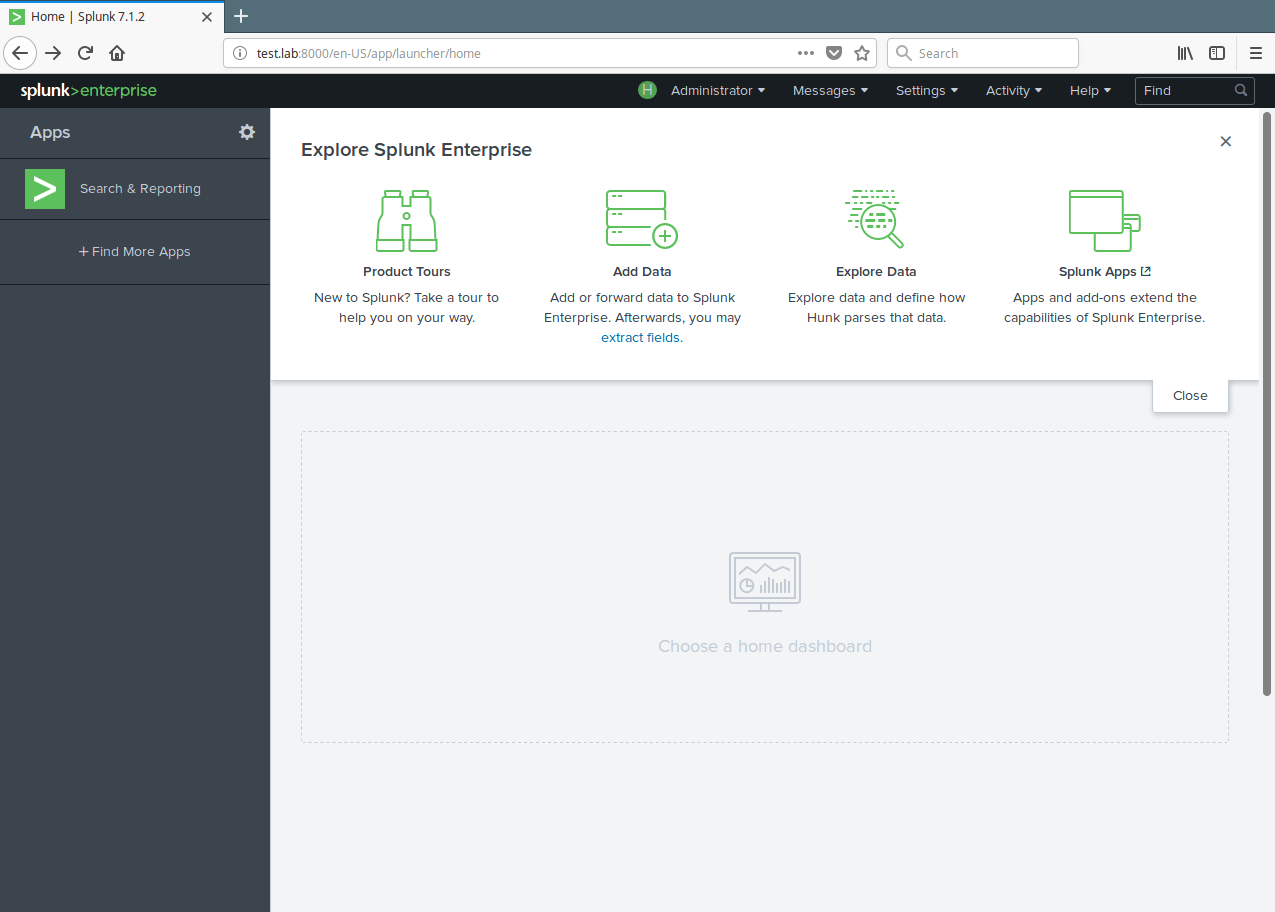
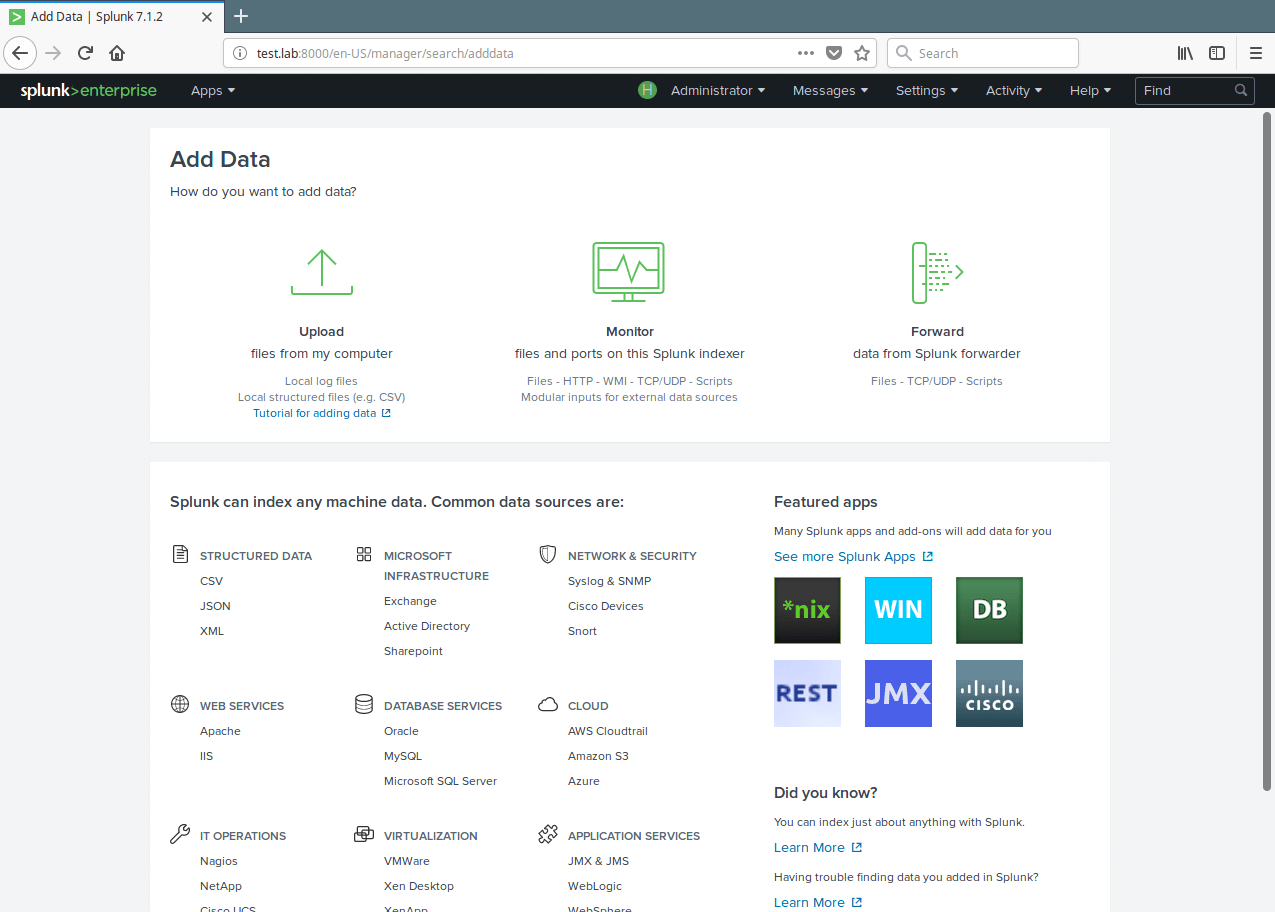
7. After a successful login, you will land in the splunk admin console shown in the following screenshot. To monitor a log file, for example /var/log/secure, click on Add Data.
Splunk Add Data
8. Then click on Monitor to add data from a file.
Splunk Monitor Data File
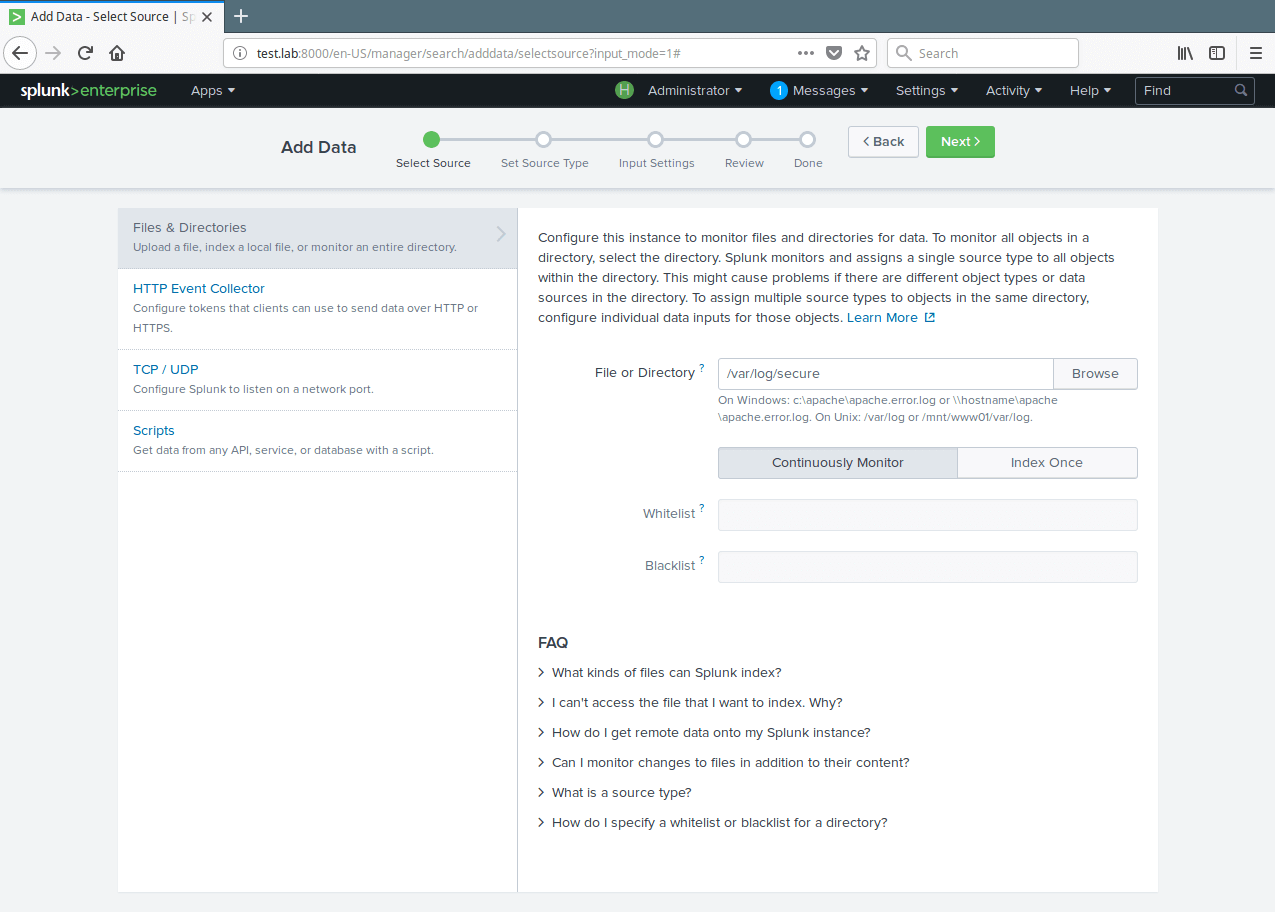
9. From the next interface, choose Files & Directories.
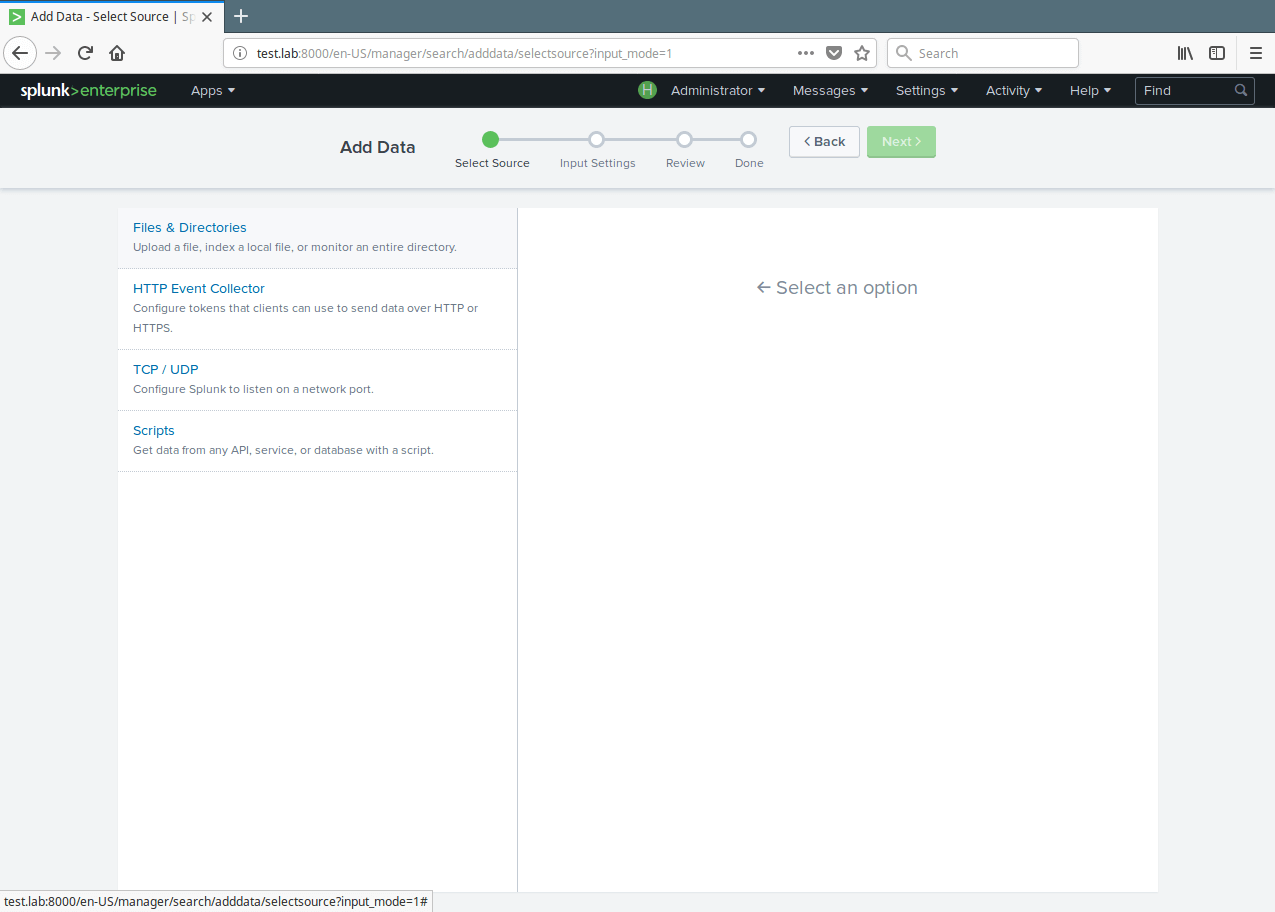
Select Splunk File and Directories
10. Then setup the instance to monitor files and directories for data. To monitor all objects in a directory, select the directory. To monitor a single file, select it. Click on Browse to select the data source.
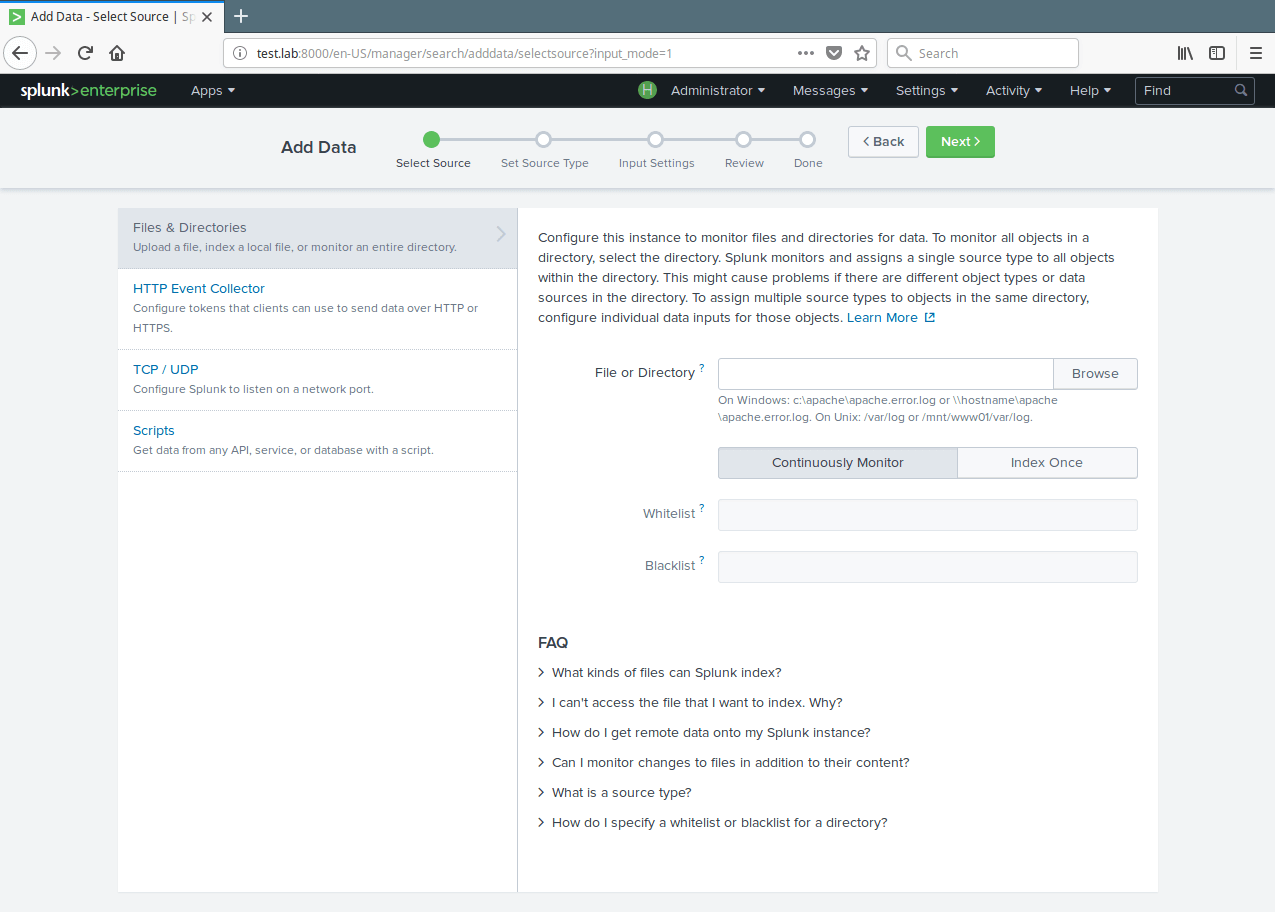
Select Splunk Instance to Monitor
11. A list of directories in your root(/) directory will be shown to you, navigate to the log file you want to monitor (/var/log/secure) and click Select.
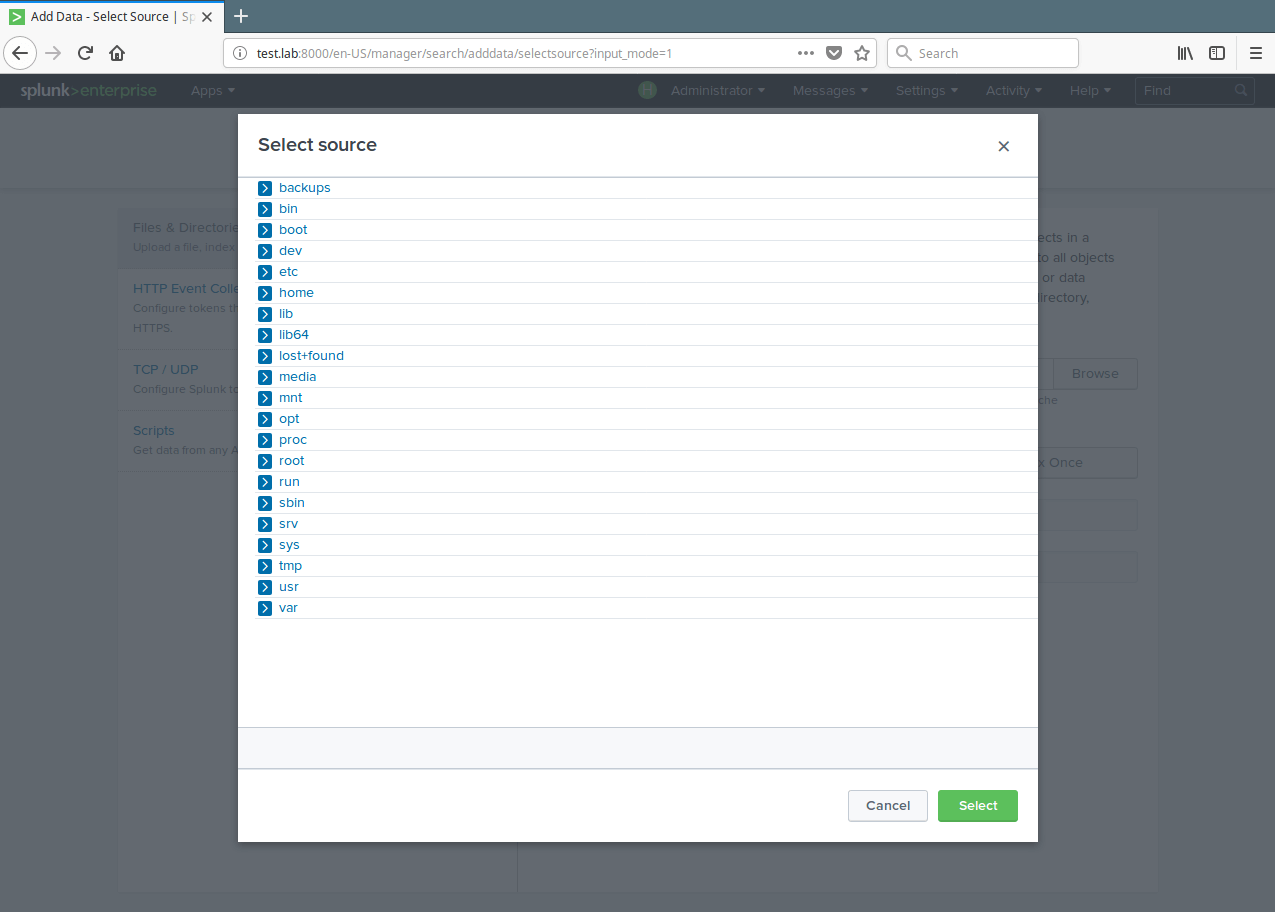
Select Monitor Data Source
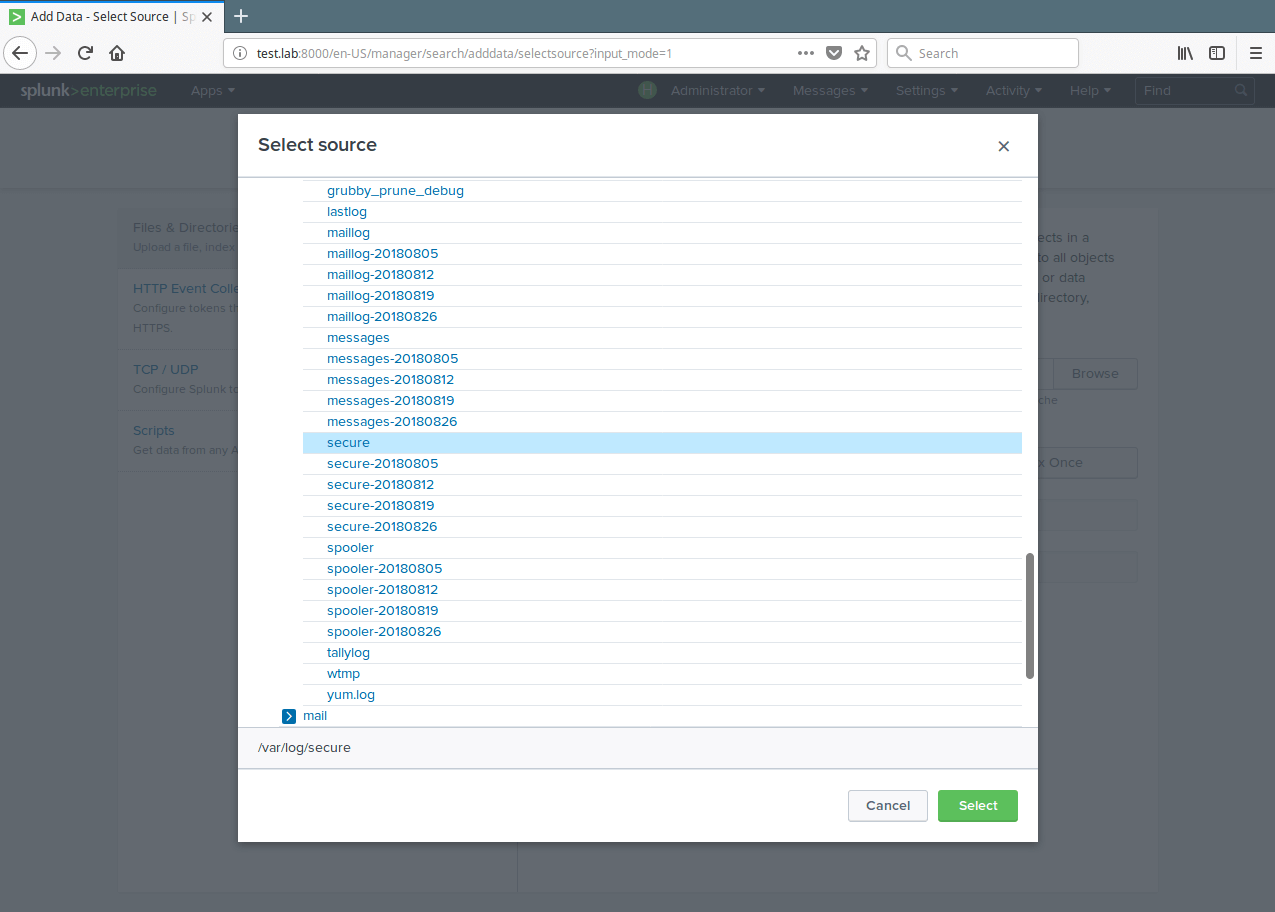
Select Monitor Data File
12. After selecting the data source, select Continuously Monitor to watch that log file and click on Next to set source type.
Set Monitor Data Source Settings
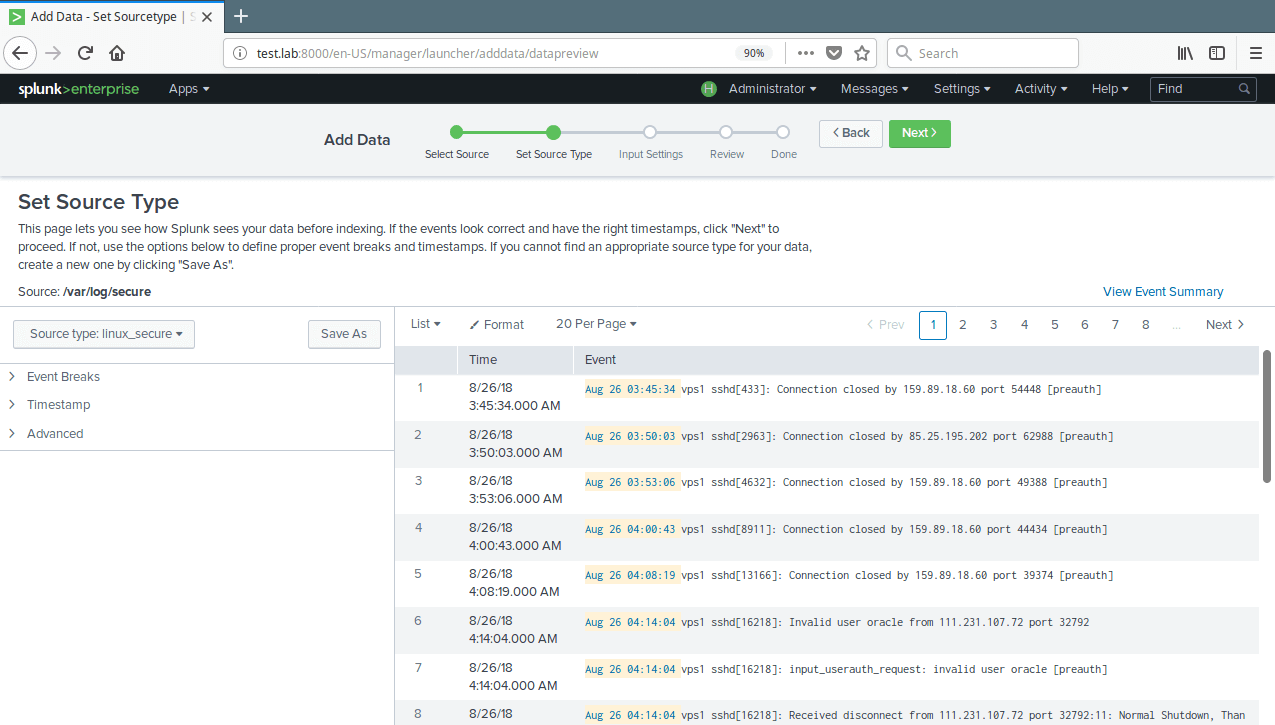
13. Next, set source type for your data source. For our test log file (/var/log/secure), we need to select Operating System→linux_secure; this lets splunk know that the file contains security related messages from a Linux system. Then click Next to proceed.
Set Data Source Type
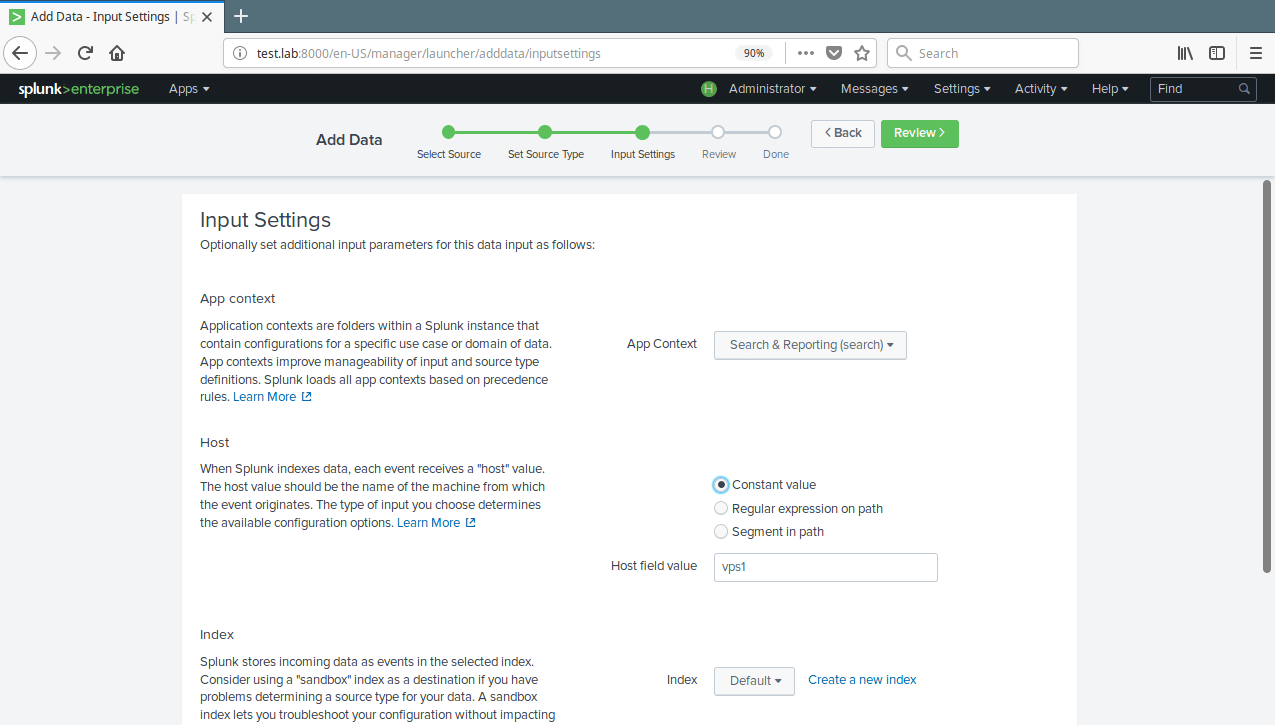
14. You can optionally set additional input parameters for this data input. Under App context, select Search & Reporting. Then click Review. After reviewing, click Submit.
Set Additional Input Settings
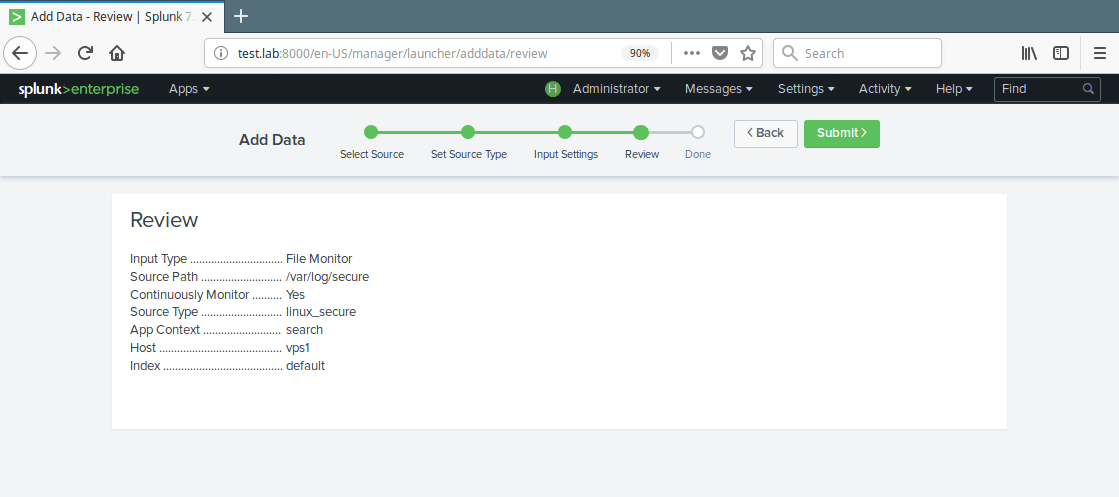
Review Data Source Settings
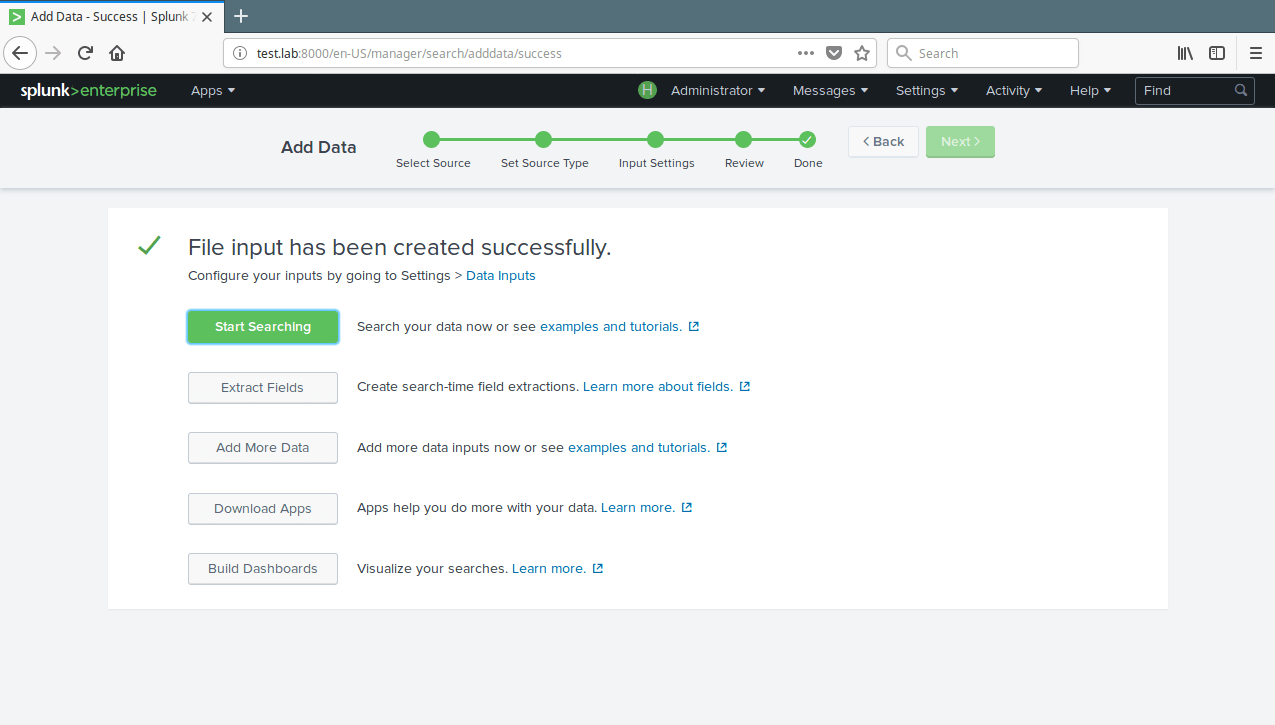
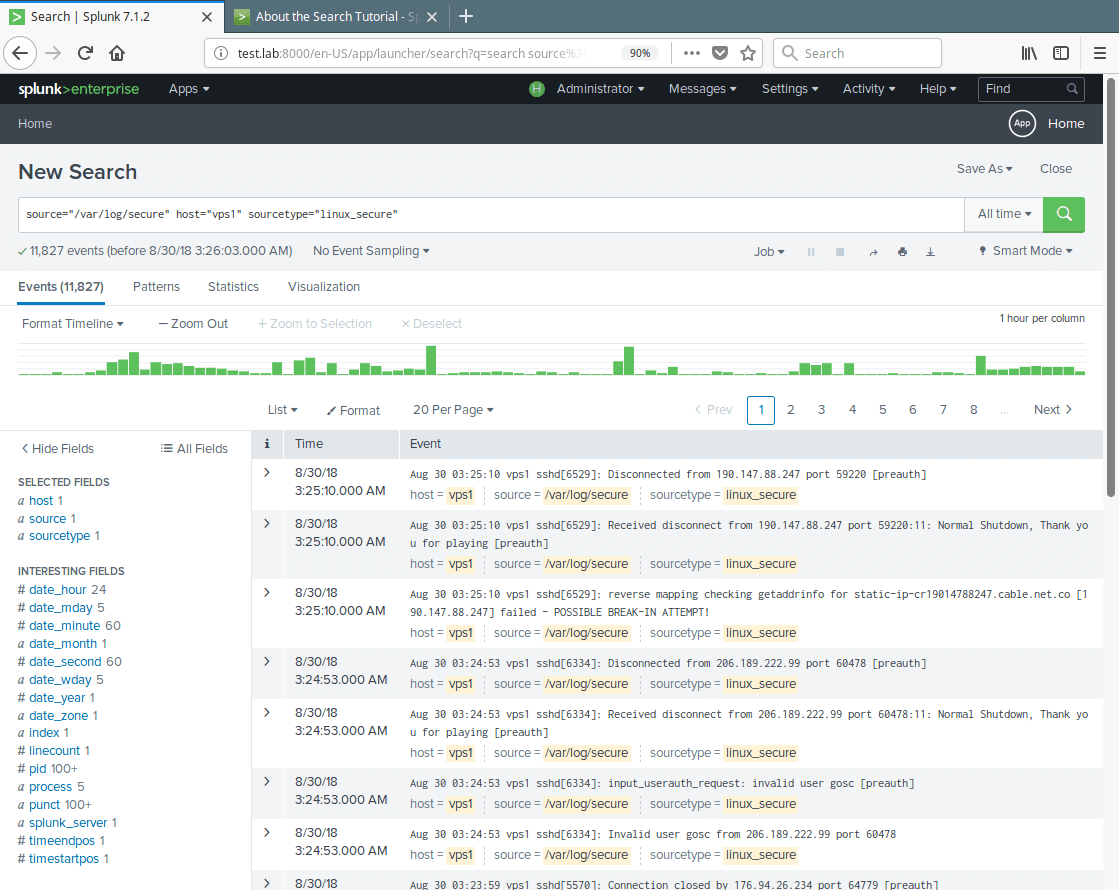
15. Now your file input has been created successfully. Click on Start Searching to search your data.
Start Searching Data
Monitor Data Source Reports
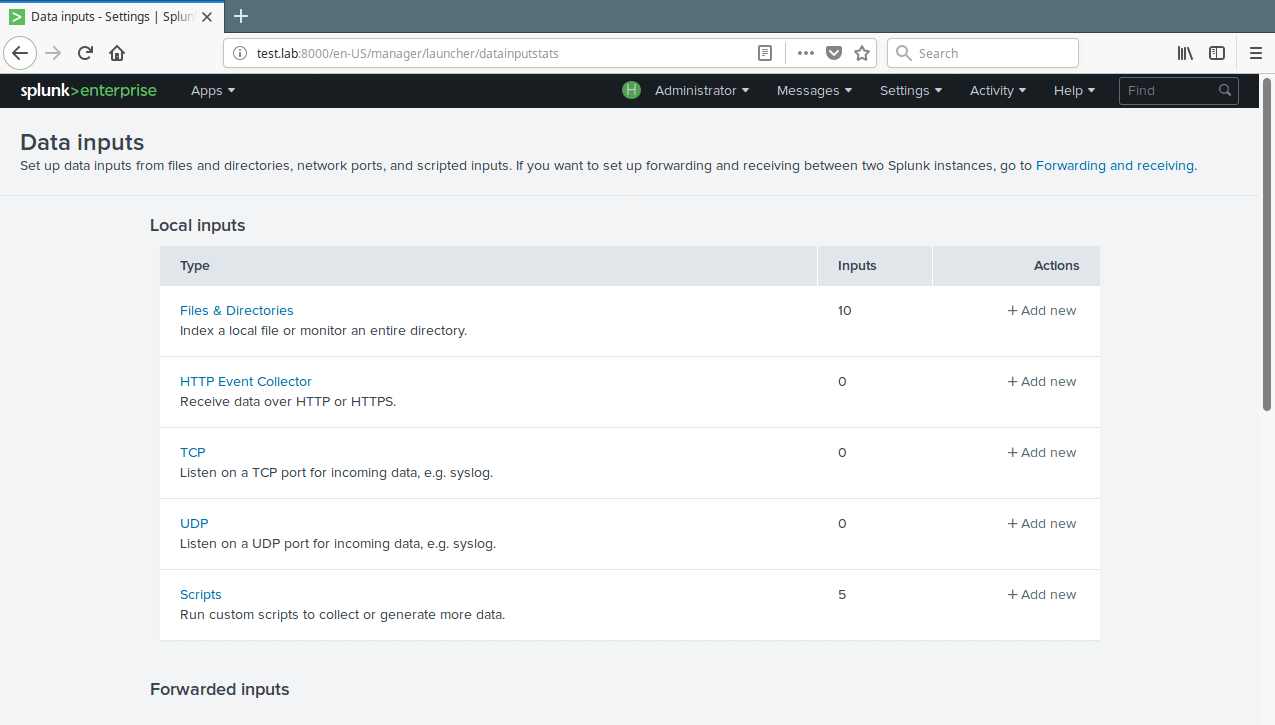
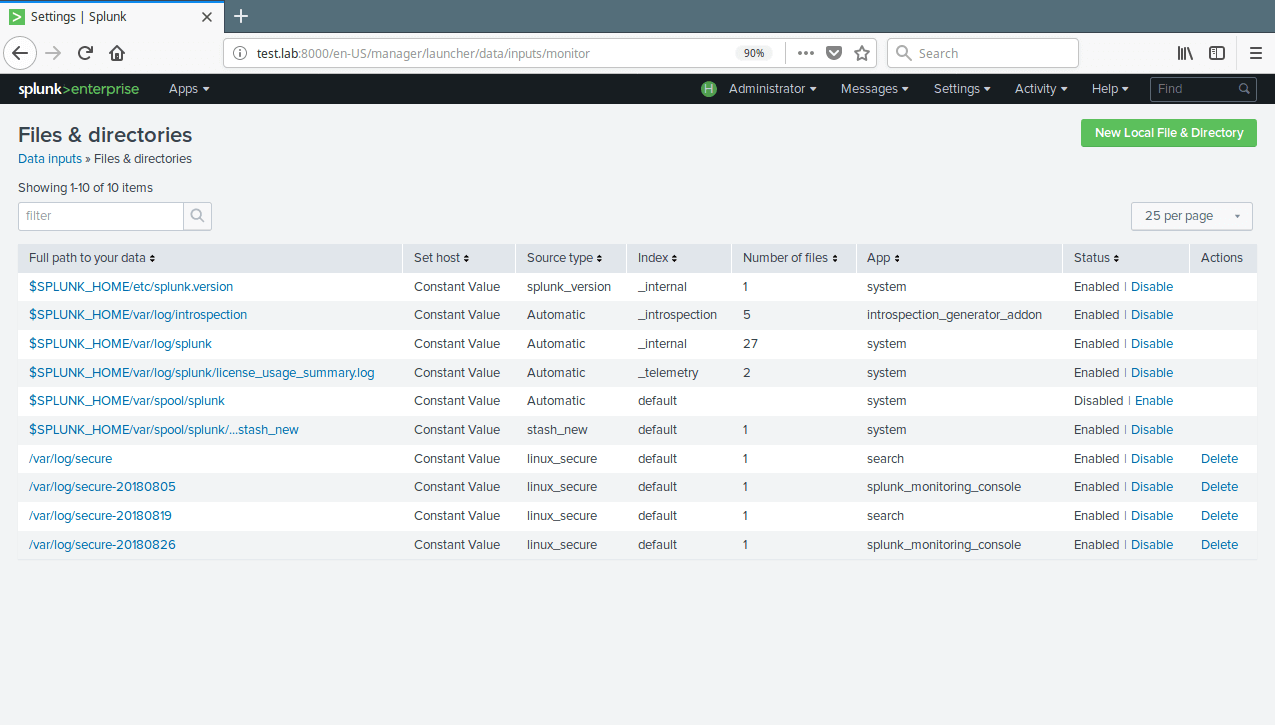
16. To view all your data inputs, go to Settings→Data→Data Inputs. Then click on the type you want to view for example Files & Directories.
Splunk Data Inputs
View All Data Inputs
17. The following are additional commands to manage (restart or stop) the splunk daemon.
# /opt/splunk/bin/./splunk restart
# /opt/splunk/bin/./splunk stop
From now on, you can add more data sources (local or remote using Splunk Forwarder), explore your data and/or install Splunk apps for enhancing its default functionality. You can do more by reading the splunk documentation provided at the official website.
Splunk Homepage: https://www.splunk.com/
That’s it for now! Splunk is a powerful, robust and fully integrated, real-time enterprise log management software. In this article, we showed how to install the latest version of Splunk log analyzer on CentOS 7. If you have any questions or thoughts to share, use the comment form below to reach us.
Source