RAID is a Redundant Array of Inexpensive disks, but nowadays it is called Redundant Array of Independent drives. Earlier it is used to be very costly to buy even a smaller size of disk, but nowadays we can buy a large size of disk with the same amount like before. Raid is just a collection of disks in a pool to become a logical volume.

Understanding RAID Setups in Linux
Raid contains groups or sets or Arrays. A combine of drivers make a group of disks to form a RAID Array or RAID set. It can be a minimum of 2 number of disk connected to a raid controller and make a logical volume or more drives can be in a group. Only one Raid level can be applied in a group of disks. Raid are used when we need excellent performance. According to our selected raid level, performance will differ. Saving our data by fault tolerance & high availability.
This series will be titled Preparation for the setting up RAID ‘s through Parts 1-9 and covers the following topics.
Part 1: Introduction to RAID, Concepts of RAID and RAID Levels
Part 2: How to setup RAID0 (Stripe) in Linux
Part 3: How to setup RAID1 (Mirror) in Linux
Part 4: How to setup RAID5 (Striping with Distributed Parity) in Linux
Part 5: How to setup RAID6 (Striping with Double Distributed Parity) in Linux
Part 6: Setting Up RAID 10 or 1+0 (Nested) in Linux
Part 7: Growing an Existing RAID Array and Removing Failed Disks in Raid
Part 8: How to Recover Data and Rebuild Failed Software RAID’s
Part 9: How to Manage Software RAID’s in Linux with ‘Mdadm’ Tool
This is the Part 1 of a 9-tutorial series, here we will cover the introduction of RAID, Concepts of RAID and RAID Levels that are required for the setting up RAID in Linux.
Software RAID and Hardware RAID
Software RAID have low performance, because of consuming resource from hosts. Raid software need to load for read data from software raid volumes. Before loading raid software, OS need to get boot to load the raid software. No need of Physical hardware in software raids. Zero cost investment.
Hardware RAID have high performance. They are dedicated RAID Controller which is Physically built using PCI express cards. It won’t use the host resource. They have NVRAM for cache to read and write. Stores cache while rebuild even if there is power-failure, it will store the cache using battery power backups. Very costly investments needed for a large scale.
Hardware RAID Card will look like below:
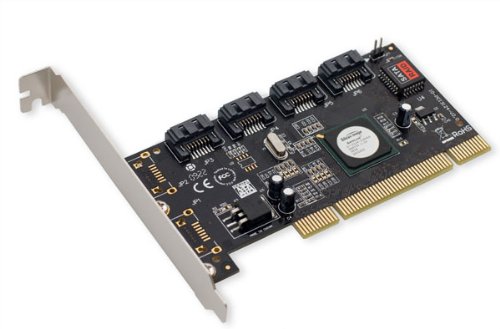
Hardware RAID
Featured Concepts of RAID
- Parity method in raid regenerate the lost content from parity saved information’s. RAID 5, RAID 6 Based on Parity.
- Stripe is sharing data randomly to multiple disk. This won’t have full data in a single disk. If we use 3 disks half of our data will be in each disks.
- Mirroring is used in RAID 1 and RAID 10. Mirroring is making a copy of same data. In RAID 1 it will save the same content to the other disk too.
- Hot spare is just a spare drive in our server which can automatically replace the failed drives. If any one of the drive failed in our array this hot spare drive will be used and rebuild automatically.
- Chunks are just a size of data which can be minimum from 4KB and more. By defining chunk size we can increase the I/O performance.
RAID’s are in various Levels. Here we will see only the RAID Levels which is used mostly in real environment.
- RAID0 = Striping
- RAID1 = Mirroring
- RAID5 = Single Disk Distributed Parity
- RAID6 = Double Disk Distributed Parity
- RAID10 = Combine of Mirror & Stripe. (Nested RAID)
RAID are managed using mdadm package in most of the Linux distributions. Let us get a Brief look into each RAID Levels.
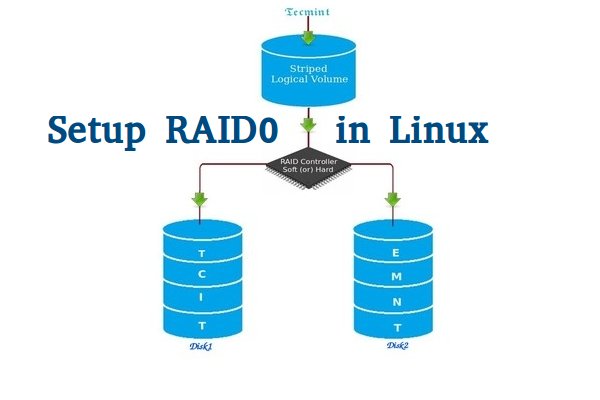
RAID 0 (or) Striping
Striping have a excellent performance. In Raid 0 (Striping) the data will be written to disk using shared method. Half of the content will be in one disk and another half will be written to other disk.
Let us assume we have 2 Disk drives, for example, if we write data “TECMINT” to logical volume it will be saved as ‘T‘ will be saved in first disk and ‘E‘ will be saved in Second disk and ‘C‘ will be saved in First disk and again ‘M‘ will be saved in Second disk and it continues in round-robin process.
In this situation if any one of the drive fails we will loose our data, because with half of data from one of the disk can’t use to rebuilt the raid. But while comparing to Write Speed and performance RAID 0 is Excellent. We need at least minimum 2 disks to create a RAID 0 (Striping). If you need your valuable data don’t use this RAID LEVEL.
- High Performance.
- There is Zero Capacity Loss in RAID 0
- Zero Fault Tolerance.
- Write and Reading will be good performance.
RAID 1 (or) Mirroring
Mirroring have a good performance. Mirroring can make a copy of same data what we have. Assuming we have two numbers of 2TB Hard drives, total there we have 4TB, but in mirroring while the drives are behind the RAID Controller to form a Logical drive Only we can see the 2TB of logical drive.
While we save any data, it will write to both 2TB Drives. Minimum two drives are needed to create a RAID 1 or Mirror. If a disk failure occurred we can reproduce the raid set by replacing a new disk. If any one of the disk fails in RAID 1, we can get the data from other one as there was a copy of same content in the other disk. So there is zero data loss.
- Good Performance.
- Here Half of the Space will be lost in total capacity.
- Full Fault Tolerance.
- Rebuilt will be faster.
- Writing Performance will be slow.
- Reading will be good.
- Can be used for operating systems and database for small scale.
RAID 5 (or) Distributed Parity
RAID 5 is mostly used in enterprise levels. RAID 5 work by distributed parity method. Parity info will be used to rebuild the data. It rebuilds from the information left on the remaining good drives. This will protect our data from drive failure.
Assume we have 4 drives, if one drive fails and while we replace the failed drive we can rebuild the replaced drive from parity informations. Parity information’s are Stored in all 4 drives, if we have 4 numbers of 1TB hard-drive. The parity information will be stored in 256GB in each drivers and other 768GB in each drives will be defined for Users. RAID 5 can be survive from a single Drive failure, If drives fails more than 1 will cause loss of data’s.
- Excellent Performance
- Reading will be extremely very good in speed.
- Writing will be Average, slow if we won’t use a Hardware RAID Controller.
- Rebuild from Parity information from all drives.
- Full Fault Tolerance.
- 1 Disk Space will be under Parity.
- Can be used in file servers, web servers, very important backups.
RAID 6 Two Parity Distributed Disk
RAID 6 is same as RAID 5 with two parity distributed system. Mostly used in a large number of arrays. We need minimum 4 Drives, even if there 2 Drive fails we can rebuild the data while replacing new drives.
Very slower than RAID 5, because it writes data to all 4 drivers at same time. Will be average in speed while we using a Hardware RAID Controller. If we have 6 numbers of 1TB hard-drives 4 drives will be used for data and 2 drives will be used for Parity.
- Poor Performance.
- Read Performance will be good.
- Write Performance will be Poor if we not using a Hardware RAID Controller.
- Rebuild from 2 Parity Drives.
- Full Fault tolerance.
- 2 Disks space will be under Parity.
- Can be Used in Large Arrays.
- Can be use in backup purpose, video streaming, used in large scale.
RAID 10 (or) Mirror & Stripe
RAID 10 can be called as 1+0 or 0+1. This will do both works of Mirror & Striping. Mirror will be first and stripe will be the second in RAID 10. Stripe will be the first and mirror will be the second in RAID 01. RAID 10 is better comparing to 01.
Assume, we have 4 Number of drives. While I’m writing some data to my logical volume it will be saved under All 4 drives using mirror and stripe methods.
If I’m writing a data “TECMINT” in RAID 10 it will save the data as follow. First “T” will write to both disks and second “E” will write to both disk, this step will be used for all data write. It will make a copy of every data to other disk too.
Same time it will use the RAID 0 method and write data as follow “T” will write to first disk and “E” will write to second disk. Again “C” will write to first Disk and “M” to second disk.
- Good read and write performance.
- Here Half of the Space will be lost in total capacity.
- Fault Tolerance.
- Fast rebuild from copying data.
- Can be used in Database storage for high performance and availability.
Conclusion
In this article we have seen what is RAID and which levels are mostly used in RAID in real environment. Hope you have learned the write-up about RAID. For RAID setup one must know about the basic Knowledge about RAID. The above content will fulfil basic understanding about RAID.
In the next upcoming articles I’m going to cover how to setup and create a RAID using Various Levels, Growing a RAID Group (Array) and Troubleshooting with failed Drives and much more.
Creating Software RAID0 (Stripe) on ‘Two Devices’ Using ‘mdadm’ Tool in Linux – Part 2
RAID is Redundant Array of Inexpensive disks, used for high availability and reliability in large scale environments, where data need to be protected than normal use. Raid is just a collection of disks in a pool to become a logical volume and contains an array. A combine drivers makes an array or called as set of (group).
RAID can be created, if there are minimum 2 number of disk connected to a raid controller and make a logical volume or more drives can be added in an array according to defined RAID Levels. Software Raid are available without using Physical hardware those are called as software raid. Software Raid will be named as Poor man raid.
Setup RAID0 in Linux
Main concept of using RAID is to save data from Single point of failure, means if we using a single disk to store the data and if it’s failed, then there is no chance of getting our data back, to stop the data loss we need a fault tolerance method. So, that we can use some collection of disk to form a RAID set.
What is Stripe in RAID 0?
Stripe is striping data across multiple disk at the same time by dividing the contents. Assume we have two disks and if we save content to logical volume it will be saved under both two physical disks by dividing the content. For better performance RAID 0 will be used, but we can’t get the data if one of the drive fails. So, it isn’t a good practice to use RAID 0. The only solution is to install operating system with RAID0 applied logical volumes to safe your important files.
- RAID 0 has High Performance.
- Zero Capacity Loss in RAID 0. No Space will be wasted.
- Zero Fault Tolerance ( Can’t get back the data if any one of disk fails).
- Write and Reading will be Excellent.
Requirements
Minimum number of disks are allowed to create RAID 0 is 2, but you can add more disk but the order should be twice as 2, 4, 6, 8. If you have a Physical RAID card with enough ports, you can add more disks.
Here we are not using a Hardware raid, this setup depends only on Software RAID. If we have a physical hardware raid card we can access it from it’s utility UI. Some motherboard by default in-build with RAID feature, there UI can be accessed using Ctrl+I keys.
If you’re new to RAID setups, please read our earlier article, where we’ve covered some basic introduction of about RAID.
- Introduction to RAID and RAID Concepts
My Server Setup
Operating System :	CentOS 6.5 Final
IP Address	 :	192.168.0.225
Two Disks	 :	20 GB each
This article is Part 2 of a 9-tutorial RAID series, here in this part, we are going to see how we can create and setup Software RAID0 or striping in Linux systems or servers using two 20GB disks named sdb and sdc.
Step 1: Updating System and Installing mdadm for Managing RAID
1. Before setting up RAID0 in Linux, let’s do a system update and then install ‘mdadm‘ package. The mdadm is a small program, which will allow us to configure and manage RAID devices in Linux.
# yum clean all && yum update
# yum install mdadm -y
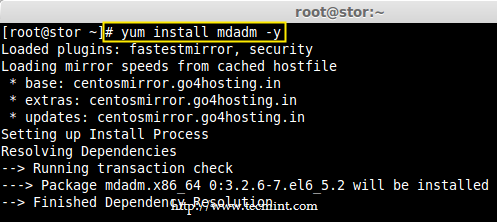
Install mdadm Tool
Step 2: Verify Attached Two 20GB Drives
2. Before creating RAID 0, make sure to verify that the attached two hard drives are detected or not, using the following command.
# ls -l /dev | grep sd
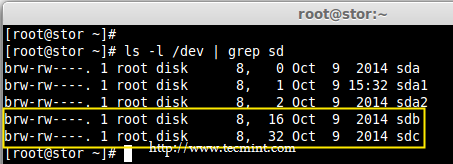
Check Hard Drives
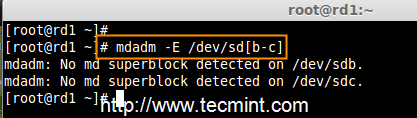
3. Once the new hard drives detected, it’s time to check whether the attached drives are already using any existing raid with the help of following ‘mdadm’ command.
# mdadm --examine /dev/sd[b-c]
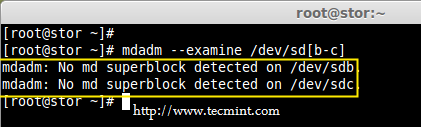
Check RAID Devices
In the above output, we come to know that none of the RAID have been applied to these two sdb and sdc drives.
Step 3: Creating Partitions for RAID
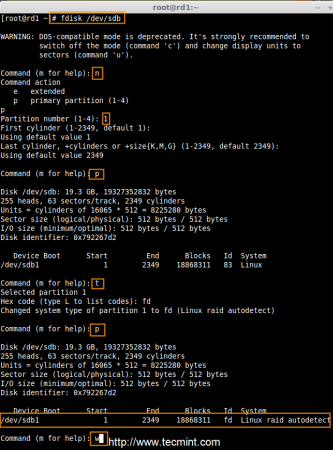
4. Now create sdb and sdc partitions for raid, with the help of following fdisk command. Here, I will show how to create partition on sdb drive.
# fdisk /dev/sdb
Follow below instructions for creating partitions.
- Press ‘n‘ for creating new partition.
- Then choose ‘P‘ for Primary partition.
- Next select the partition number as 1.
- Give the default value by just pressing two times Enter key.
- Next press ‘P‘ to print the defined partition.
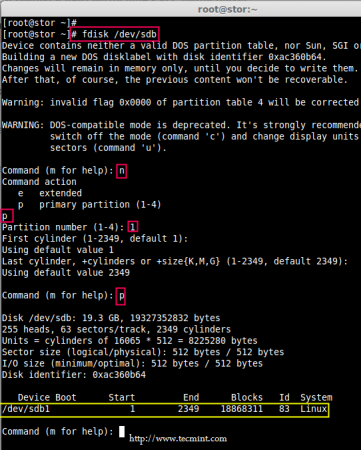
Create Partitions
Follow below instructions for creating Linux raid auto on partitions.
- Press ‘L‘ to list all available types.
- Type ‘t‘to choose the partitions.
- Choose ‘fd‘ for Linux raid auto and press Enter to apply.
- Then again use ‘P‘ to print the changes what we have made.
- Use ‘w‘ to write the changes.
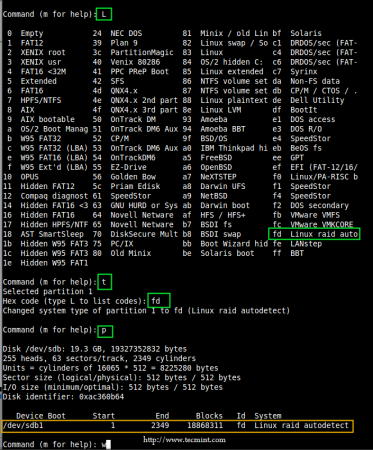
Create RAID Partitions in Linux
Note: Please follow same above instructions to create partition on sdc drive now.
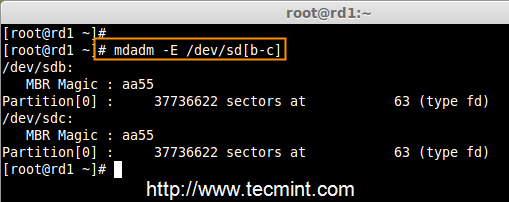
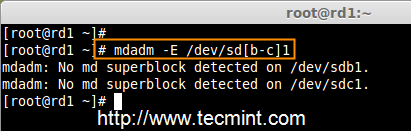
5. After creating partitions, verify both the drivers are correctly defined for RAID using following command.
# mdadm --examine /dev/sd[b-c]
# mdadm --examine /dev/sd[b-c]1
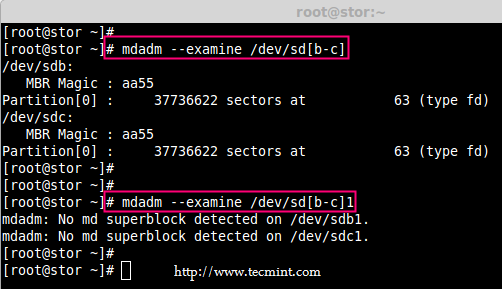
Verify RAID Partitions
Step 4: Creating RAID md Devices
6. Now create md device (i.e. /dev/md0) and apply raid level using below command.
# mdadm -C /dev/md0 -l raid0 -n 2 /dev/sd[b-c]1
# mdadm --create /dev/md0 --level=stripe --raid-devices=2 /dev/sd[b-c]1
- -C – create
- -l – level
- -n – No of raid-devices
7. Once md device has been created, now verify the status of RAID Level, Devices and Array used, with the help of following series of commands as shown.
# cat /proc/mdstat
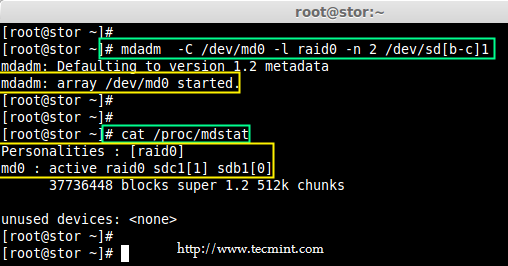
Verify RAID Level
# mdadm -E /dev/sd[b-c]1
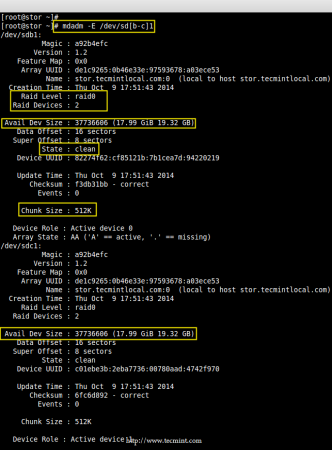
Verify RAID Device
# mdadm --detail /dev/md0
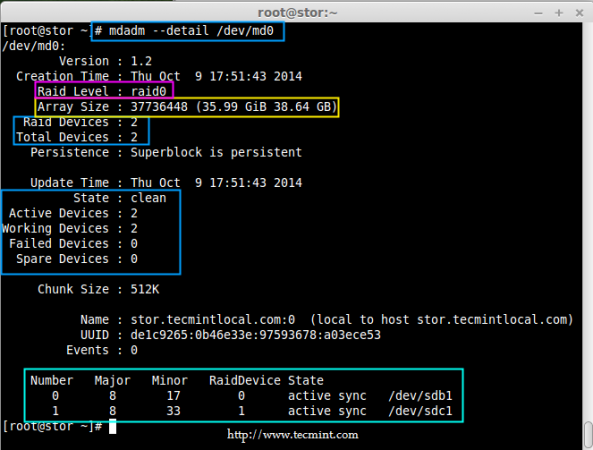
Verify RAID Array
Step 5: Assiging RAID Devices to Filesystem
8. Create a ext4 filesystem for a RAID device /dev/md0 and mount it under /dev/raid0.
# mkfs.ext4 /dev/md0
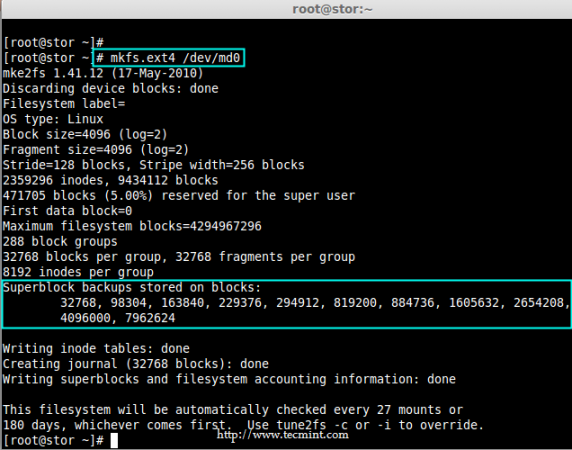
Create ext4 Filesystem
9. Once ext4 filesystem has been created for Raid device, now create a mount point directory (i.e. /mnt/raid0) and mount the device /dev/md0 under it.
# mkdir /mnt/raid0
# mount /dev/md0 /mnt/raid0/
10. Next, verify that the device /dev/md0 is mounted under /mnt/raid0 directory using df command.
# df -h
11. Next, create a file called ‘tecmint.txt‘ under the mount point /mnt/raid0, add some content to the created file and view the content of a file and directory.
# touch /mnt/raid0/tecmint.txt
# echo "Hi everyone how you doing ?" > /mnt/raid0/tecmint.txt
# cat /mnt/raid0/tecmint.txt
# ls -l /mnt/raid0/
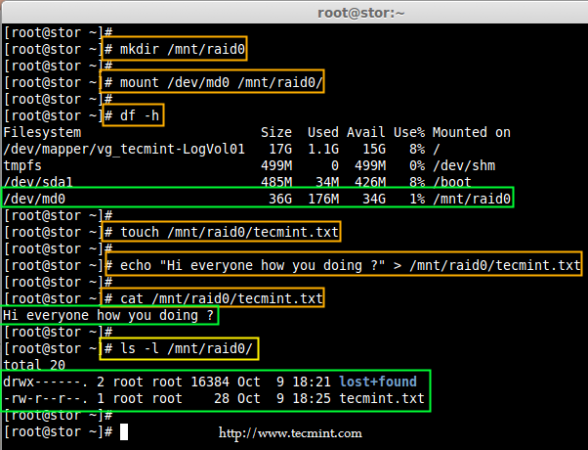
Verify Mount Device
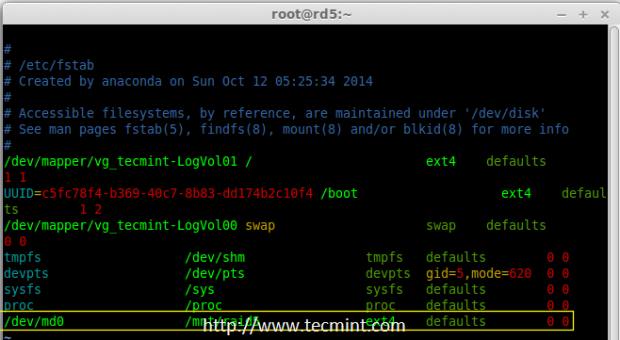
12. Once you’ve verified mount points, it’s time to create an fstab entry in /etc/fstab file.
# vim /etc/fstab
Add the following entry as described. May vary according to your mount location and filesystem you using.
/dev/md0 /mnt/raid0 ext4 defaults 0 0
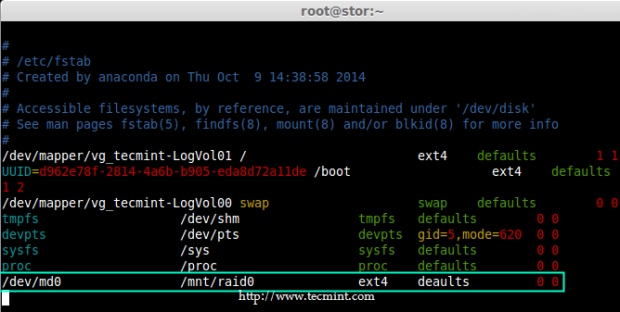
Add Device to Fstab
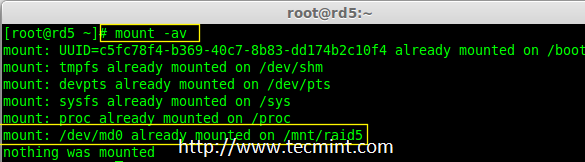
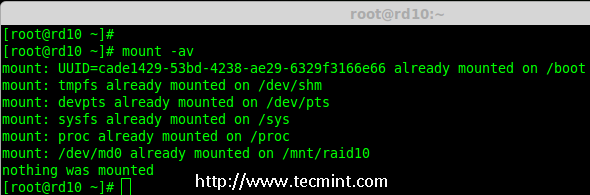
13. Run mount ‘-a‘ to check if there is any error in fstab entry.
# mount -av
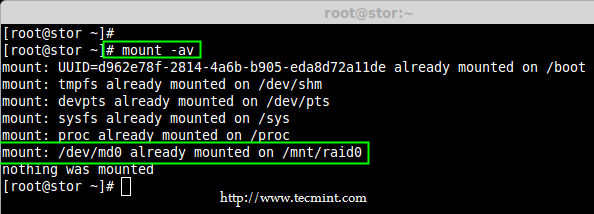
Check Errors in Fstab
Step 6: Saving RAID Configurations
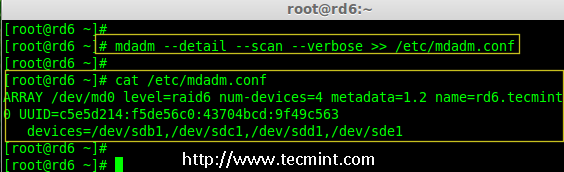
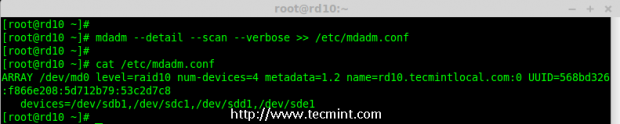
14. Finally, save the raid configuration to one of the file to keep the configurations for future use. Again we use ‘mdadm’ command with ‘-s‘ (scan) and ‘-v‘ (verbose) options as shown.
# mdadm -E -s -v >> /etc/mdadm.conf
# mdadm --detail --scan --verbose >> /etc/mdadm.conf
# cat /etc/mdadm.conf
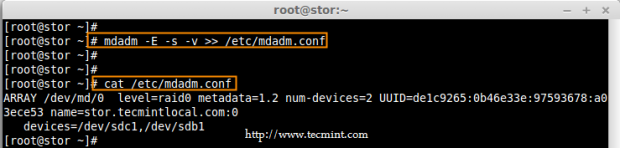
Save RAID Configurations
That’s it, we have seen here, how to configure RAID0 striping with raid levels by using two hard disks. In next article, we will see how to setup RAID5.
Setting up RAID 1 (Mirroring) using ‘Two Disks’ in Linux – Part 3
RAID Mirroring means an exact clone (or mirror) of the same data writing to two drives. A minimum two number of disks are more required in an array to create RAID1 and it’s useful only, when read performance or reliability is more precise than the data storage capacity.
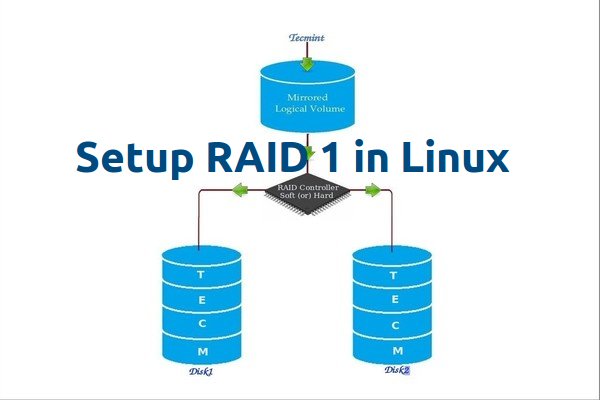
Setup Raid1 in Linux
Mirrors are created to protect against data loss due to disk failure. Each disk in a mirror involves an exact copy of the data. When one disk fails, the same data can be retrieved from other functioning disk. However, the failed drive can be replaced from the running computer without any user interruption.
Features of RAID 1
- Mirror has Good Performance.
- 50% of space will be lost. Means if we have two disk with 500GB size total, it will be 1TB but in Mirroring it will only show us 500GB.
- No data loss in Mirroring if one disk fails, because we have the same content in both disks.
- Reading will be good than writing data to drive.
Requirements
Minimum Two number of disks are allowed to create RAID 1, but you can add more disks by using twice as 2, 4, 6, 8. To add more disks, your system must have a RAID physical adapter (hardware card).
Here we’re using software raid not a Hardware raid, if your system has an inbuilt physical hardware raid card you can access it from it’s utility UI or using Ctrl+I key.
Read Also: Basic Concepts of RAID in Linux
My Server Setup
Operating System :	CentOS 6.5 Final
IP Address	 :	192.168.0.226
Hostname	 :	rd1.tecmintlocal.com
Disk 1 [20GB]	 :	/dev/sdb
Disk 2 [20GB]	 :	/dev/sdc
This article will guide you through a step-by-step instructions on how to setup a software RAID 1 or Mirror using mdadm (creates and manages raid) on Linux Platform. Although the same instructions also works on other Linux distributions such as RedHat, CentOS, Fedora, etc.
Step 1: Installing Prerequisites and Examine Drives
1. As I said above, we’re using mdadm utility for creating and managing RAID in Linux. So, let’s install the mdadm software package on Linux using yum or apt-get package manager tool.
# yum install mdadm		[on RedHat systems]
# apt-get install mdadm 	[on Debain systems]
2. Once ‘mdadm‘ package has been installed, we need to examine our disk drives whether there is already any raid configured using the following command.
# mdadm -E /dev/sd[b-c]
Check RAID on Disks
As you see from the above screen, that there is no any super-block detected yet, means no RAID defined.
Step 2: Drive Partitioning for RAID
3. As I mentioned above, that we’re using minimum two partitions /dev/sdb and /dev/sdc for creating RAID1. Let’s create partitions on these two drives using ‘fdisk‘ command and change the type to raid during partition creation.
# fdisk /dev/sdb
Follow the below instructions
- Press ‘n‘ for creating new partition.
- Then choose ‘P‘ for Primary partition.
- Next select the partition number as 1.
- Give the default full size by just pressing two times Enter key.
- Next press ‘p‘ to print the defined partition.
- Press ‘L‘ to list all available types.
- Type ‘t‘to choose the partitions.
- Choose ‘fd‘ for Linux raid auto and press Enter to apply.
- Then again use ‘p‘ to print the changes what we have made.
- Use ‘w‘ to write the changes.
Create Disk Partitions
After ‘/dev/sdb‘ partition has been created, next follow the same instructions to create new partition on /dev/sdc drive.
# fdisk /dev/sdc

Create Second Partitions
4. Once both the partitions are created successfully, verify the changes on both sdb & sdc drive using the same ‘mdadm‘ command and also confirm the RAID type as shown in the following screen grabs.
# mdadm -E /dev/sd[b-c]
Verify Partitions Changes
Check RAID Type
Note: As you see in the above picture, there is no any defined RAID on the sdb1 and sdc1 drives so far, that’s the reason we are getting as no super-blocks detected.
Step 3: Creating RAID1 Devices
5. Next create RAID1 Device called ‘/dev/md0‘ using the following command and verity it.
# mdadm --create /dev/md0 --level=mirror --raid-devices=2 /dev/sd[b-c]1
# cat /proc/mdstat
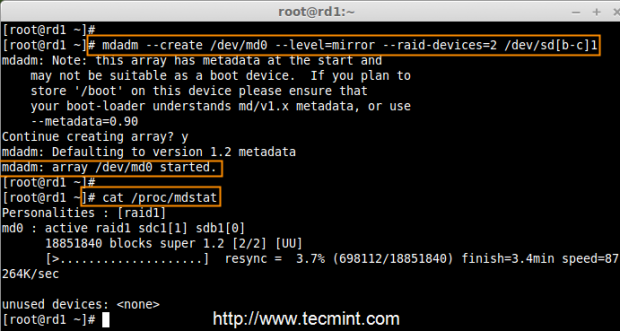
Create RAID Device
6. Next check the raid devices type and raid array using following commands.
# mdadm -E /dev/sd[b-c]1
# mdadm --detail /dev/md0
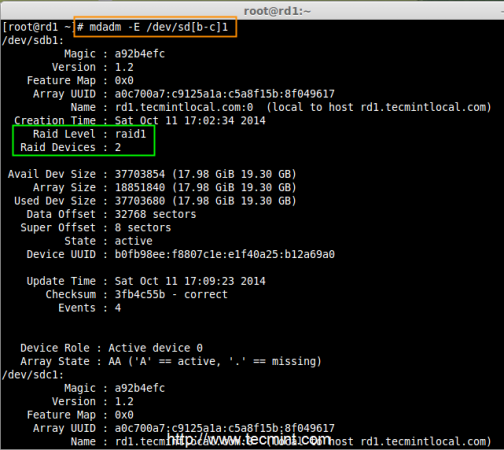
Check RAID Device type
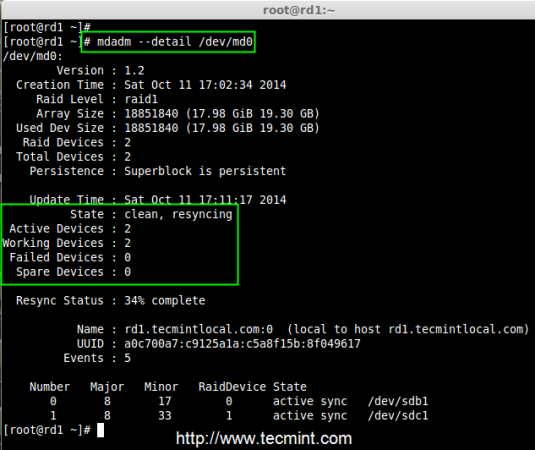
Check RAID Device Array
From the above pictures, one can easily understand that raid1 have been created and using /dev/sdb1 and /dev/sdc1 partitions and also you can see the status as resyncing.
Step 4: Creating File System on RAID Device
7. Create file system using ext4 for md0 and mount under /mnt/raid1.
# mkfs.ext4 /dev/md0

Create RAID Device Filesystem
8. Next, mount the newly created filesystem under ‘/mnt/raid1‘ and create some files and verify the contents under mount point.
# mkdir /mnt/raid1
# mount /dev/md0 /mnt/raid1/
# touch /mnt/raid1/tecmint.txt
# echo "tecmint raid setups" > /mnt/raid1/tecmint.txt
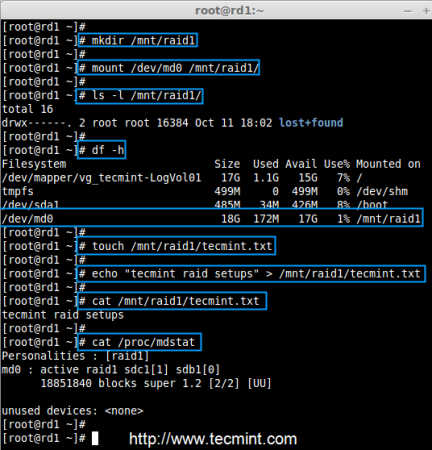
Mount Raid Device
9. To auto-mount RAID1 on system reboot, you need to make an entry in fstab file. Open ‘/etc/fstab‘ file and add the following line at the bottom of the file.
/dev/md0 /mnt/raid1 ext4 defaults 0 0
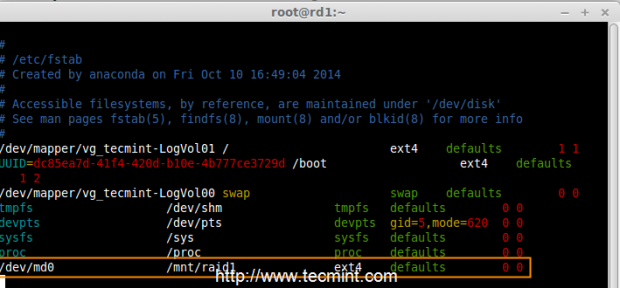
Raid Automount Device
10. Run ‘mount -a‘ to check whether there are any errors in fstab entry.
# mount -av
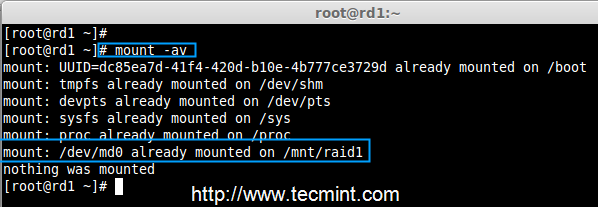
Check Errors in fstab
11. Next, save the raid configuration manually to ‘mdadm.conf‘ file using the below command.
# mdadm --detail --scan --verbose >> /etc/mdadm.conf
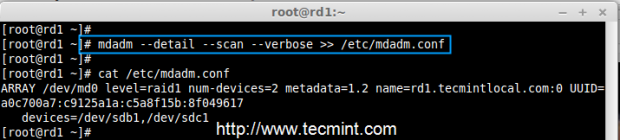
Save Raid Configuration
The above configuration file is read by the system at the reboots and load the RAID devices.
Step 5: Verify Data After Disk Failure
12. Our main purpose is, even after any of hard disk fail or crash our data needs to be available. Let’s see what will happen when any of disk disk is unavailable in array.
# mdadm --detail /dev/md0
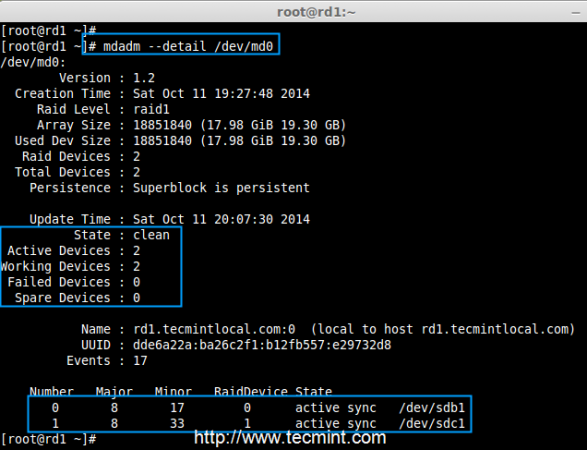
Raid Device Verify
In the above image, we can see there are 2 devices available in our RAID and Active Devices are 2. Now let us see what will happen when a disk plugged out (removed sdc disk) or fails.
# ls -l /dev | grep sd
# mdadm --detail /dev/md0
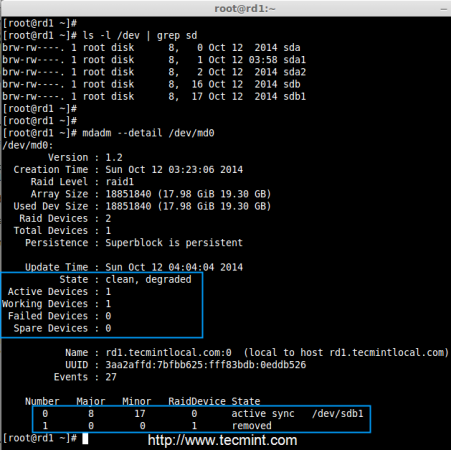
Test RAID Devices
Now in the above image, you can see that one of our drive is lost. I unplugged one of the drive from my Virtual machine. Now let us check our precious data.
# cd /mnt/raid1/
# cat tecmint.txt
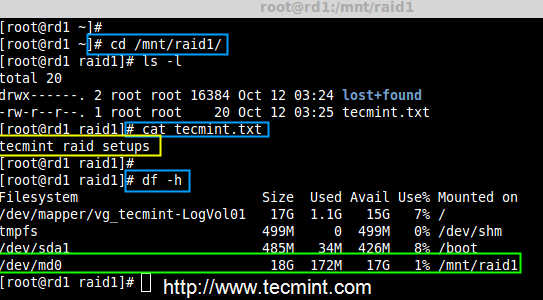
Verify RAID Data
Did you see our data is still available. From this we come to know the advantage of RAID 1 (mirror). In next article, we will see how to setup a RAID 5 striping with distributed Parity. Hope this helps you to understand how the RAID 1 (Mirror) Works.
Creating RAID 5 (Striping with Distributed Parity) in Linux – Part 4
In RAID 5, data strips across multiple drives with distributed parity. The striping with distributed parity means it will split the parity information and stripe data over the multiple disks, which will have good data redundancy.

Setup Raid 5 in Linux
For RAID Level it should have at least three hard drives or more. RAID 5 are being used in the large scale production environment where it’s cost effective and provide performance as well as redundancy.
What is Parity?
Parity is a simplest common method of detecting errors in data storage. Parity stores information in each disks, Let’s say we have 4 disks, in 4 disks one disk space will be split to all disks to store the parity information’s. If any one of the disks fails still we can get the data by rebuilding from parity information after replacing the failed disk.
Pros and Cons of RAID 5
- Gives better performance
- Support Redundancy and Fault tolerance.
- Support hot spare options.
- Will loose a single disk capacity for using parity information.
- No data loss if a single disk fails. We can rebuilt from parity after replacing the failed disk.
- Suits for transaction oriented environment as the reading will be faster.
- Due to parity overhead, writing will be slow.
- Rebuild takes long time.
Requirements
Minimum 3 hard drives are required to create Raid 5, but you can add more disks, only if you’ve a dedicated hardware raid controller with multi ports. Here, we are using software RAID and ‘mdadm‘ package to create raid.
mdadm is a package which allow us to configure and manage RAID devices in Linux. By default there is no configuration file is available for RAID, we must save the configuration file after creating and configuring RAID setup in separate file called mdadm.conf.
Before moving further, I suggest you to go through the following articles for understanding the basics of RAID in Linux.
- Basic Concepts of RAID in Linux – Part 1
- Creating RAID 0 (Stripe) in Linux – Part 2
- Setting up RAID 1 (Mirroring) in Linux – Part 3
My Server Setup
Operating System :	CentOS 6.5 Final
IP Address	 :	192.168.0.227
Hostname	 :	rd5.tecmintlocal.com
Disk 1 [20GB]	 :	/dev/sdb
Disk 2 [20GB]	 :	/dev/sdc
Disk 3 [20GB]	 :	/dev/sdd
This article is a Part 4 of a 9-tutorial RAID series, here we are going to setup a software RAID 5 with distributed parity in Linux systems or servers using three 20GB disks named /dev/sdb, /dev/sdc and /dev/sdd.
Step 1: Installing mdadm and Verify Drives
1. As we said earlier, that we’re using CentOS 6.5 Final release for this raid setup, but same steps can be followed for RAID setup in any Linux based distributions.
# lsb_release -a
# ifconfig | grep inet
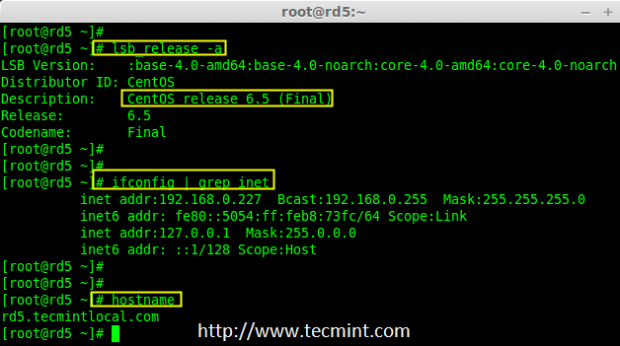
CentOS 6.5 Summary
2. If you’re following our raid series, we assume that you’ve already installed ‘mdadm‘ package, if not, use the following command according to your Linux distribution to install the package.
# yum install mdadm		[on RedHat systems]
# apt-get install mdadm 	[on Debain systems]
3. After the ‘mdadm‘ package installation, let’s list the three 20GB disks which we have added in our system using ‘fdisk‘ command.
# fdisk -l | grep sd
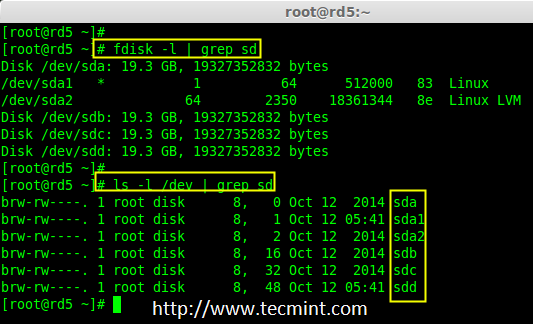
Install mdadm Tool
4. Now it’s time to examine the attached three drives for any existing RAID blocks on these drives using following command.
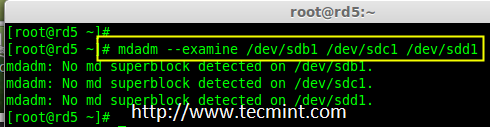
# mdadm -E /dev/sd[b-d]
# mdadm --examine /dev/sdb /dev/sdc /dev/sdd
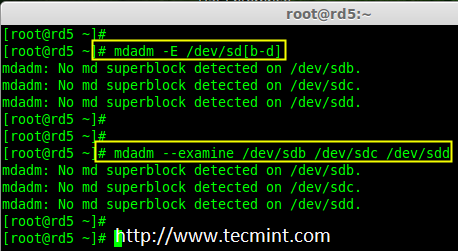
Examine Drives For Raid
Note: From the above image illustrated that there is no any super-block detected yet. So, there is no RAID defined in all three drives. Let us start to create one now.
Step 2: Partitioning the Disks for RAID
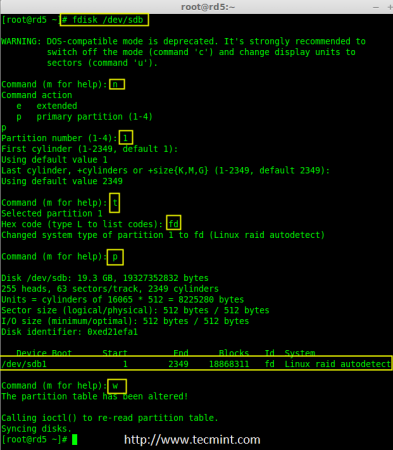
5. First and foremost, we have to partition the disks (/dev/sdb, /dev/sdc and /dev/sdd) before adding to a RAID, So let us define the partition using ‘fdisk’ command, before forwarding to the next steps.
# fdisk /dev/sdb
# fdisk /dev/sdc
# fdisk /dev/sdd
Create /dev/sdb Partition
Please follow the below instructions to create partition on /dev/sdb drive.
- Press ‘n‘ for creating new partition.
- Then choose ‘P‘ for Primary partition. Here we are choosing Primary because there is no partitions defined yet.
- Then choose ‘1‘ to be the first partition. By default it will be 1.
- Here for cylinder size we don’t have to choose the specified size because we need the whole partition for RAID so just Press Enter two times to choose the default full size.
- Next press ‘p‘ to print the created partition.
- Change the Type, If we need to know the every available types Press ‘L‘.
- Here, we are selecting ‘fd‘ as my type is RAID.
- Next press ‘p‘ to print the defined partition.
- Then again use ‘p‘ to print the changes what we have made.
- Use ‘w‘ to write the changes.
Create sdb Partition
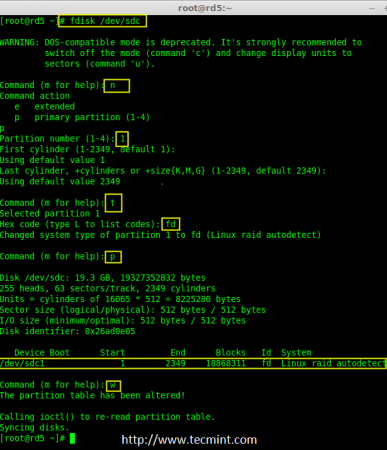
Note: We have to follow the steps mentioned above to create partitions for sdc & sdd drives too.
Create /dev/sdc Partition
Now partition the sdc and sdd drives by following the steps given in the screenshot or you can follow above steps.
# fdisk /dev/sdc
Create sdc Partition
Create /dev/sdd Partition
# fdisk /dev/sdd

Create sdd Partition
6. After creating partitions, check for changes in all three drives sdb, sdc, & sdd.
# mdadm --examine /dev/sdb /dev/sdc /dev/sdd

or

# mdadm -E /dev/sd[b-c]
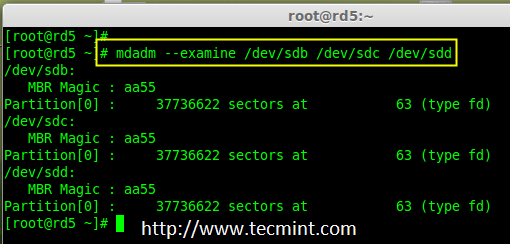
Check Partition Changes
Note: In the above pic. depict the type is fd i.e. for RAID.
7. Now Check for the RAID blocks in newly created partitions. If no super-blocks detected, than we can move forward to create a new RAID 5 setup on these drives.
Check Raid on Partition
Step 3: Creating md device md0
8. Now create a Raid device ‘md0‘ (i.e. /dev/md0) and include raid level on all newly created partitions (sdb1, sdc1 and sdd1) using below command.
# mdadm --create /dev/md0 --level=5 --raid-devices=3 /dev/sdb1 /dev/sdc1 /dev/sdd1

or

# mdadm -C /dev/md0 -l=5 -n=3 /dev/sd[b-d]1
9. After creating raid device, check and verify the RAID, devices included and RAID Level from the mdstat output.
# cat /proc/mdstat
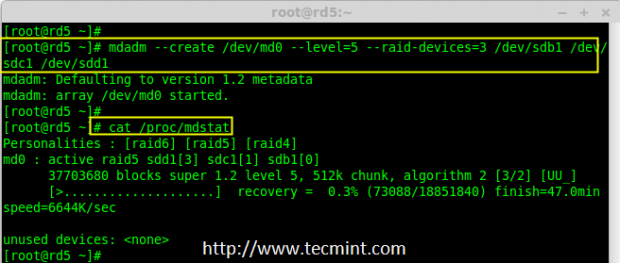
Verify Raid Device
If you want to monitor the current building process, you can use ‘watch‘ command, just pass through the ‘cat /proc/mdstat‘ with watch command which will refresh screen every 1 second.
# watch -n1 cat /proc/mdstat
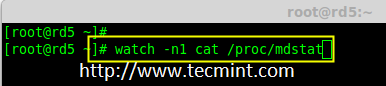
Monitor Raid 5 Process
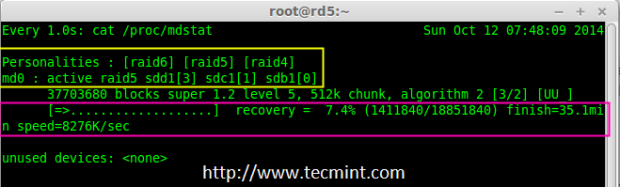
Raid 5 Process Summary
10. After creation of raid, Verify the raid devices using the following command.
# mdadm -E /dev/sd[b-d]1
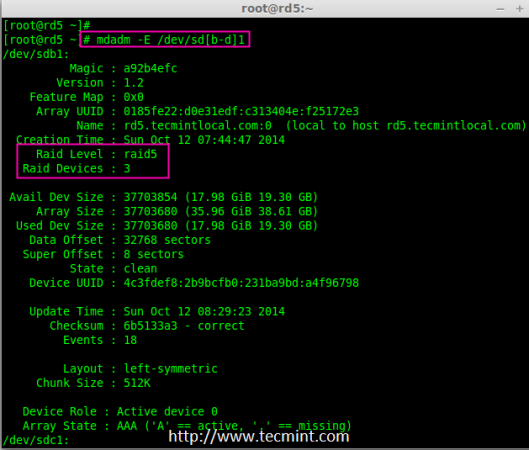
Verify Raid Level
Note: The Output of the above command will be little long as it prints the information of all three drives.
11. Next, verify the RAID array to assume that the devices which we’ve included in the RAID level are running and started to re-sync.
# mdadm --detail /dev/md0
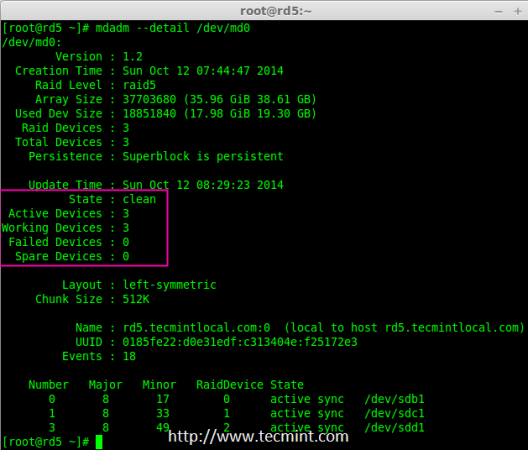
Verify Raid Array
Step 4: Creating file system for md0
12. Create a file system for ‘md0‘ device using ext4 before mounting.
# mkfs.ext4 /dev/md0
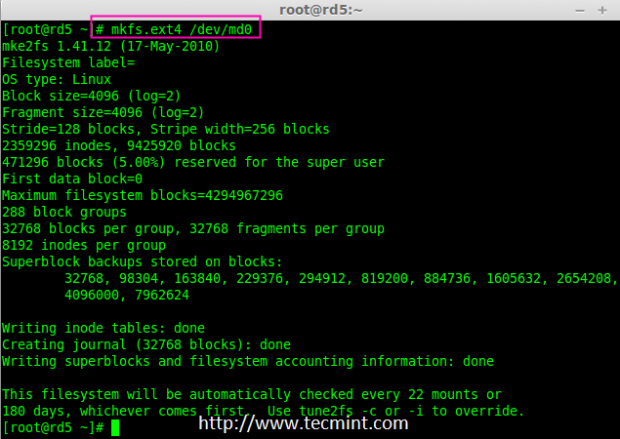
Create md0 Filesystem
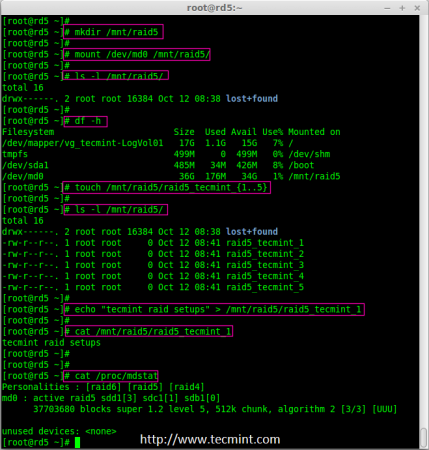
13. Now create a directory under ‘/mnt‘ then mount the created filesystem under /mnt/raid5 and check the files under mount point, you will see lost+found directory.
# mkdir /mnt/raid5
# mount /dev/md0 /mnt/raid5/
# ls -l /mnt/raid5/
14. Create few files under mount point /mnt/raid5 and append some text in any one of the file to verify the content.
# touch /mnt/raid5/raid5_tecmint_{1..5}
# ls -l /mnt/raid5/
# echo "tecmint raid setups" > /mnt/raid5/raid5_tecmint_1
# cat /mnt/raid5/raid5_tecmint_1
# cat /proc/mdstat
Mount Raid Device
15. We need to add entry in fstab, else will not display our mount point after system reboot. To add an entry, we should edit the fstab file and append the following line as shown below. The mount point will differ according to your environment.
# vim /etc/fstab

/dev/md0                /mnt/raid5              ext4    defaults        0 0
Raid 5 Automount
16. Next, run ‘mount -av‘ command to check whether any errors in fstab entry.
# mount -av
Check Fstab Errors
Step 5: Save Raid 5 Configuration
17. As mentioned earlier in requirement section, by default RAID don’t have a config file. We have to save it manually. If this step is not followed RAID device will not be in md0, it will be in some other random number.
So, we must have to save the configuration before system reboot. If the configuration is saved it will be loaded to the kernel during the system reboot and RAID will also gets loaded.
# mdadm --detail --scan --verbose >> /etc/mdadm.conf
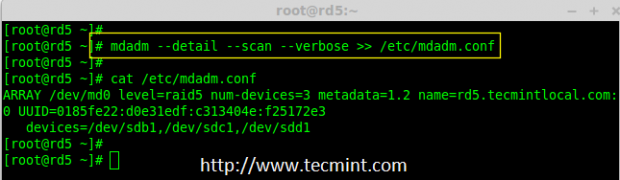
Save Raid 5 Configuration
Note: Saving the configuration will keep the RAID level stable in md0 device.
Step 6: Adding Spare Drives
18. What the use of adding a spare drive? its very useful if we have a spare drive, if any one of the disk fails in our array, this spare drive will get active and rebuild the process and sync the data from other disk, so we can see a redundancy here.
For more instructions on how to add spare drive and check Raid 5 fault tolerance, read #Step 6 and #Step 7 in the following article.
- Add Spare Drive to Raid 5 Setup
Conclusion
Here, in this article, we have seen how to setup a RAID 5 using three number of disks. Later in my upcoming articles, we will see how to troubleshoot when a disk fails in RAID 5 and how to replace for recovery.
Setup RAID Level 6 (Striping with Double Distributed Parity) in Linux – Part 5
RAID 6 is upgraded version of RAID 5, where it has two distributed parity which provides fault tolerance even after two drives fails. Mission critical system still operational incase of two concurrent disks failures. It’s alike RAID 5, but provides more robust, because it uses one more disk for parity.
In our earlier article, we’ve seen distributed parity in RAID 5, but in this article we will going to see RAID 6 with double distributed parity. Don’t expect extra performance than any other RAID, if so we have to install a dedicated RAID Controller too. Here in RAID 6 even if we loose our 2 disks we can get the data back by replacing a spare drive and build it from parity.
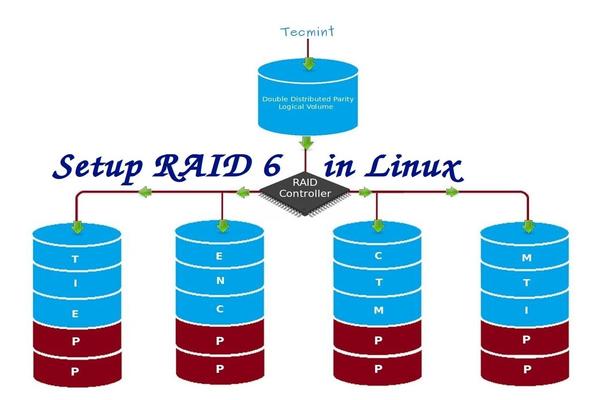
Setup RAID 6 in Linux
To setup a RAID 6, minimum 4 numbers of disks or more in a set are required. RAID 6 have multiple disks even in some set it may be have some bunch of disks, while reading, it will read from all the drives, so reading would be faster whereas writing would be poor because it has to stripe over multiple disks.
Now, many of us comes to conclusion, why we need to use RAID 6, when it doesn’t perform like any other RAID. Hmm… those who raise this question need to know that, if they need high fault tolerance choose RAID 6. In every higher environments with high availability for database, they use RAID 6 because database is the most important and need to be safe in any cost, also it can be useful for video streaming environments.
Pros and Cons of RAID 6
- Performance are good.
- RAID 6 is expensive, as it requires two independent drives are used for parity functions.
- Will loose a two disks capacity for using parity information (double parity).
- No data loss, even after two disk fails. We can rebuilt from parity after replacing the failed disk.
- Reading will be better than RAID 5, because it reads from multiple disk, But writing performance will be very poor without dedicated RAID Controller.
Requirements
Minimum 4 numbers of disks are required to create a RAID 6. If you want to add more disks, you can, but you must have dedicated raid controller. In software RAID, we will won’t get better performance in RAID 6. So we need a physical RAID controller.
Those who are new to RAID setup, we recommend to go through RAID articles below.
- Basic Concepts of RAID in Linux – Part 1
- Creating Software RAID 0 (Stripe) in Linux – Part 2
- Setting up RAID 1 (Mirroring) in Linux – Part 3
My Server Setup
Operating System :	CentOS 6.5 Final
IP Address	 :	192.168.0.228
Hostname	 :	rd6.tecmintlocal.com
Disk 1 [20GB]	 :	/dev/sdb
Disk 2 [20GB]	 :	/dev/sdc
Disk 3 [20GB]	 :	/dev/sdd
Disk 4 [20GB]	 : 	/dev/sde
This article is a Part 5 of a 9-tutorial RAID series, here we are going to see how we can create and setup Software RAID 6 or Striping with Double Distributed Parity in Linux systems or servers using four 20GB disks named /dev/sdb, /dev/sdc, /dev/sdd and /dev/sde.
Step 1: Installing mdadm Tool and Examine Drives
1. If you’re following our last two Raid articles (Part 2 and Part 3), where we’ve already shown how to install ‘mdadm‘ tool. If you’re new to this article, let me explain that ‘mdadm‘ is a tool to create and manage Raid in Linux systems, let’s install the tool using following command according to your Linux distribution.
# yum install mdadm		[on RedHat systems]
# apt-get install mdadm 	[on Debain systems]
2. After installing the tool, now it’s time to verify the attached four drives that we are going to use for raid creation using the following ‘fdisk‘ command.
# fdisk -l | grep sd
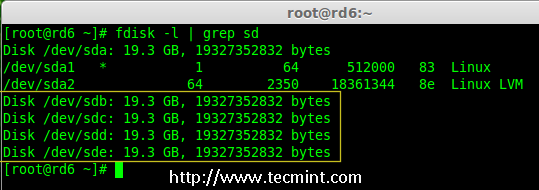
Check Disks in Linux
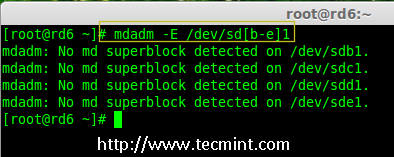
3. Before creating a RAID drives, always examine our disk drives whether there is any RAID is already created on the disks.
# mdadm -E /dev/sd[b-e]
# mdadm --examine /dev/sdb /dev/sdc /dev/sdd /dev/sde
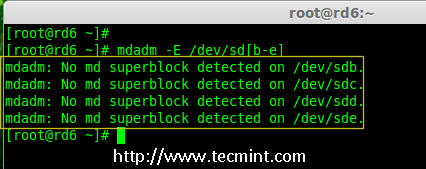
Check Raid on Disk
Note: In the above image depicts that there is no any super-block detected or no RAID is defined in four disk drives. We may move further to start creating RAID 6.
Step 2: Drive Partitioning for RAID 6
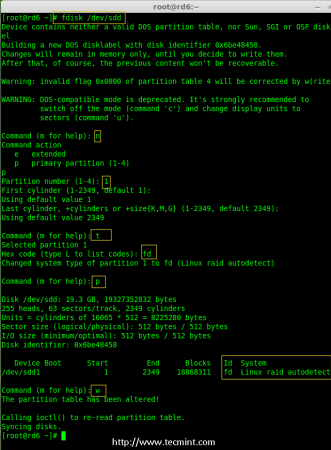
4. Now create partitions for raid on ‘/dev/sdb‘, ‘/dev/sdc‘, ‘/dev/sdd‘ and ‘/dev/sde‘ with the help of following fdisk command. Here, we will show how to create partition on sdb drive and later same steps to be followed for rest of the drives.
Create /dev/sdb Partition
# fdisk /dev/sdb
Please follow the instructions as shown below for creating partition.
- Press ‘n‘ for creating new partition.
- Then choose ‘P‘ for Primary partition.
- Next choose the partition number as 1.
- Define the default value by just pressing two times Enter key.
- Next press ‘P‘ to print the defined partition.
- Press ‘L‘ to list all available types.
- Type ‘t‘ to choose the partitions.
- Choose ‘fd‘ for Linux raid auto and press Enter to apply.
- Then again use ‘P‘ to print the changes what we have made.
- Use ‘w‘ to write the changes.
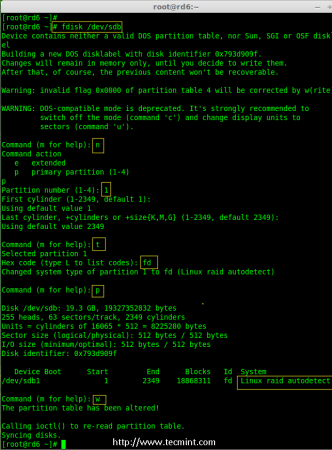
Create /dev/sdb Partition
Create /dev/sdb Partition
# fdisk /dev/sdc
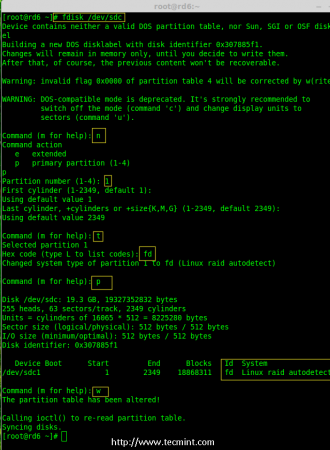
Create /dev/sdc Partition
Create /dev/sdd Partition
# fdisk /dev/sdd
Create /dev/sdd Partition
Create /dev/sde Partition
# fdisk /dev/sde

Create /dev/sde Partition
5. After creating partitions, it’s always good habit to examine the drives for super-blocks. If super-blocks does not exist than we can go head to create a new RAID setup.
# mdadm -E /dev/sd[b-e]1


or

# mdadm --examine /dev/sdb1 /dev/sdc1 /dev/sdd1 /dev/sde1
Check Raid on New Partitions
Step 3: Creating md device (RAID)
6. Now it’s time to create Raid device ‘md0‘ (i.e. /dev/md0) and apply raid level on all newly created partitions and confirm the raid using following commands.
# mdadm --create /dev/md0 --level=6 --raid-devices=4 /dev/sdb1 /dev/sdc1 /dev/sdd1 /dev/sde1
# cat /proc/mdstat
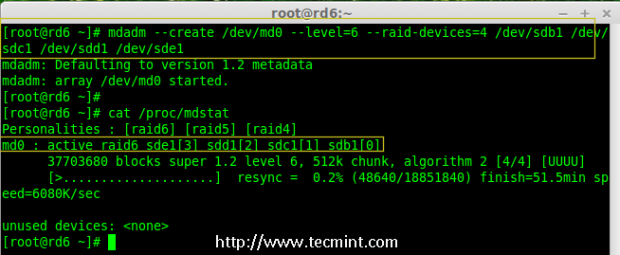
Create Raid 6 Device
7. You can also check the current process of raid using watch command as shown in the screen grab below.
# watch -n1 cat /proc/mdstat
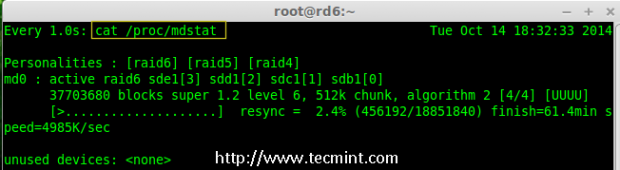
Check Raid 6 Process
8. Verify the raid devices using the following command.
# mdadm -E /dev/sd[b-e]1
Note:: The above command will be display the information of the four disks, which is quite long so not possible to post the output or screen grab here.
9. Next, verify the RAID array to confirm that the re-syncing is started.
# mdadm --detail /dev/md0
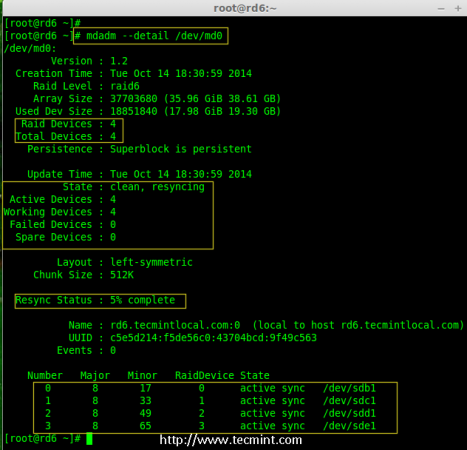
Check Raid 6 Array
Step 4: Creating FileSystem on Raid Device
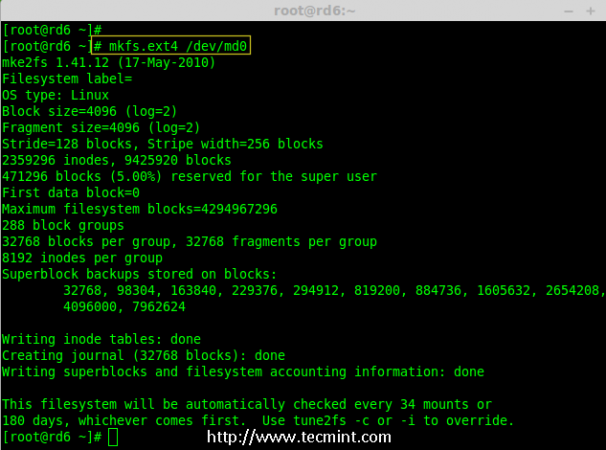
10. Create a filesystem using ext4 for ‘/dev/md0‘ and mount it under /mnt/raid6. Here we’ve used ext4, but you can use any type of filesystem as per your choice.
# mkfs.ext4 /dev/md0
Create File System on Raid 6
11. Mount the created filesystem under /mnt/raid6 and verify the files under mount point, we can see lost+found directory.
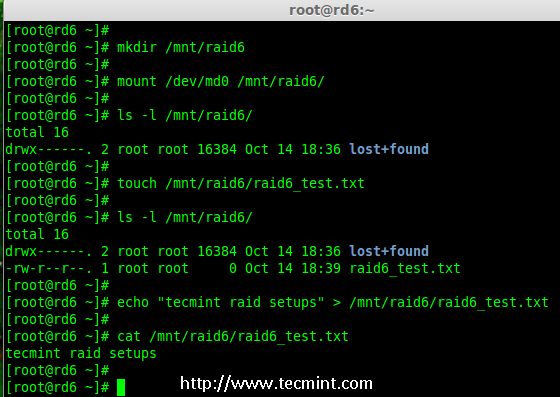
# mkdir /mnt/raid6
# mount /dev/md0 /mnt/raid6/
# ls -l /mnt/raid6/
12. Create some files under mount point and append some text in any one of the file to verify the content.
# touch /mnt/raid6/raid6_test.txt
# ls -l /mnt/raid6/
# echo "tecmint raid setups" > /mnt/raid6/raid6_test.txt
# cat /mnt/raid6/raid6_test.txt
Verify Raid Content
13. Add an entry in /etc/fstab to auto mount the device at the system startup and append the below entry, mount point may differ according to your environment.
# vim /etc/fstab

/dev/md0                /mnt/raid6              ext4    defaults        0 0

Automount Raid 6 Device
14. Next, execute ‘mount -a‘ command to verify whether there is any error in fstab entry.
# mount -av
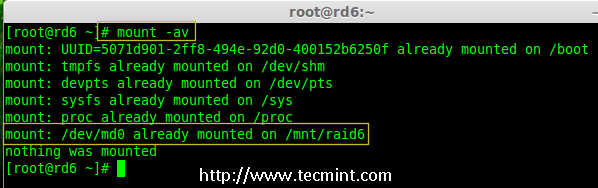
Verify Raid Automount
Step 5: Save RAID 6 Configuration
15. Please note by default RAID don’t have a config file. We have to save it by manually using below command and then verify the status of device ‘/dev/md0‘.
# mdadm --detail --scan --verbose >> /etc/mdadm.conf
# mdadm --detail /dev/md0
Save Raid 6 Configuration
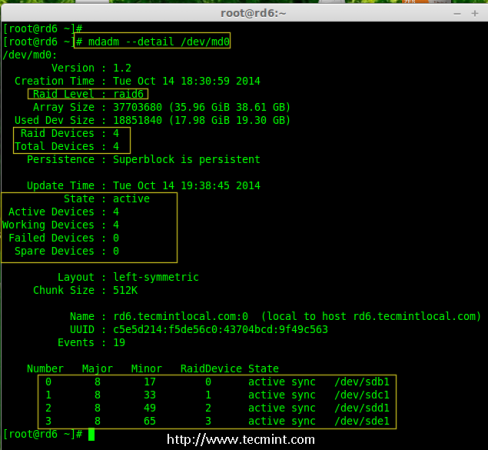
Check Raid 6 Status
Step 6: Adding a Spare Drives
16. Now it has 4 disks and there are two parity information’s available. In some cases, if any one of the disk fails we can get the data, because there is double parity in RAID 6.
May be if the second disk fails, we can add a new one before loosing third disk. It is possible to add a spare drive while creating our RAID set, But I have not defined the spare drive while creating our raid set. But, we can add a spare drive after any drive failure or while creating the RAID set. Now we have already created the RAID set now let me add a spare drive for demonstration.
For the demonstration purpose, I’ve hot-plugged a new HDD disk (i.e. /dev/sdf), let’s verify the attached disk.
# ls -l /dev/ | grep sd
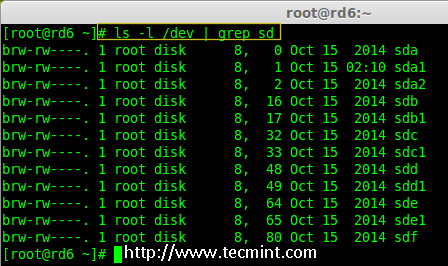
Check New Disk
17. Now again confirm the new attached disk for any raid is already configured or not using the same mdadmcommand.
# mdadm --examine /dev/sdf
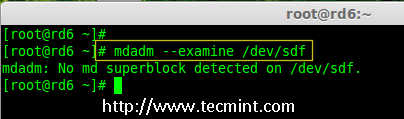
Check Raid on New Disk
Note: As usual, like we’ve created partitions for four disks earlier, similarly we’ve to create new partition on the new plugged disk using fdisk command.
# fdisk /dev/sdf
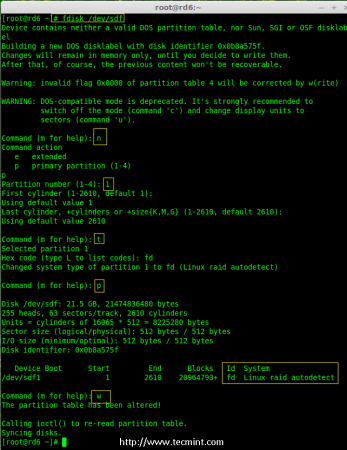
Create /dev/sdf Partition
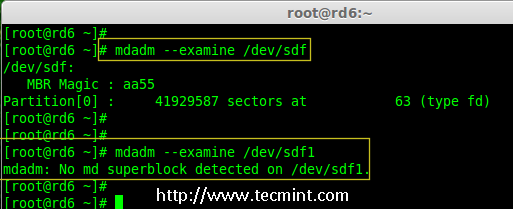
18. Again after creating new partition on /dev/sdf, confirm the raid on the partition, include the spare drive to the /dev/md0 raid device and verify the added device.
# mdadm --examine /dev/sdf
# mdadm --examine /dev/sdf1
# mdadm --add /dev/md0 /dev/sdf1
# mdadm --detail /dev/md0
Verify Raid on sdf Partition
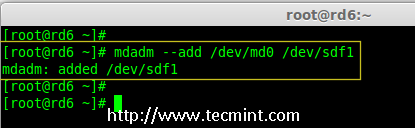
Add sdf Partition to Raid
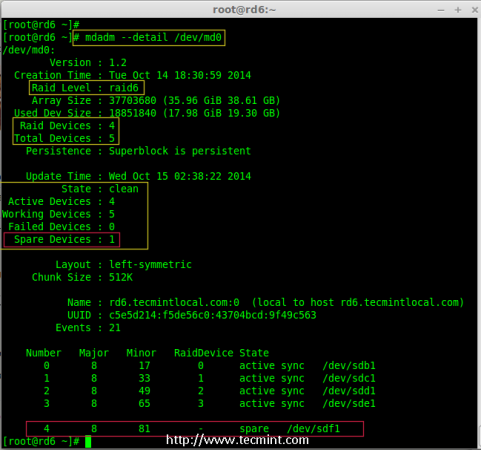
Verify sdf Partition Details
Step 7: Check Raid 6 Fault Tolerance
19. Now, let us check whether spare drive works automatically, if anyone of the disk fails in our Array. For testing, I’ve personally marked one of the drive is failed.
Here, we’re going to mark /dev/sdd1 as failed drive.
# mdadm --manage --fail /dev/md0 /dev/sdd1
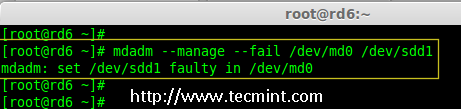
Check Raid 6 Fault Tolerance
20. Let me get the details of RAID set now and check whether our spare started to sync.
# mdadm --detail /dev/md0
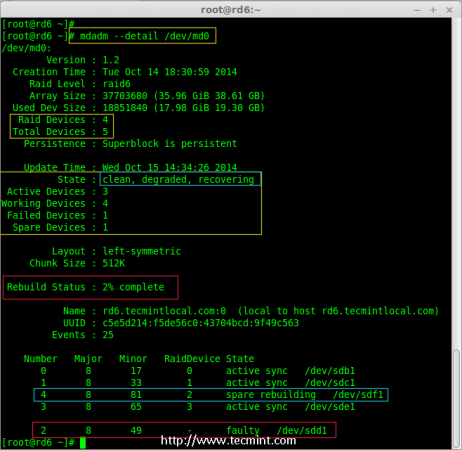
Check Auto Raid Syncing
Hurray! Here, we can see the spare got activated and started rebuilding process. At the bottom we can see the faulty drive /dev/sdd1 listed as faulty. We can monitor build process using following command.
# cat /proc/mdstat
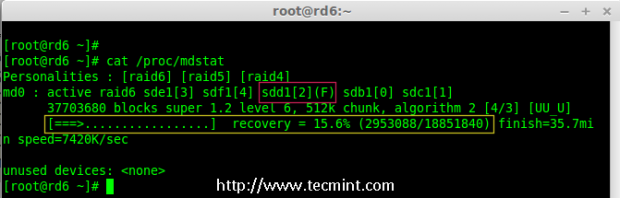
Raid 6 Auto Syncing
Conclusion:
Here, we have seen how to setup RAID 6 using four disks. This RAID level is one of the expensive setup with high redundancy. We will see how to setup a Nested RAID 10 and much more in the next articles.
Setting Up RAID 10 or 1+0 (Nested) in Linux – Part 6
RAID 10 is a combine of RAID 0 and RAID 1 to form a RAID 10. To setup Raid 10, we need at least 4 number of disks. In our earlier articles, we’ve seen how to setup a RAID 0 and RAID 1 with minimum 2 number of disks.
Here we will use both RAID 0 and RAID 1 to perform a Raid 10 setup with minimum of 4 drives. Assume, that we’ve some data saved to logical volume, which is created with RAID 10. Just for an example, if we are saving a data “apple” this will be saved under all 4 disk by this following method.
Create Raid 10 in Linux
Using RAID 0 it will save as “A” in first disk and “p” in the second disk, then again “p” in first disk and “l” in second disk. Then “e” in first disk, like this it will continue the Round robin process to save the data. From this we come to know that RAID 0 will write the half of the data to first disk and other half of the data to second disk.
In RAID 1 method, same data will be written to other 2 disks as follows. “A” will write to both first and second disks, “P” will write to both disk, Again other “P” will write to both the disks. Thus using RAID 1 it will write to both the disks. This will continue in round robin process.
Now you all came to know that how RAID 10 works by combining of both RAID 0 and RAID 1. If we have 4 number of 20 GB size disks, it will be 80 GB in total, but we will get only 40 GB of Storage capacity, the half of total capacity will be lost for building RAID 10.
Pros and Cons of RAID 5
- Gives better performance.
- We will loose two of the disk capacity in RAID 10.
- Reading and writing will be very good, because it will write and read to all those 4 disk at the same time.
- It can be used for Database solutions, which needs a high I/O disk writes.
Requirements
In RAID 10, we need minimum of 4 disks, the first 2 disks for RAID 0 and other 2 Disks for RAID 1. Like I said before, RAID 10 is just a Combine of RAID 0 & 1. If we need to extended the RAID group, we must increase the disk by minimum 4 disks.
My Server Setup
Operating System :	CentOS 6.5 Final
IP Address	 	:	192.168.0.229
Hostname	 	:	rd10.tecmintlocal.com
Disk 1 [20GB]	 	:	/dev/sdd
Disk 2 [20GB]	 	:	/dev/sdc
Disk 3 [20GB]	 	:	/dev/sdd
Disk 4 [20GB]	 	:	/dev/sde
There are two ways to setup RAID 10, but here I’m going to show you both methods, but I prefer you to follow the first method, which makes the work lot easier for setting up a RAID 10.
Method 1: Setting Up Raid 10
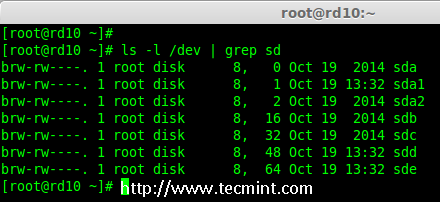
1. First, verify that all the 4 added disks are detected or not using the following command.
# ls -l /dev | grep sd
2. Once the four disks are detected, it’s time to check for the drives whether there is already any raid existed before creating a new one.
# mdadm -E /dev/sd[b-e]
# mdadm --examine /dev/sdb /dev/sdc /dev/sdd /dev/sde
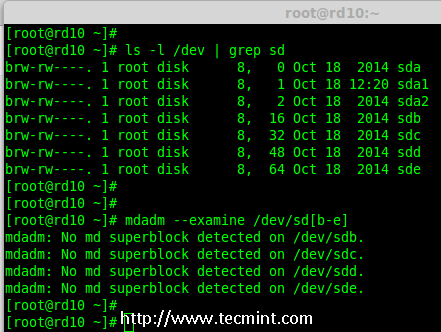
Verify 4 Added Disks
Note: In the above output, you see there isn’t any super-block detected yet, that means there is no RAID defined in all 4 drives.
Step 1: Drive Partitioning for RAID
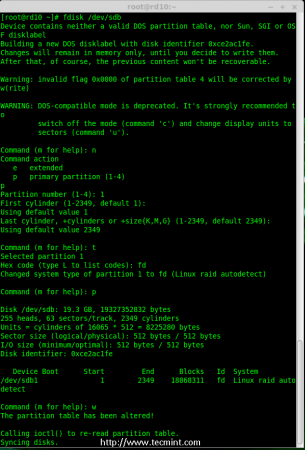
3. Now create a new partition on all 4 disks (/dev/sdb, /dev/sdc, /dev/sdd and /dev/sde) using the ‘fdisk’ tool.
# fdisk /dev/sdb
# fdisk /dev/sdc
# fdisk /dev/sdd
# fdisk /dev/sde
Create /dev/sdb Partition
Let me show you how to partition one of the disk (/dev/sdb) using fdisk, this steps will be the same for all the other disks too.
# fdisk /dev/sdb
Please use the below steps for creating a new partition on /dev/sdb drive.
- Press ‘n‘ for creating new partition.
- Then choose ‘P‘ for Primary partition.
- Then choose ‘1‘ to be the first partition.
- Next press ‘p‘ to print the created partition.
- Change the Type, If we need to know the every available types Press ‘L‘.
- Here, we are selecting ‘fd‘ as my type is RAID.
- Next press ‘p‘ to print the defined partition.
- Then again use ‘p‘ to print the changes what we have made.
- Use ‘w‘ to write the changes.
Disk sdb Partition
Note: Please use the above same instructions for creating partitions on other disks (sdc, sdd sdd sde).
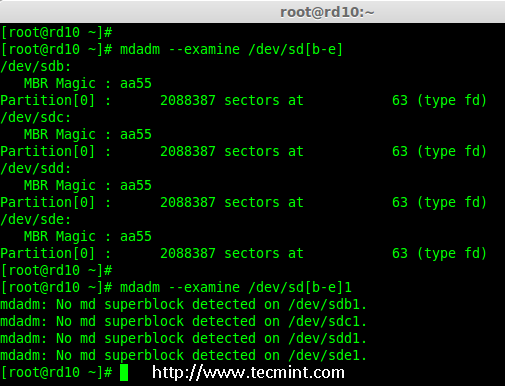
4. After creating all 4 partitions, again you need to examine the drives for any already existing raid using the following command.
# mdadm -E /dev/sd[b-e]
# mdadm -E /dev/sd[b-e]1

OR

# mdadm --examine /dev/sdb /dev/sdc /dev/sdd /dev/sde
# mdadm --examine /dev/sdb1 /dev/sdc1 /dev/sdd1 /dev/sde1
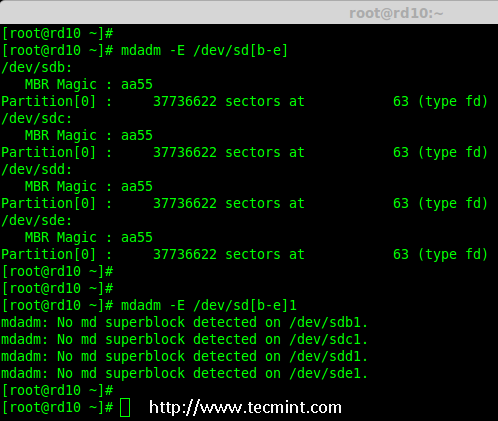
Check All Disks for Raid
Note: The above outputs shows that there isn’t any super-block detected on all four newly created partitions, that means we can move forward to create RAID 10 on these drives.
Step 2: Creating ‘md’ RAID Device
5. Now it’s time to create a ‘md’ (i.e. /dev/md0) device, using ‘mdadm’ raid management tool. Before, creating device, your system must have ‘mdadm’ tool installed, if not install it first.
# yum install mdadm		[on RedHat systems]
# apt-get install mdadm 	[on Debain systems]
Once ‘mdadm’ tool installed, you can now create a ‘md’ raid device using the following command.
# mdadm --create /dev/md0 --level=10 --raid-devices=4 /dev/sd[b-e]1
6. Next verify the newly created raid device using the ‘cat’ command.
# cat /proc/mdstat
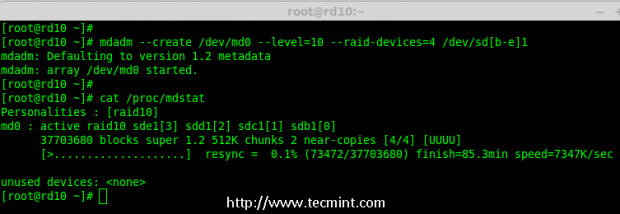
Create md raid Device
7. Next, examine all the 4 drives using the below command. The output of the below command will be long as it displays the information of all 4 disks.
# mdadm --examine /dev/sd[b-e]1
8. Next, check the details of Raid Array with the help of following command.
# mdadm --detail /dev/md0
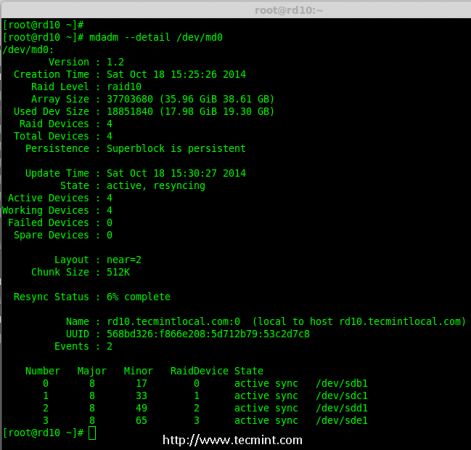
Check Raid Array Details
Note: You see in the above results, that the status of Raid was active and re-syncing.
Step 3: Creating Filesystem
9. Create a file system using ext4 for ‘md0’ and mount it under ‘/mnt/raid10‘. Here, I’ve used ext4, but you can use any filesystem type if you want.
# mkfs.ext4 /dev/md0
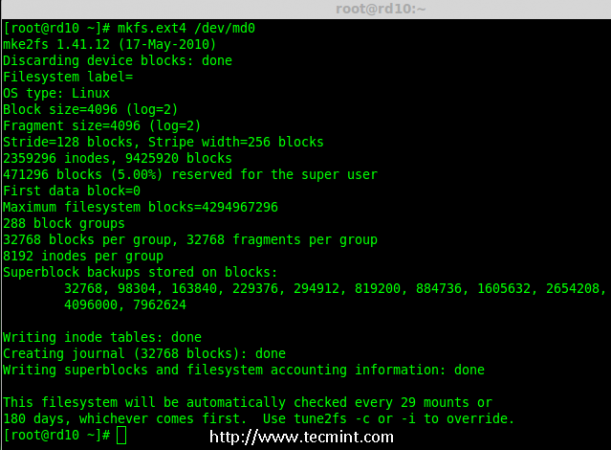
Create md Filesystem
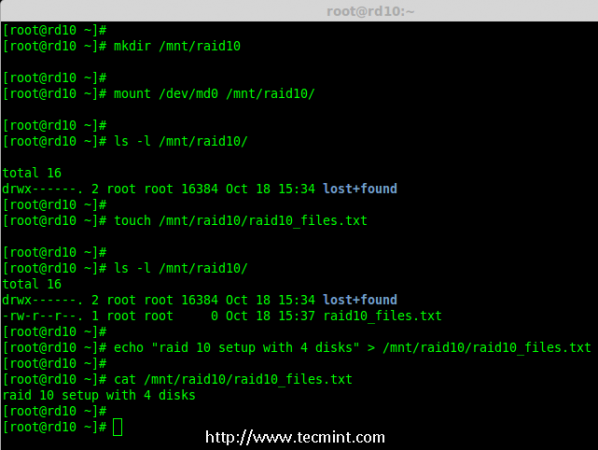
10. After creating filesystem, mount the created file-system under ‘/mnt/raid10‘ and list the contents of the mount point using ‘ls -l’ command.
# mkdir /mnt/raid10
# mount /dev/md0 /mnt/raid10/
# ls -l /mnt/raid10/
Next, add some files under mount point and append some text in any one of the file and check the content.
# touch /mnt/raid10/raid10_files.txt
# ls -l /mnt/raid10/
# echo "raid 10 setup with 4 disks" > /mnt/raid10/raid10_files.txt
# cat /mnt/raid10/raid10_files.txt
Mount md Device
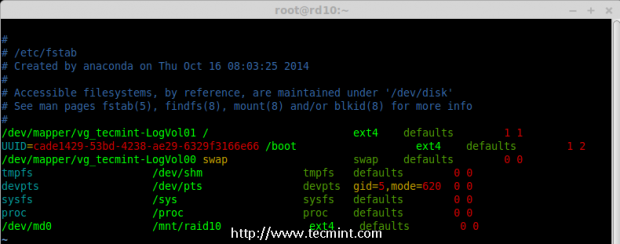
11. For automounting, open the ‘/etc/fstab‘ file and append the below entry in fstab, may be mount point will differ according to your environment. Save and quit using wq!.
# vim /etc/fstab

/dev/md0                /mnt/raid10              ext4    defaults        0 0
AutoMount md Device
12. Next, verify the ‘/etc/fstab‘ file for any errors before restarting the system using ‘mount -a‘ command.
# mount -av
Check Errors in Fstab
Step 4: Save RAID Configuration
13. By default RAID don’t have a config file, so we need to save it manually after making all the above steps, to preserve these settings during system boot.
# mdadm --detail --scan --verbose >> /etc/mdadm.conf
Save Raid10 Configuration
That’s it, we have created RAID 10 using method 1, this method is the easier one. Now let’s move forward to setup RAID 10 using method 2.
Method 2: Creating RAID 10
1. In method 2, we have to define 2 sets of RAID 1 and then we need to define a RAID 0 using those created RAID 1 sets. Here, what we will do is to first create 2 mirrors (RAID1) and then striping over RAID0.
First, list the disks which are all available for creating RAID 10.
# ls -l /dev | grep sd
List 4 Devices
2. Partition the all 4 disks using ‘fdisk’ command. For partitioning, you can follow #step 3 above.
# fdisk /dev/sdb
# fdisk /dev/sdc
# fdisk /dev/sdd
# fdisk /dev/sde
3. After partitioning all 4 disks, now examine the disks for any existing raid blocks.
# mdadm --examine /dev/sd[b-e]
# mdadm --examine /dev/sd[b-e]1
Examine 4 Disks
Step 1: Creating RAID 1
4. First let me create 2 sets of RAID 1 using 4 disks ‘sdb1’ and ‘sdc1’ and other set using ‘sdd1’ & ‘sde1’.
# mdadm --create /dev/md1 --metadata=1.2 --level=1 --raid-devices=2 /dev/sd[b-c]1
# mdadm --create /dev/md2 --metadata=1.2 --level=1 --raid-devices=2 /dev/sd[d-e]1
# cat /proc/mdstat
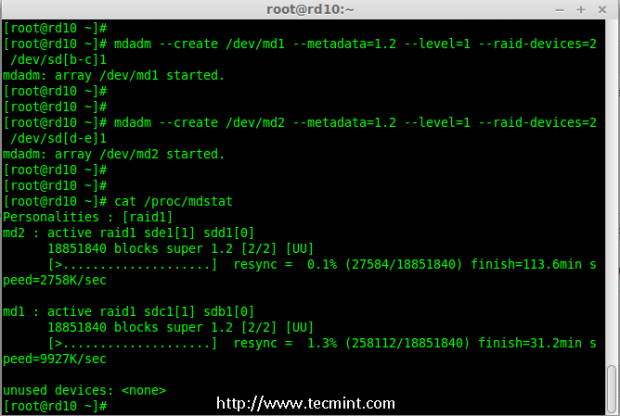
Creating Raid 1
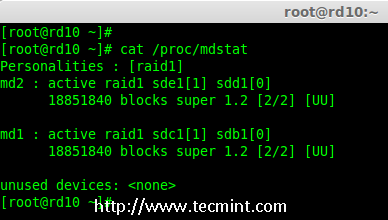
Check Details of Raid 1
Step 2: Creating RAID 0
5. Next, create the RAID 0 using md1 and md2 devices.
# mdadm --create /dev/md0 --level=0 --raid-devices=2 /dev/md1 /dev/md2
# cat /proc/mdstat
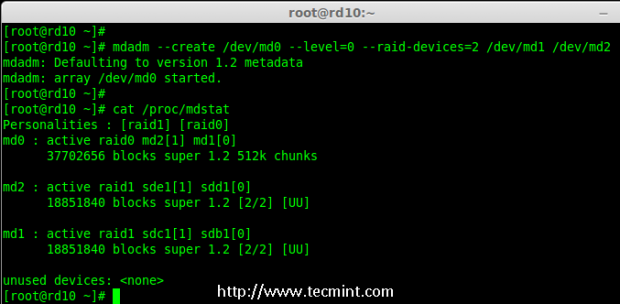
Creating Raid 0
Step 3: Save RAID Configuration
6. We need to save the Configuration under ‘/etc/mdadm.conf‘ to load all raid devices in every reboot times.
# mdadm --detail --scan --verbose >> /etc/mdadm.conf
After this, we need to follow #step 3 Creating file system of method 1.
That’s it! we have created RAID 1+0 using method 2. We will loose two disks space here, but the performance will be excellent compared to any other raid setups.
Conclusion
Here we have created RAID 10 using two methods. RAID 10 has good performance and redundancy too. Hope this helps you to understand about RAID 10 Nested Raid level. Let us see how to grow an existing raid array and much more in my upcoming articles.
Growing an Existing RAID Array and Removing Failed Disks in Raid – Part 7
Every newbies will get confuse of the word array. Array is just a collection of disks. In other words, we can call array as a set or group. Just like a set of eggs containing 6 numbers. Likewise RAID Array contains number of disks, it may be 2, 4, 6, 8, 12, 16 etc. Hope now you know what Array is.
Here we will see how to grow (extend) an existing array or raid group. For example, if we are using 2 disks in an array to form a raid 1 set, and in some situation if we need more space in that group, we can extend the size of an array using mdadm –grow command, just by adding one of the disk to the existing array. After growing (adding disk to an existing array), we will see how to remove one of the failed disk from array.
Growing Raid Array and Removing Failed Disks
Assume that one of the disk is little weak and need to remove that disk, till it fails let it under use, but we need to add one of the spare drive and grow the mirror before it fails, because we need to save our data. While the weak disk fails we can remove it from array this is the concept we are going to see in this topic.
Features of RAID Growth
- We can grow (extend) the size of any raid set.
- We can remove the faulty disk after growing raid array with new disk.
- We can grow raid array without any downtime.
Requirements
- To grow an RAID array, we need an existing RAID set (Array).
- We need extra disks to grow the Array.
- Here I’m using 1 disk to grow the existing array.
Before we learn about growing and recovering of Array, we have to know about the basics of RAID levels and setups. Follow the below links to know about those setups.
- Understanding Basic RAID Concepts – Part 1
- Creating a Software Raid 0 in Linux – Part 2
My Server Setup
Operating System 	:	CentOS 6.5 Final
IP Address	 	:	192.168.0.230
Hostname		:	grow.tecmintlocal.com
2 Existing Disks 	:	1 GB
1 Additional Disk	:	1 GB
Here, my already existing RAID has 2 number of disks with each size is 1GB and we are now adding one more disk whose size is 1GB to our existing raid array.
Growing an Existing RAID Array
1. Before growing an array, first list the existing Raid array using the following command.
# mdadm --detail /dev/md0
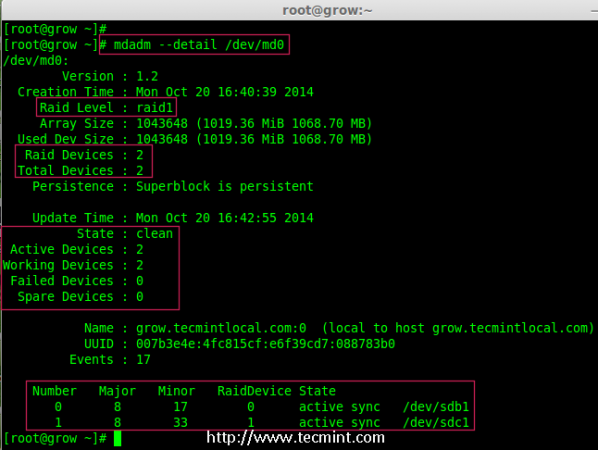
Check Existing Raid Array
Note: The above output shows that I’ve already has two disks in Raid array with raid1 level. Now here we are adding one more disk to an existing array,
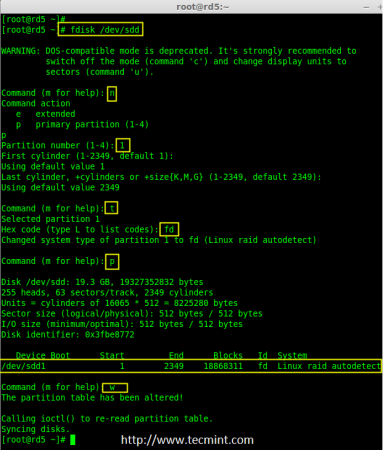
2. Now let’s add the new disk “sdd” and create a partition using ‘fdisk‘ command.
# fdisk /dev/sdd
Please use the below instructions to create a partition on /dev/sdd drive.
- Press ‘n‘ for creating new partition.
- Then choose ‘P‘ for Primary partition.
- Then choose ‘1‘ to be the first partition.
- Next press ‘p‘ to print the created partition.
- Here, we are selecting ‘fd‘ as my type is RAID.
- Next press ‘p‘ to print the defined partition.
- Then again use ‘p‘ to print the changes what we have made.
- Use ‘w‘ to write the changes.
Create New sdd Partition
3. Once new sdd partition created, you can verify it using below command.
# ls -l /dev/ | grep sd
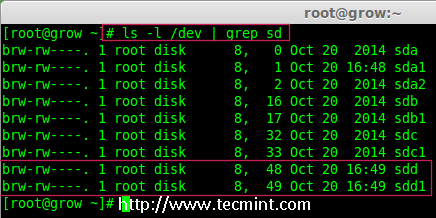
Confirm sdd Partition
4. Next, examine the newly created disk for any existing raid, before adding to the array.
# mdadm --examine /dev/sdd1
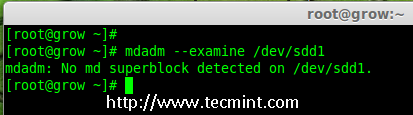
Check Raid on sdd Partition
Note: The above output shows that the disk has no super-blocks detected, means we can move forward to add a new disk to an existing array.
4. To add the new partition /dev/sdd1 in existing array md0, use the following command.
# mdadm --manage /dev/md0 --add /dev/sdd1
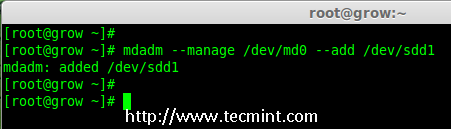
Add Disk To Raid-Array
5. Once the new disk has been added, check for the added disk in our array using.
# mdadm --detail /dev/md0
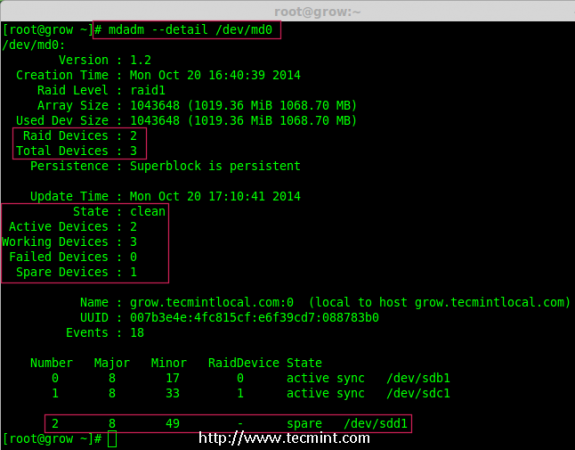
Confirm Disk Added to Raid
Note: In the above output, you can see the drive has been added as a spare. Here, we already having 2 disks in the array, but what we are expecting is 3 devices in array for that we need to grow the array.
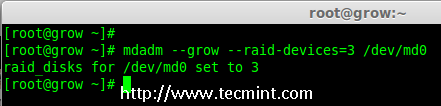
6. To grow the array we have to use the below command.
# mdadm --grow --raid-devices=3 /dev/md0
Grow Raid Array
Now we can see the third disk (sdd1) has been added to array, after adding third disk it will sync the data from other two disks.
# mdadm --detail /dev/md0
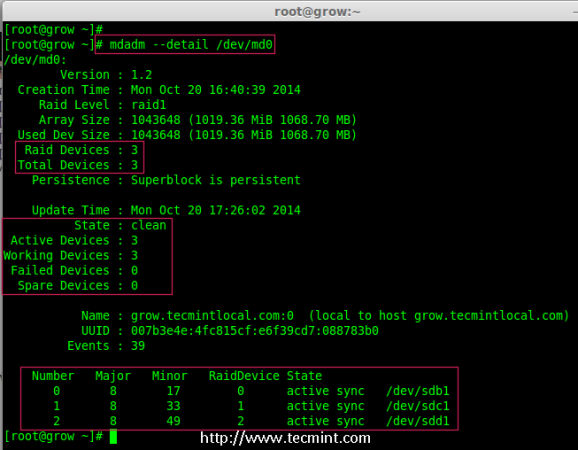
Confirm Raid Array
Note: For large size disk it will take hours to sync the contents. Here I have used 1GB virtual disk, so its done very quickly within seconds.
Removing Disks from Array
7. After the data has been synced to new disk ‘sdd1‘ from other two disks, that means all three disks now have same contents.
As I told earlier let’s assume that one of the disk is weak and needs to be removed, before it fails. So, now assume disk ‘sdc1‘ is weak and needs to be removed from an existing array.
Before removing a disk we have to mark the disk as failed one, then only we can able to remove it.
# mdadm --fail /dev/md0 /dev/sdc1
# mdadm --detail /dev/md0
Disk Fail in Raid Array
From the above output, we clearly see that the disk was marked as faulty at the bottom. Even its faulty, we can see the raid devices are 3, failed 1 and state was degraded.
Now we have to remove the faulty drive from the array and grow the array with 2 devices, so that the raid devices will be set to 2 devices as before.
# mdadm --remove /dev/md0 /dev/sdc1
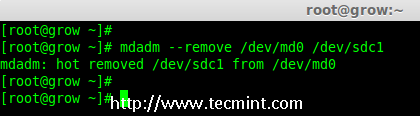
Remove Disk in Raid Array
8. Once the faulty drive is removed, now we’ve to grow the raid array using 2 disks.
# mdadm --grow --raid-devices=2 /dev/md0
# mdadm --detail /dev/md0
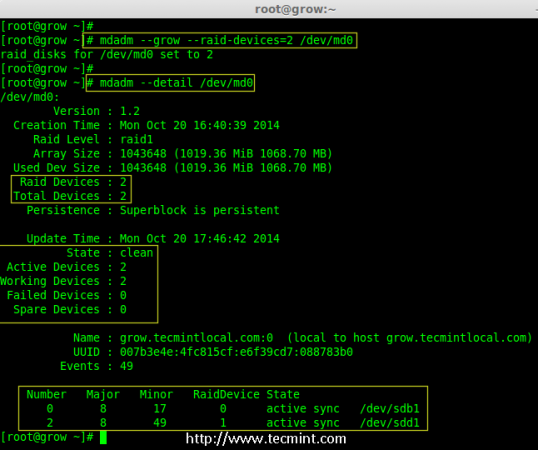
Grow Disks in Raid Array
From the about output, you can see that our array having only 2 devices. If you need to grow the array again, follow the same steps as described above. If you need to add a drive as spare, mark it as spare so that if the disk fails, it will automatically active and rebuild.
Conclusion
In the article, we’ve seen how to grow an existing raid set and how to remove a faulty disk from an array after re-syncing the existing contents. All these steps can be done without any downtime. During data syncing, system users, files and applications will not get affected in any case.
In next, article I will show you how to manage the RAID, till then stay tuned to updates and don’t forget to add your comments.
How to Recover Data and Rebuild Failed Software RAID’s – Part 8
In the previous articles of this RAID series you went from zero to RAID hero. We reviewed several software RAID configurations and explained the essentials of each one, along with the reasons why you would lean towards one or the other depending on your specific scenario.
Recover Rebuild Failed Software RAID’s – Part 8
In this guide we will discuss how to rebuild a software RAID array without data loss when in the event of a disk failure. For brevity, we will only consider a RAID 1 setup – but the concepts and commands apply to all cases alike.
RAID Testing Scenario
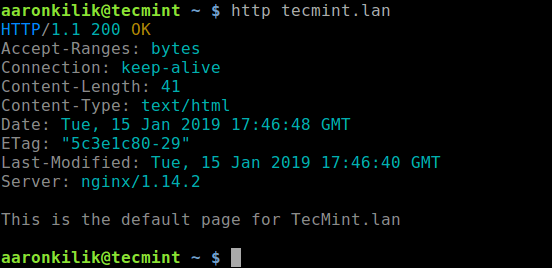
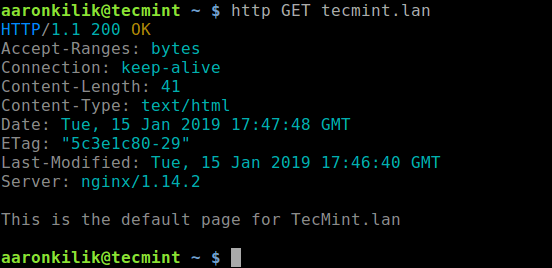
Before proceeding further, please make sure you have set up a RAID 1 array following the instructions provided in Part 3 of this series: How to set up RAID 1 (Mirror) in Linux.
The only variations in our present case will be:
1) a different version of CentOS (v7) than the one used in that article (v6.5), and
2) different disk sizes for /dev/sdb and /dev/sdc (8 GB each).
In addition, if SELinux is enabled in enforcing mode, you will need to add the corresponding labels to the directory where you’ll mount the RAID device. Otherwise, you’ll run into this warning message while attempting to mount it:
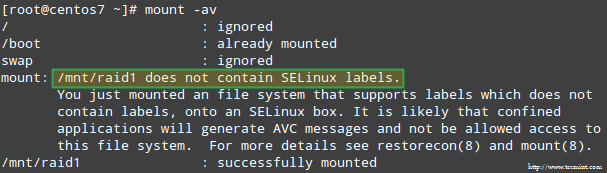
SELinux RAID Mount Error
You can fix this by running:
# restorecon -R /mnt/raid1
Setting up RAID Monitoring
There is a variety of reasons why a storage device can fail (SSDs have greatly reduced the chances of this happening, though), but regardless of the cause you can be sure that issues can occur anytime and you need to be prepared to replace the failed part and to ensure the availability and integrity of your data.
A word of advice first. Even when you can inspect /proc/mdstat in order to check the status of your RAIDs, there’s a better and time-saving method that consists of running mdadm in monitor + scan mode, which will send alerts via email to a predefined recipient.
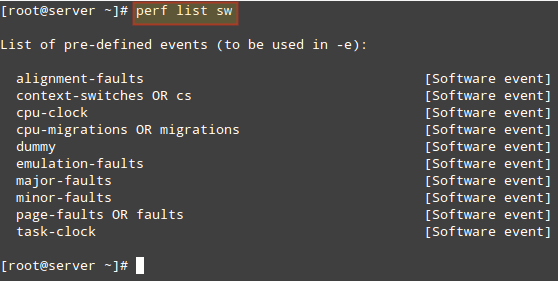
To set this up, add the following line in /etc/mdadm.conf:
MAILADDR user@<domain or localhost>
In my case:
MAILADDR gacanepa@localhost

RAID Monitoring Email Alerts
To run mdadm in monitor + scan mode, add the following crontab entry as root:
@reboot /sbin/mdadm --monitor --scan --oneshot
By default, mdadm will check the RAID arrays every 60 seconds and send an alert if it finds an issue. You can modify this behavior by adding the --delay option to the crontab entry above along with the amount of seconds (for example, --delay 1800 means 30 minutes).
Finally, make sure you have a Mail User Agent (MUA) installed, such as mutt or mailx. Otherwise, you will not receive any alerts.
In a minute we will see what an alert sent by mdadm looks like.
Simulating and Replacing a failed RAID Storage Device
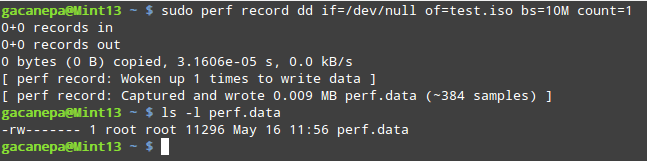
To simulate an issue with one of the storage devices in the RAID array, we will use the --manage and --set-faulty options as follows:
# mdadm --manage --set-faulty /dev/md0 /dev/sdc1
This will result in /dev/sdc1 being marked as faulty, as we can see in /proc/mdstat:
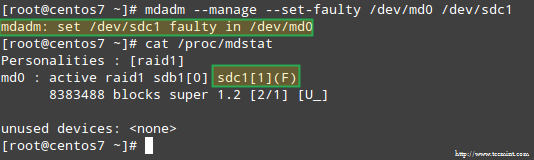
Stimulate Issue with RAID Storage
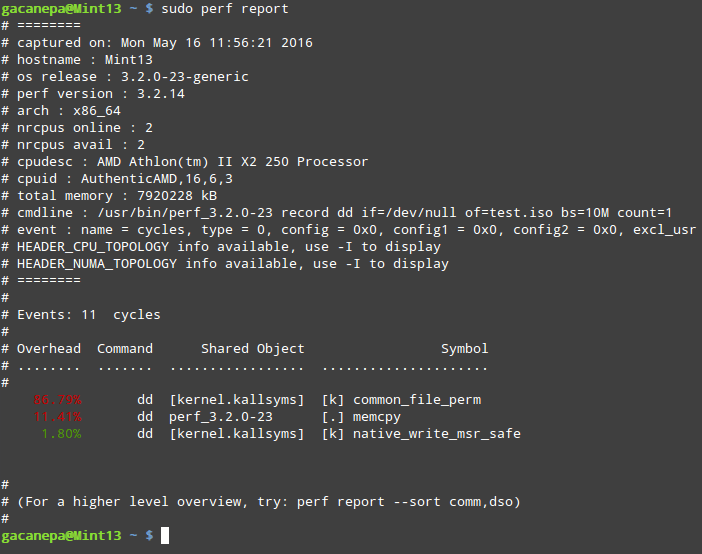
More importantly, let’s see if we received an email alert with the same warning:
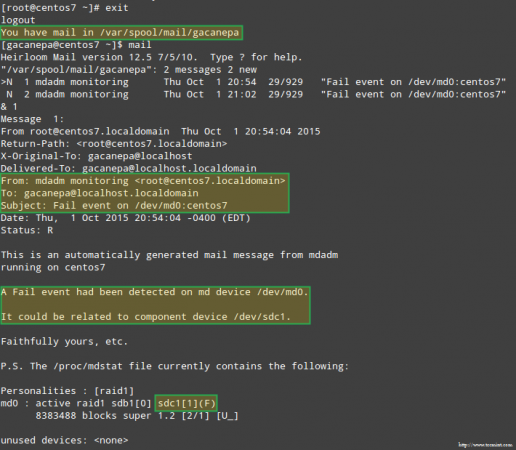
Email Alert on Failed RAID Device
In this case, you will need to remove the device from the software RAID array:
# mdadm /dev/md0 --remove /dev/sdc1
Then you can physically remove it from the machine and replace it with a spare part (/dev/sdd, where a partition of type fd has been previously created):
# mdadm --manage /dev/md0 --add /dev/sdd1
Luckily for us, the system will automatically start rebuilding the array with the part that we just added. We can test this by marking /dev/sdb1 as faulty, removing it from the array, and making sure that the file tecmint.txt is still accessible at /mnt/raid1:
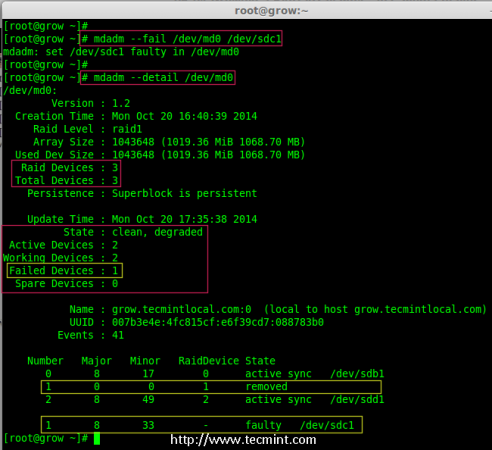
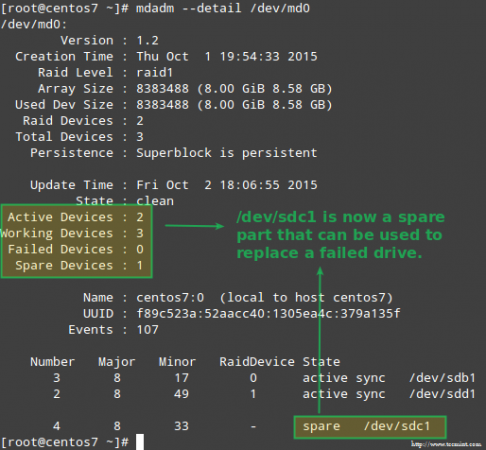
# mdadm --detail /dev/md0
# mount | grep raid1
# ls -l /mnt/raid1 | grep tecmint
# cat /mnt/raid1/tecmint.txt
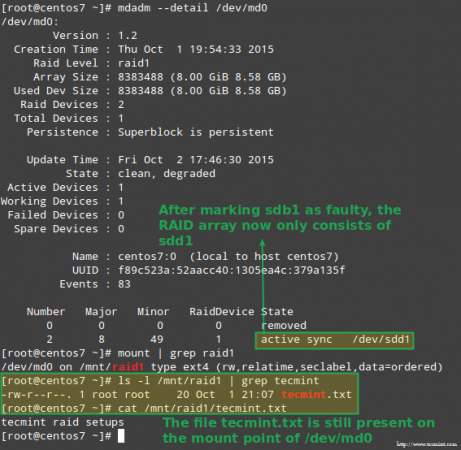
Confirm Rebuilding RAID Array
The image above clearly shows that after adding /dev/sdd1 to the array as a replacement for /dev/sdc1, the rebuilding of data was automatically performed by the system without intervention on our part.
Though not strictly required, it’s a great idea to have a spare device in handy so that the process of replacing the faulty device with a good drive can be done in a snap. To do that, let’s re-add /dev/sdb1 and /dev/sdc1:
# mdadm --manage /dev/md0 --add /dev/sdb1
# mdadm --manage /dev/md0 --add /dev/sdc1
Replace Failed Raid Device
Recovering from a Redundancy Loss
As explained earlier, mdadm will automatically rebuild the data when one disk fails. But what happens if 2 disks in the array fail? Let’s simulate such scenario by marking /dev/sdb1 and /dev/sdd1 as faulty:
# umount /mnt/raid1
# mdadm --manage --set-faulty /dev/md0 /dev/sdb1
# mdadm --stop /dev/md0
# mdadm --manage --set-faulty /dev/md0 /dev/sdd1
Attempts to re-create the array the same way it was created at this time (or using the --assume-clean option) may result in data loss, so it should be left as a last resort.
Let’s try to recover the data from /dev/sdb1, for example, into a similar disk partition (/dev/sde1 – note that this requires that you create a partition of type fd in /dev/sde before proceeding) using ddrescue:
# ddrescue -r 2 /dev/sdb1 /dev/sde1
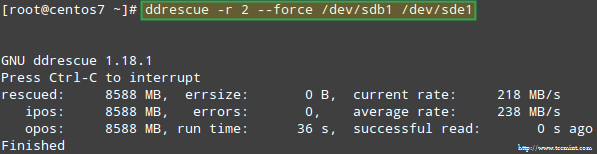
Recovering Raid Array
Please note that up to this point, we haven’t touched /dev/sdb or /dev/sdd, the partitions that were part of the RAID array.
Now let’s rebuild the array using /dev/sde1 and /dev/sdf1:
# mdadm --create /dev/md0 --level=mirror --raid-devices=2 /dev/sd[e-f]1
Please note that in a real situation, you will typically use the same device names as with the original array, that is, /dev/sdb1 and /dev/sdc1 after the failed disks have been replaced with new ones.
In this article I have chosen to use extra devices to re-create the array with brand new disks and to avoid confusion with the original failed drives.
When asked whether to continue writing array, type Y and press Enter. The array should be started and you should be able to watch its progress with:
# watch -n 1 cat /proc/mdstat
When the process completes, you should be able to access the content of your RAID:
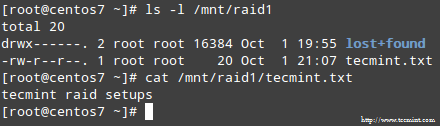
Confirm Raid Content
Summary
In this article we have reviewed how to recover from RAID failures and redundancy losses. However, you need to remember that this technology is a storage solution and DOES NOT replace backups.
The principles explained in this guide apply to all RAID setups alike, as well as the concepts that we will cover in the next and final guide of this series (RAID management).
How to Manage Software RAID’s in Linux with ‘Mdadm’ Tool – Part 9
Regardless of your previous experience with RAID arrays, and whether you followed all of the tutorials in this RAID series or not, managing software RAIDs in Linux is not a very complicated task once you have become acquainted with mdadm --manage command.
Manage Raid Devices with Mdadm in Linux – Part 9
In this tutorial we will review the functionality provided by this tool so that you can have it handy when you need it.
RAID Testing Scenario
As in the last article of this series, we will use for simplicity a RAID 1 (mirror) array which consists of two 8 GBdisks (/dev/sdb and /dev/sdc) and an initial spare device (/dev/sdd) to illustrate, but the commands and concepts listed herein apply to other types of setups as well. That said, feel free to go ahead and add this page to your browser’s bookmarks, and let’s get started.
Understanding mdadm Options and Usage
Fortunately, mdadm provides a built-in --help flag that provides explanations and documentation for each of the main options.
Thus, let’s start by typing:
# mdadm --manage --help
to see what are the tasks that mdadm --manage will allow us to perform and how:
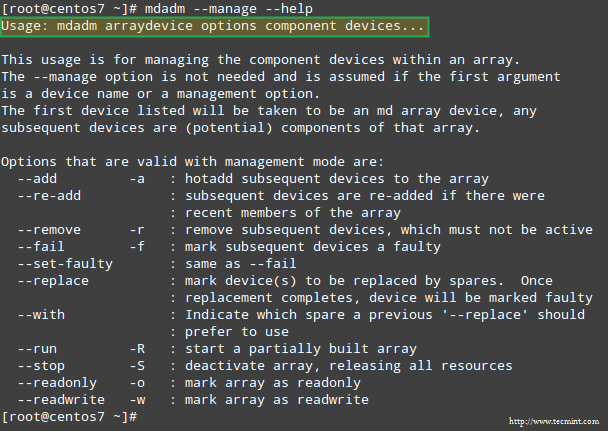
Manage RAID with mdadm Tool
As we can see in the above image, managing a RAID array involves performing the following tasks at one time or another:
- (Re)Adding a device to the array.
- Mark a device as faulty.
- Removing a faulty device from the array.
- Replacing the faulty device with a spare one.
- Start an array that’s partially built.
- Stop an array.
- Mark an array as ro (read-only) or rw (read-write).
Managing RAID Devices with mdadm Tool
Note that if you omit the --manage option, mdadm assumes management mode anyway. Keep this fact in mind to avoid running into trouble further down the road.
The highlighted text in the previous image shows the basic syntax to manage RAIDs:
# mdadm --manage RAID options devices
Let’s illustrate with a few examples.
Example 1: Add a device to the RAID array
You will typically add a new device when replacing a faulty one, or when you have a spare part that you want to have handy in case of a failure:
# mdadm --manage /dev/md0 --add /dev/sdd1
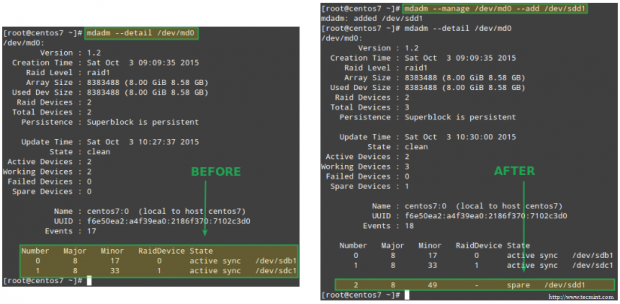
Add Device to Raid Array
Example 2: Marking a RAID device as faulty and removing it from the array
This is a mandatory step before logically removing the device from the array, and later physically pulling it out from the machine – in that order (if you miss one of these steps you may end up causing actual damage to the device):
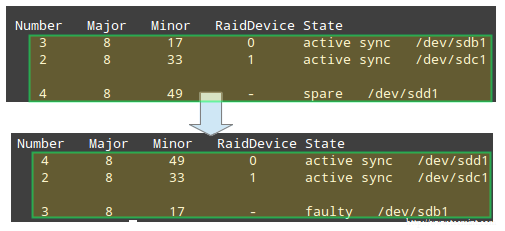
# mdadm --manage /dev/md0 --fail /dev/sdb1
Note how the spare device added in the previous example is used to automatically replace the failed disk. Not only that, but the recovery and rebuilding of raid data start immediately as well:
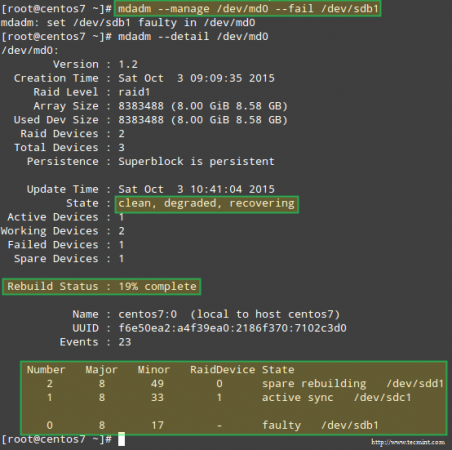
Recover and Rebuild Raid Data
Once the device has been indicated as failed manually, it can be safely removed from the array:
# mdadm --manage /dev/md0 --remove /dev/sdb1
Example 3: Re-adding a device that was part of the array which had been removed previously
Up to this point, we have a working RAID 1 array that consists of 2 active devices: /dev/sdc1 and /dev/sdd1. If we attempt to re-add /dev/sdb1 to /dev/md0 right now:
# mdadm --manage /dev/md0 --re-add /dev/sdb1
we will run into an error:
mdadm: --re-add for /dev/sdb1 to /dev/md0 is not possible
because the array is already made up of the maximum possible number of drives. So we have 2 choices: a) add /dev/sdb1 as a spare, as shown in Example #1, or b) remove /dev/sdd1 from the array and then re-add /dev/sdb1.
We choose option b), and will start by stopping the array to later reassemble it:
# mdadm --stop /dev/md0
# mdadm --assemble /dev/md0 /dev/sdb1 /dev/sdc1
If the above command does not successfully add /dev/sdb1 back to the array, use the command from Example #1 to do it.
Although mdadm will initially detect the newly added device as a spare, it will start rebuilding the data and when it’s done doing so, it should recognize the device to be an active part of the RAID:
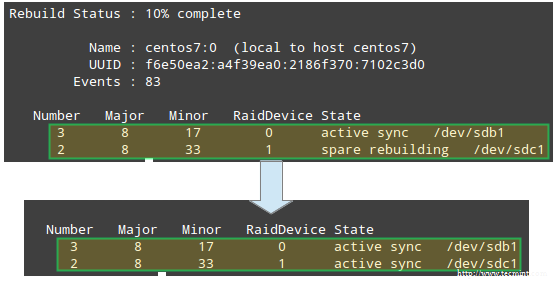
Raid Rebuild Status
Example 4: Replace a Raid device with a specific disk
Replacing a disk in the array with a spare one is as easy as:
# mdadm --manage /dev/md0 --replace /dev/sdb1 --with /dev/sdd1

Replace Raid Device
This results in the device following the --with switch being added to the RAID while the disk indicated through --replace being marked as faulty:
Check Raid Rebuild Status
Example 5: Marking an Raid array as ro or rw
After creating the array, you must have created a filesystem on top of it and mounted it on a directory in order to use it. What you probably didn’t know then is that you can mark the RAID as ro, thus allowing only read operations to be performed on it, or rw, in order to write to the device as well.
To mark the device as ro, it needs to be unmounted first:
# umount /mnt/raid1
# mdadm --manage /dev/md0 --readonly
# mount /mnt/raid1
# touch /mnt/raid1/test1
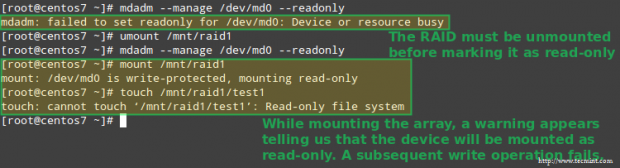
Set Permissions on Raid Array
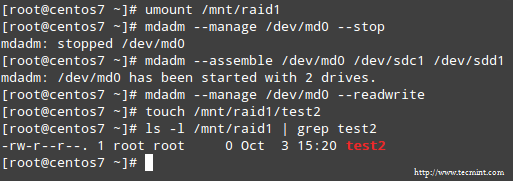
To configure the array to allow write operations as well, use the --readwrite option. Note that you will need to unmount the device and stop it before setting the rw flag:
# umount /mnt/raid1
# mdadm --manage /dev/md0 --stop
# mdadm --assemble /dev/md0 /dev/sdc1 /dev/sdd1
# mdadm --manage /dev/md0 --readwrite
# touch /mnt/raid1/test2
Allow Read Write Permission on Raid
Summary
Throughout this series we have explained how to set up a variety of software RAID arrays that are used in enterprise environments. If you followed through the articles and the examples provided in these articles you are prepared to leverage the power of software RAIDs in Linux.
Source