Docker is an open-source, powerful, secure, reliable and efficient container platform that enables realistic independence between applications and infrastructure. It is being widely adopted by IT and cloud companies out there, to easily to create, deploy, and run applications.
A container is a technology for visualizing operating systems, that enables an application to be packaged with everything needed to run it, allowing it to run independently from the operating system. A container image is a self-contained, executable package of an application that includes everything needed to run it: code, runtime, system tools and libraries, as well as configurations.
We have already covered a series on Docker, that explains how to install Docker, run applications into containers and automatically build docker images with dockerfile.
In this article, we will explain how to remove docker images, containers and volumes via the docker command line tool in Linux systems.
How to Remove Docker Images
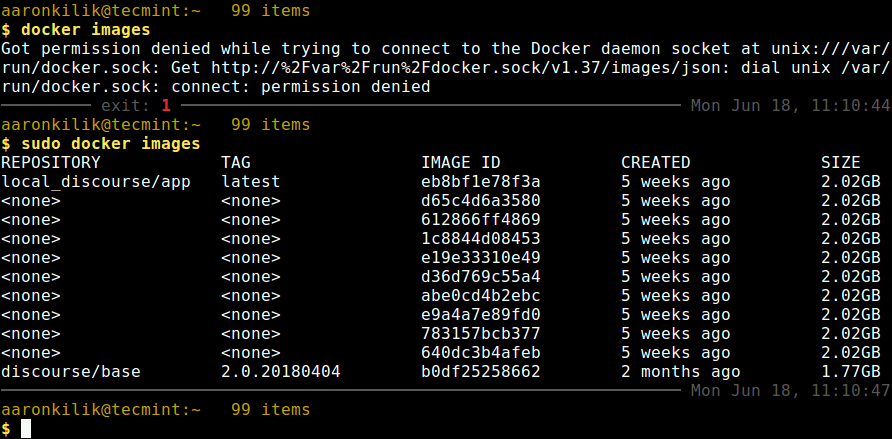
Before you remove any docker images, you can list all existing images on your system with the image management command.
$ docker image	        #list the most recently created images
OR
$ docker image -a 	#list all images
Looking at the output in the screenshot that follows, we have some images without a tag (showing instead), these are referred to as “dangling images”. They no longer have any relationship to any tagged images; they are not useful anymore and only consume disk space.
List Docker Images
You can remove one or more old or unused Docker images using the image ID, for example (where d65c4d6a3580 is the image ID).
$ docker rmi d65c4d6a3580 				#remove a single image
$ docker rmi 612866ff4869 e19e33310e49 abe0cd4b2ebc	#remove multiple images
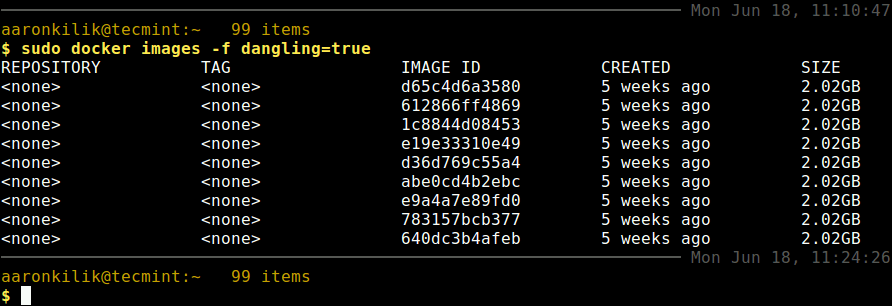
You can list dangling images (untagged images) using the -f filter flag as shown.
$ docker images -f dangling=true
List Dangling Docker Images
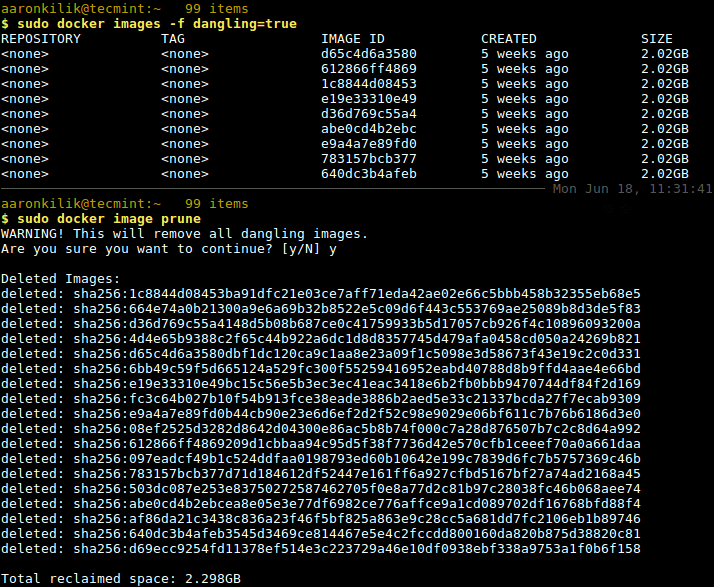
To remove all dangling images, allowing you to reclaim wasted disk space, use any of these commands.
To stop and remove all containers, use the following commands.
$ docker stop $(docker ps -a -q)	#stop all containers
$ docker container prune		#interactively remove all stopped containers
OR
$ docker rm $(docker ps -qa)
How To Remove Docker Volumes
As before, begin by listing all docker volumes on your system with the volume management command as shown.
$ docker volume ls
To remove one or more volumes, use the following command (note that you can’t remove a volume that is in use by a container).
$ docker volume rm volume_ID 	           #remove a single volume
$ docker volume rm volume_ID1 volume_ID2   #remove multiple volumes
Use the -f flag to force the removal of one or more volumes.
$ docker volume rm -f volume_ID
To remove dangling volumes, use the following command.
$ docker volume rm $(docker volume ls -q --filter dangling=true)
To remove all unused local volumes, run the following command. This will remove volumes interactively.
$ docker volume prune
How to Remove Unused or Dangling Images, Containers, Volumes, and Networks
You can delete all dangling and unreferenced data such as containers stopped, images without containers, with this single command. By default, volumes are not removed, to prevent vital data from being deleted if there is currently no container using the volume.
$ docker system prune
To prune volumes, simply add the --volumes flag to the below command as shown.
$ docker system prune --volumes
Note: In order to run the docker command line tool without the sudo command, you need to add a user to docker group, for instance.
$ sudo usermod -a -G docker aaronkilik
For more information, see the help page for the above docker object management commands.
$ docker help
$ docker image help
$ docker container help
$ docker volume help
That’s all for now! In this article, we have explained how to remove docker images, containers and volumes via the docker command line tool. If you have any questions or thoughts to share, use the feedback form below to reach us.
When Docker containers are created, the system automatically assign a universally unique identifier (UUID) number to each container to avoid any naming conflicts and improve automation without human involvement.
In this article, we will explain how to easily identify Docker containers and name or rename containers in Linux.
By default, docker uses three ways to identify a container, namely:
UUID long identifier e.g “21fbb152a940a37e816a442e6b09022e26b78ccd5a8eb4fcf91efeb559425c8c”.
UUID short identifier e.g “21fbb152a940a37”.
name e.g discourse_app.
Note that if no name is specified, by default, the the Docker daemon assigns containers a UUID long identifier; it generates a random string as a name.
How to Name a Docker Container
You can assign memorable names to your docker containers when you run them, using the --name flag as follows. The -d flag tells docker to run a container in detached mode, in the background and print the new container ID.
$ sudo docker run -d --name discourse_app local_discourse/app
Name Docker Container
To view a list of all your docker containers, run the following command.
$ sudo docker ps
List Docker Containers
From now on, every command that worked with a container_id can now be used with a name that you assigned, for example.
To rename a docker container, use the rename sub-command as shown, in the following example, we renaming the container discourse_app to a new name disc_app.
$ sudo docker rename discourse_app disc_app
After renaming a containers, confirm that it is now using the new name.
$ sudo docker ps
For more information, see the docker-run man page.
$ man docker-run
That’s all! In this article, we have expalined how to name and rename Docker containers. Use the comment form below to ask any questions or to add your thoughts to this guide.
Docker is an open-source, powerful, secure, reliable and efficient container platform that enables realistic independence between applications and infrastructure. It is being widely adopted by IT and cloud companies out there, to easily to create, deploy, and run applications.
A container is a technology for visualizing operating systems, that enables an application to be packaged with everything needed to run it, allowing it to run independently from the operating system. A container image is a self-contained, executable package of an application that includes everything needed to run it: code, runtime, system tools and libraries, as well as configurations.
We have already covered a series on Docker, that explains how to install Docker, run applications into containers and automatically build docker images with dockerfile.
In this article, we will explain how to remove docker images, containers and volumes via the docker command line tool in Linux systems.
How to Remove Docker Images
Before you remove any docker images, you can list all existing images on your system with the image management command.
$ docker image	        #list the most recently created images
OR
$ docker image -a 	#list all images
Looking at the output in the screenshot that follows, we have some images without a tag (showing instead), these are referred to as “dangling images”. They no longer have any relationship to any tagged images; they are not useful anymore and only consume disk space.
List Docker Images
You can remove one or more old or unused Docker images using the image ID, for example (where d65c4d6a3580 is the image ID).
$ docker rmi d65c4d6a3580 				#remove a single image
$ docker rmi 612866ff4869 e19e33310e49 abe0cd4b2ebc	#remove multiple images
You can list dangling images (untagged images) using the -f filter flag as shown.
$ docker images -f dangling=true
List Dangling Docker Images
To remove all dangling images, allowing you to reclaim wasted disk space, use any of these commands.
To stop and remove all containers, use the following commands.
$ docker stop $(docker ps -a -q)	#stop all containers
$ docker container prune		#interactively remove all stopped containers
OR
$ docker rm $(docker ps -qa)
How To Remove Docker Volumes
As before, begin by listing all docker volumes on your system with the volume management command as shown.
$ docker volume ls
To remove one or more volumes, use the following command (note that you can’t remove a volume that is in use by a container).
$ docker volume rm volume_ID 	           #remove a single volume
$ docker volume rm volume_ID1 volume_ID2   #remove multiple volumes
Use the -f flag to force the removal of one or more volumes.
$ docker volume rm -f volume_ID
To remove dangling volumes, use the following command.
$ docker volume rm $(docker volume ls -q --filter dangling=true)
To remove all unused local volumes, run the following command. This will remove volumes interactively.
$ docker volume prune
How to Remove Unused or Dangling Images, Containers, Volumes, and Networks
You can delete all dangling and unreferenced data such as containers stopped, images without containers, with this single command. By default, volumes are not removed, to prevent vital data from being deleted if there is currently no container using the volume.
$ docker system prune
To prune volumes, simply add the --volumes flag to the below command as shown.
$ docker system prune --volumes
Note: In order to run the docker command line tool without the sudo command, you need to add a user to docker group, for instance.
$ sudo usermod -a -G docker aaronkilik
For more information, see the help page for the above docker object management commands.
$ docker help
$ docker image help
$ docker container help
$ docker volume help
That’s all for now! In this article, we have explained how to remove docker images, containers and volumes via the docker command line tool. If you have any questions or thoughts to share, use the feedback form below to reach us.
In this 3-article series, we will discuss about Docker, is an open-source lightweight virtualization tool which runs at top of Operating System level, allowing users to create, run and deploy applications, encapsulated into small containers.
Install Docker and Learn Basic Container Manipulation – Part 1
This type of Linux containers are proven to be fast, portable and secure. The processes that run in a Docker container are always isolated from the main host, preventing outside tampering.
Part 1: Install Docker and Learn Basic Container Manipulation in CentOS and RHEL 7/6
This tutorial provides a starting point on how to install Docker, create and run Docker containers on CentOS/RHEL 7/6, but barley scratches the surface of Docker.
Step 1: Install and Configure Docker
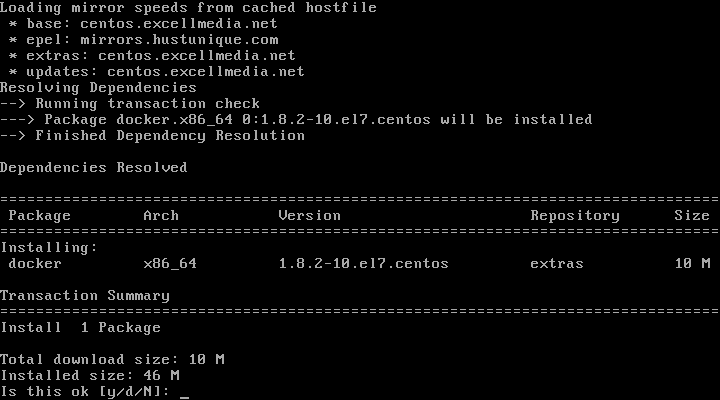
1. Docker binaries are incorporated into RHEL/CentOS 7 extras repositories, the installation process being pretty simple. Install Docker package by issuing the following command with root privileges:
Install Docker on RHEL and CentOS 7
# yum install docker
Install Docker on CentOS and RHEL 7
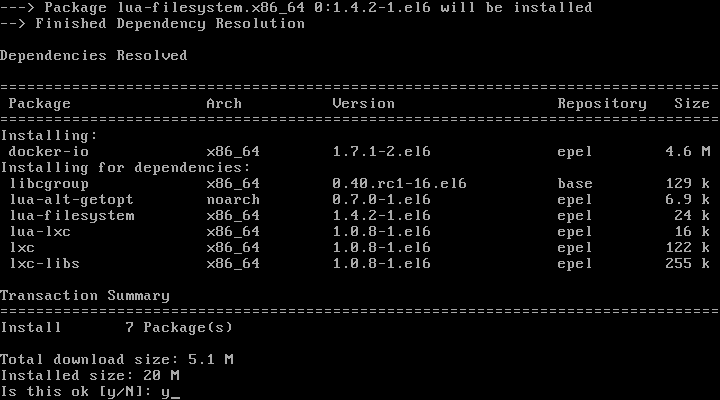
Install Docker on RHEL and CentOS 6
To install Docker, the Epel repositories must be enabled on your system by issuing the following command:
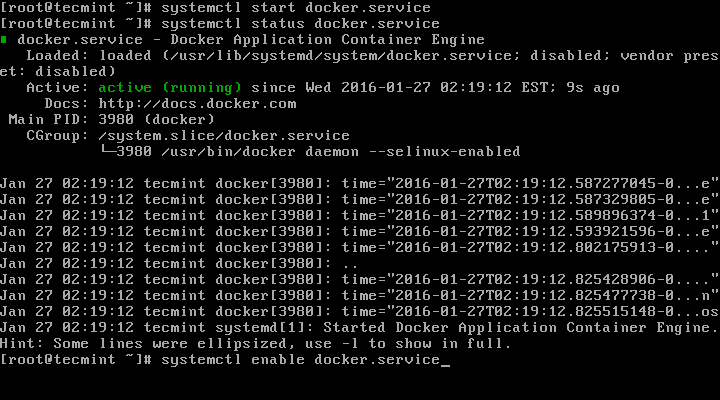
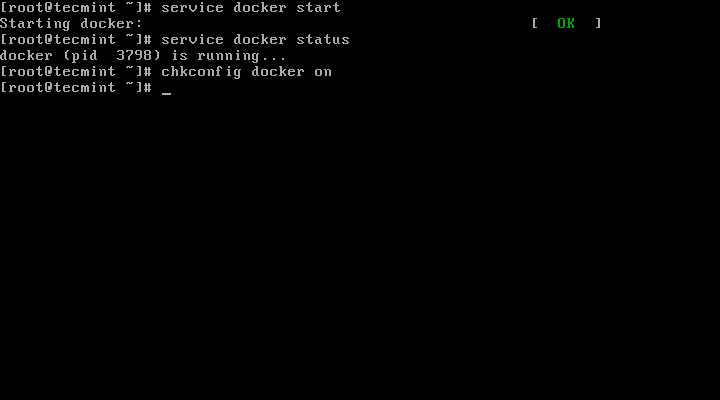
# service docker start
# service docker status
# chkconfig docker on
Enable Docker on RHEL and CentOS 6
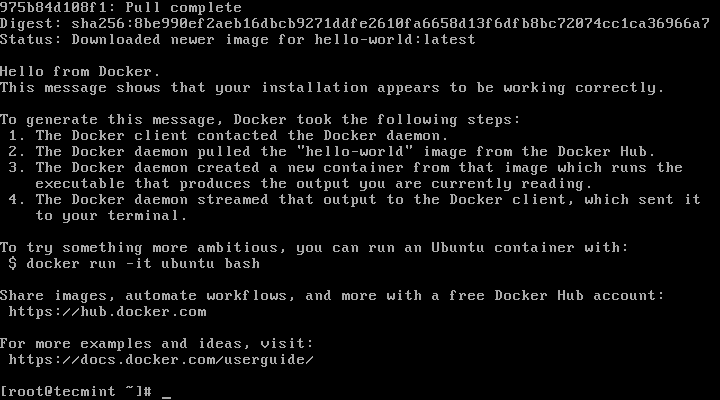
3. Finally, run a container test image to verify if Docker works properly, by issuing the following command:
# docker run hello-world
If you can see the below message, then everything is in the right place.
"Hello from Docker. This message shows that your installation appears to be working correctly."
Docker Hello World
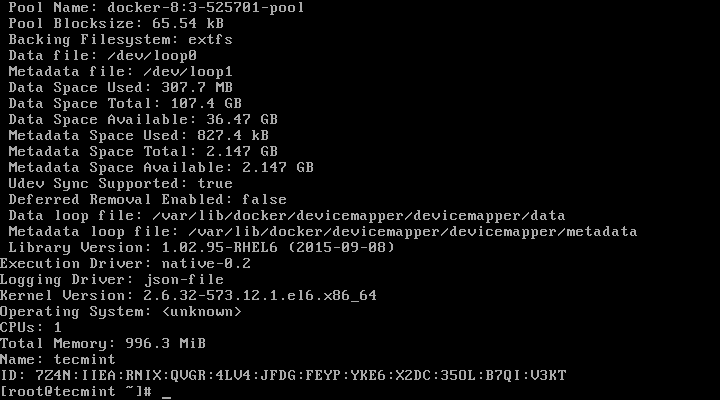
4. Now, you can run a few basic Docker commands to get some info about Docker:
For system-wide information on Docker
# docker info
Check Docker Info
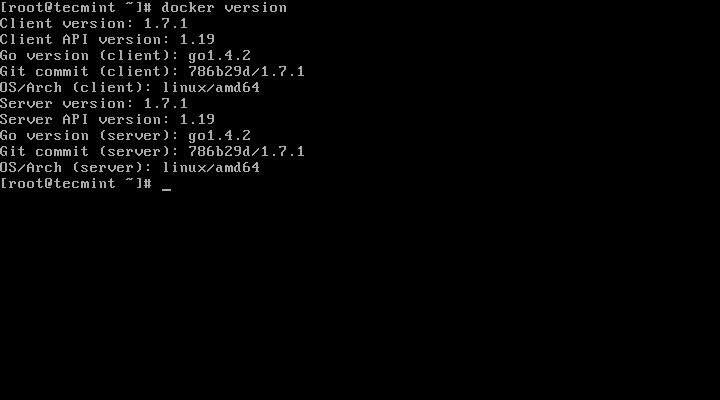
For Docker version
# docker version
Check Docker Version
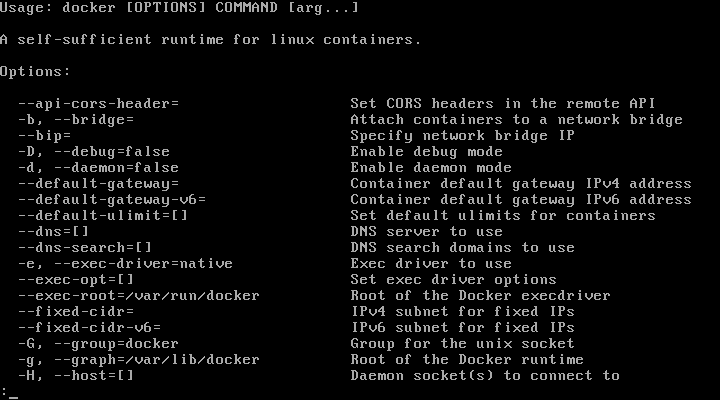
5. To get a list of all available Docker commands type docker on your console.
# docker
List Docker Commands
Step 2: Download a Docker Image
6. In order to start and run a Docker container, first an image must be downloaded from Docker Hub on your host. Docker Hub offers a great deal of free images from its repositories.
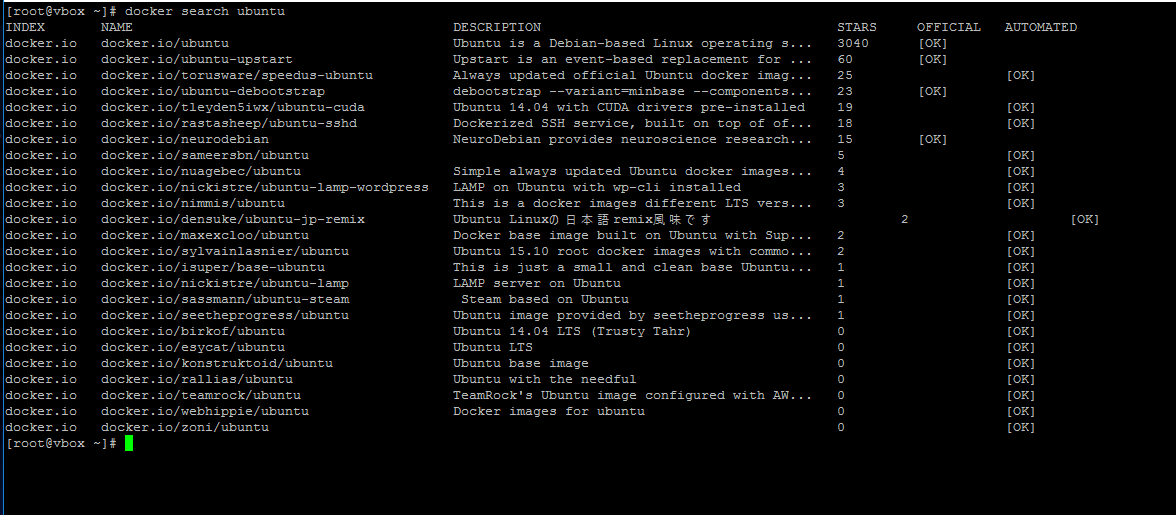
To search for a Docker image, Ubuntu for instance, issue the following command:
# docker search ubuntu
Search Docker Images
7. After you decided on what image you want to run based on your needs, download it locally by running the below command (in this case an Ubuntu image is downloaded and used):
# docker pull ubuntu
Download Docker Images
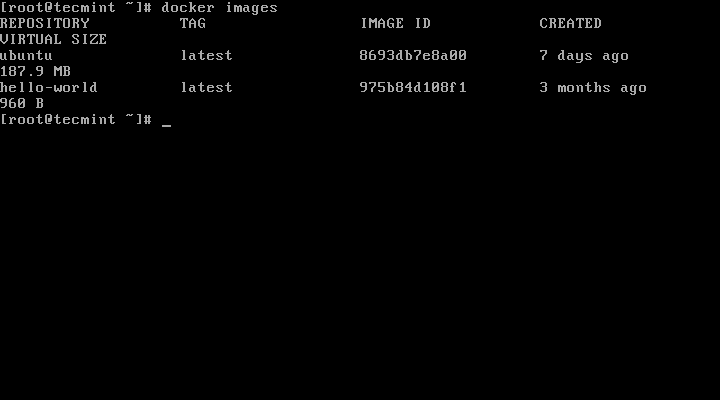
8. To list all the available Docker images on your host issue the following command:
# docker images
List Docker Images
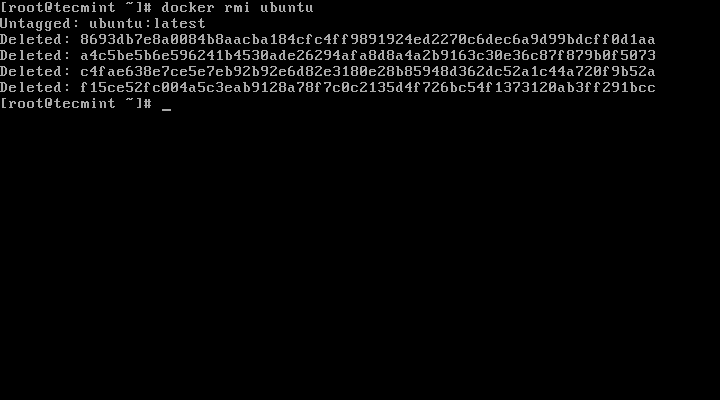
9. If you don’t need a Docker image anymore and you want to remove it from the host issue the following command:
# docker rmi ubuntu
Remove Docker Image
Step 3: Run a Docker Container
When you execute a command against an image you basically obtain a container. After the command that is executing into container ends, the container stops (you get a non-running or exited container). If you run another command into the same image again a new container is created and so on.
All the containers created will remain on the host filesystem until you choose to delete them by using the docker rm command.
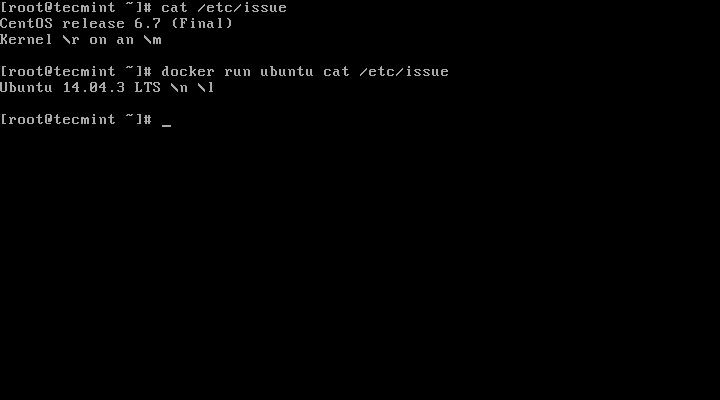
10. In order to create and run a container, you need to run a command into a downloaded image, in this case Ubuntu, so a basic command would be to display the distribution version file inside the container using cat command, as in the following example:
# docker run ubuntu cat /etc/issue
Run Docker Containers
The above command is divided as follows:
# docker run [local image] [command to run into container]
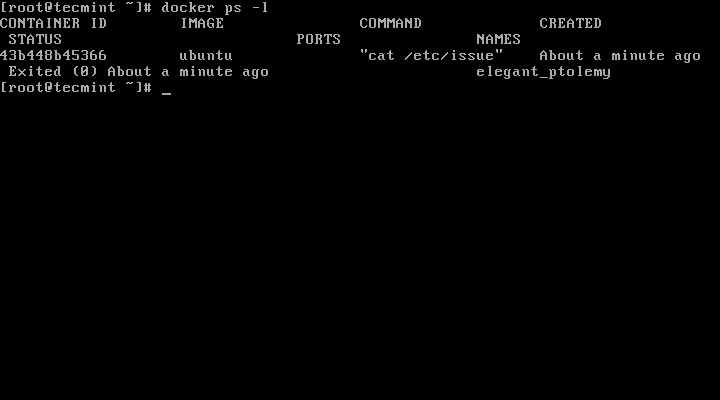
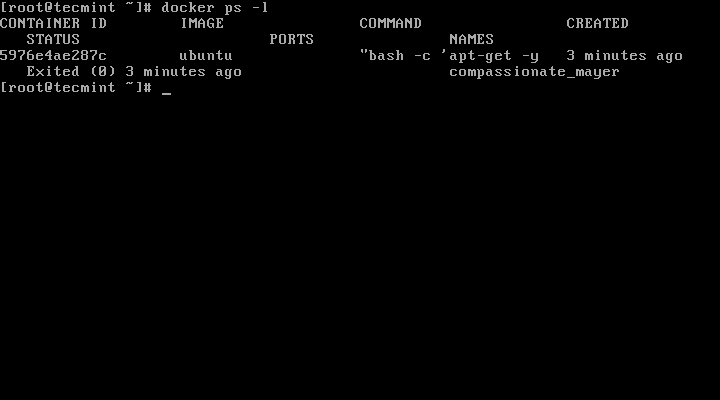
11. To run one of the containers again with the command that was executed to create it, first you must get the container ID (or the name automatically generated by Docker) by issuing the below command, which displays a list of the running and stopped (non-running) containers:
# docker ps -l
List Running Docker Containers
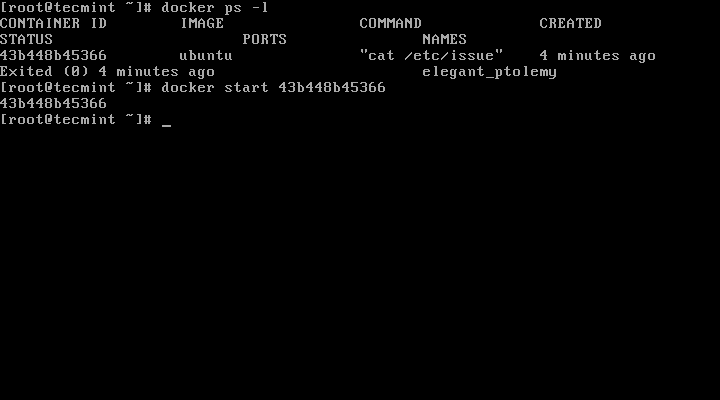
12. Once the container ID has been obtained, you can start the container again with the command that was used to create it, by issuing the following command:
# docker start c629b7d70666
Here, the string c629b7d70666 represents the container ID.
Start Docker Containers
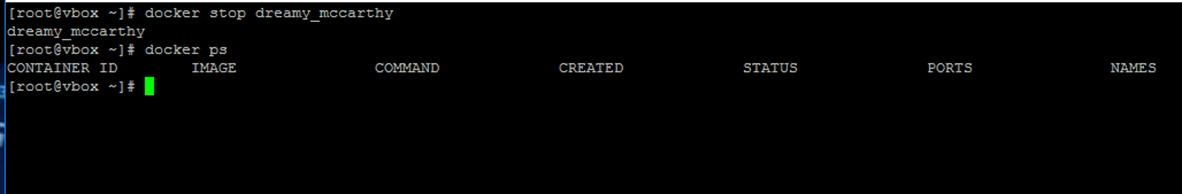
13. In case the container is running state, you can get it’s ID by issuing docker ps command. To stop the running container issue docker stop command by specifying the container ID or auto-generated name.
# docker stop dreamy_mccarthy
# docker ps
Start Stop Docker Containers
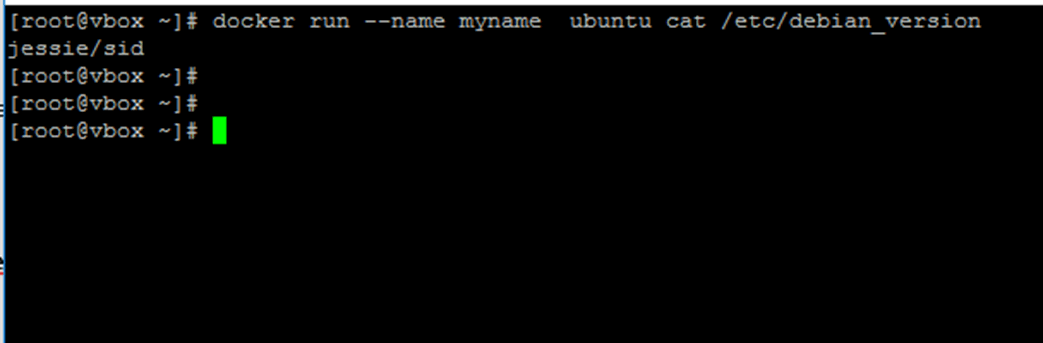
14. A more elegant alternative so you don’t have to remember the container ID would be to allocate a unique name for every container you create by using the --name option on command line, as in the following example:
# docker run --name myname ubuntu cat /etc/debian_version
Add Name to Docker Container
15. Then, using the name that you allocated for the container, you can manipulate container (start, stop, remove, top, stats) further just by addressing its name, as in the below examples:
Be aware that some of the above commands might display no output if the process of command that was used to create the container finishes. When the process that runs inside the container finishes, the container stops.
Step 4: Run an Interactive Session into a Container
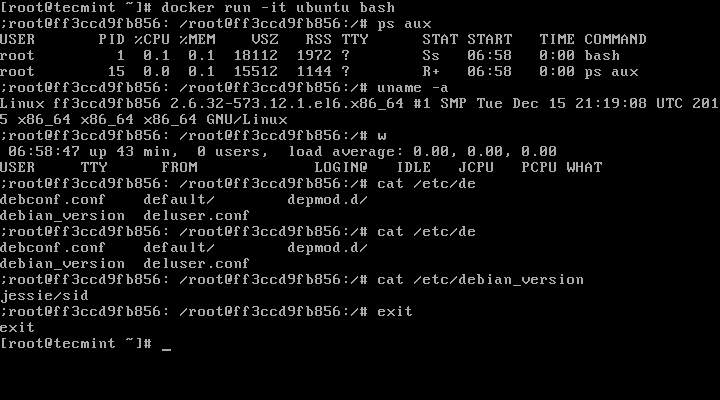
16. In order to interactively connect into a container shell session, and run commands as you do on any other Linux session, issue the following command:
# docker run -it ubuntu bash
Start Docker Container Interactive Shell
The above command is divided as follows:
-i is used to start an interactive session.
-t allocates a tty and attaches stdin and stdout.
ubuntu is the image that we used to create the container.
bash (or /bin/bash) is the command that we are running inside the Ubuntu container.
17. To quit and return to host from the running container session you must type exit command. The exitcommand terminates all the container processes and stops it.
# exit
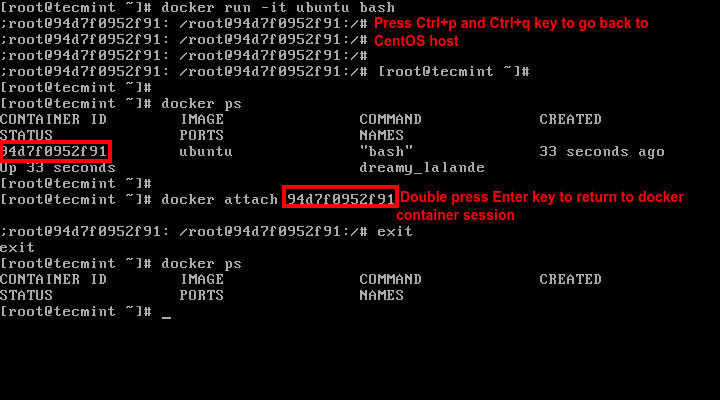
18. If you’re interactively logged on container terminal prompt and you need to keep the container in running state but exit from the interactive session, you can quit the console and return to host terminal by pressing Ctrl+p and Ctrl+q keys.
Keep Docker Shell Session Active
19. To reconnect to the running container you need the container ID or name. Issue docker ps command to get the ID or name and, then, run docker attach command by specifying container ID or name, as illustrated in the image above:
# docker attach <container id>
20. To stop a running container from the host session issue the following command:
# docker kill <container id>
That’s all for basic container manipulation. In the next tutorial we will discuss how to save, delete and run a web server into a Docker container.
Following the previous Docker article, this tutorial will discuss how to save a Docker container into a new image, remove a container and run a Nginx web server inside a container.
Install and Run Applications in Docker Containers – Part 2
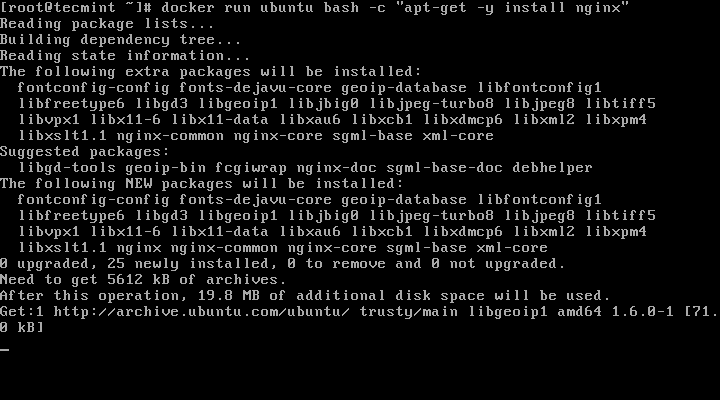
1. In this example we will run and save an Ubuntu based Docker container where Nginx server will be installed. But before committing any changes to container, first start the container with the below command which installs Nginx daemon into Ubuntu image:
# docker run ubuntu bash -c "apt-get -y install nginx"
Install Nginx on Ubuntu Docker Container
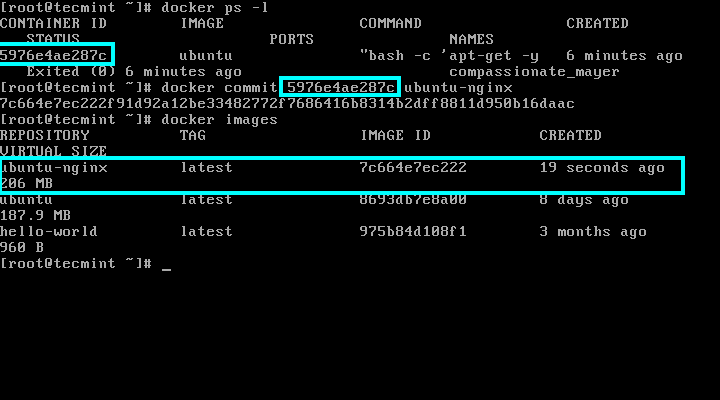
2. Next, after Nginx package is installed, issue the command docker ps -l to get the ID or name of the running container.
# docker ps -l
Find Docker Container ID Name
And apply changes by running the below command:
# docker commit 5976e4ae287c ubuntu-nginx
Here, 5976e4ae287c represents the container ID and ubuntu-nginx represents the name of the newly image that has been saved with committed changes.
In order to view if the new image has been successfully created just run docker images command and a listing of all saved images will be shown.
# docker images
Docker Container Changes
Chances are that the installation process inside the container finishes fast which leads to a non-running container (container is stopped). In this case the docker ps command won’t show any output because no container is running.
In order to be able to still get the container’s id run docker ps -a | head -3 to output the most recent containers and identify the container based on the command issued to create the container and the exited status.
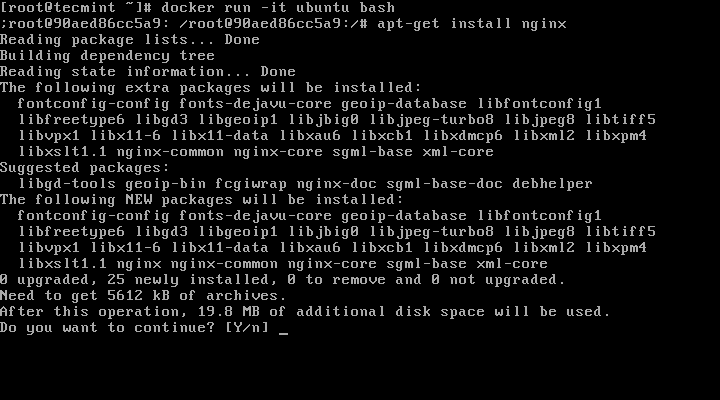
3. Alternatively, you can actively enter container session by running docker run -it ubuntu bashcommand and execute further apt-get install nginx command. While the command is running, detach from the container using Ctrl-p + Ctrl-q keys and the container will continue running even if the Nginx installation process finishes.
# docker run -it ubuntu bash
# apt-get install nginx
Install Nginx on Docker Container
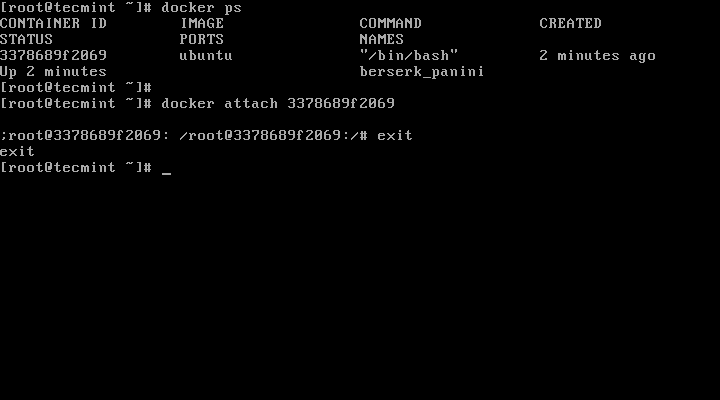
Then, get the running container id with docker ps and commit changes. When finished, re-enter to container console using docker attach and type exit to stop container.
# docker ps
# docker attach 3378689f2069
# exit
Attach Docker Container
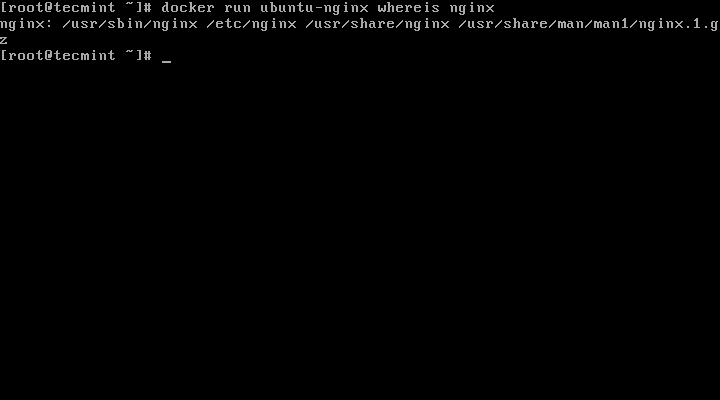
4. To further test if the recently image has been committed properly (in this case Nginx service has been installed), execute the below command in order to generate a new container which will output if Nginx binary was successfully installed:
# docker run ubuntu-nginx whereis nginx
Generate New Docker Container
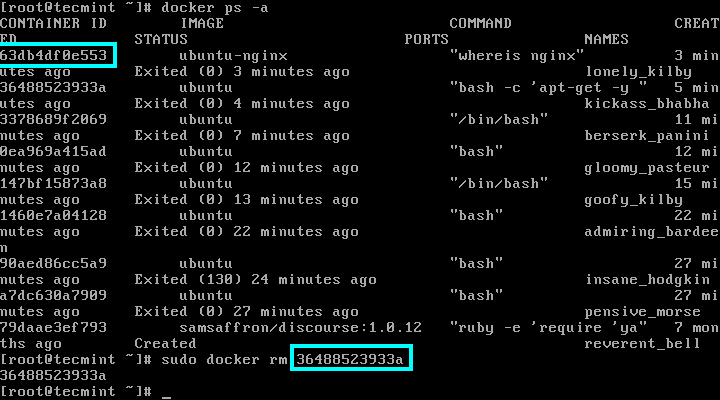
5. To remove a container use the rm command against a container ID or name, which can be obtained using docker ps -a command:
# docker ps -a
# sudo docker rm 36488523933a
Remove Docker Container
How to Run Nginx inside Docker Container
6. In this part we will concentrate on how you can run and access a network service, such as a Nginx web server, inside Docker, using the ubuntu-nginx image created earlier where Nginx daemon was installed.
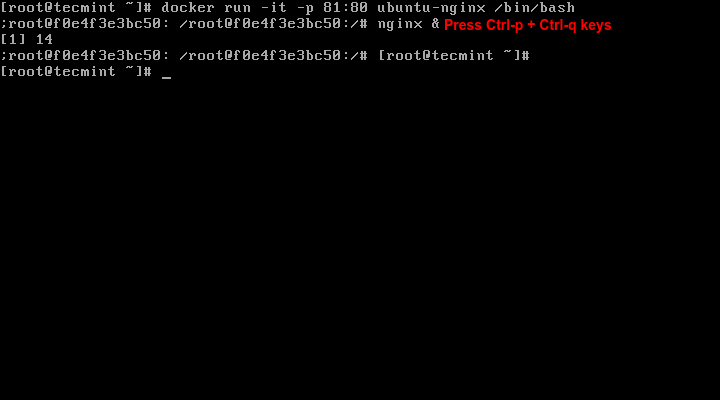
The first thing that you need to do is to create a new container, map host-container ports and enter container shell by issuing the below command:
Here, the -p option exposes the host port to container port. While the host port can be arbitrary, with the condition that it should be available (no other host services should listen on it), the container port must be exactly the port that the inside daemon is listening to.
Once you’re connected to container session, start Nginx daemon in background and detach from container console by pressing Ctrl-p + Ctrl-q keys.
Run Nginx Inside Docker Container
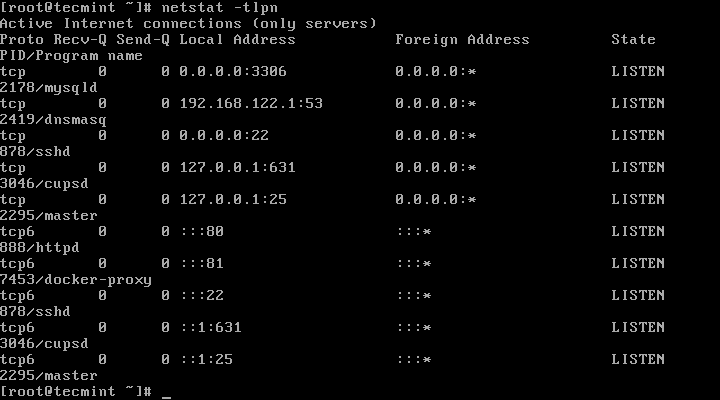
7. Now, run docker ps to get the state of your running container. You can also view host network sockets by issuing the following command:
# docker ps
OR
# netstat -tlpn
View Docker Container Running State
8. In order to visit the page served by the Nginx container, open a browser from a remote location in your LAN and type the IP address of your machine using the HTTP protocol.
Verify Nginx Running under Docker Container
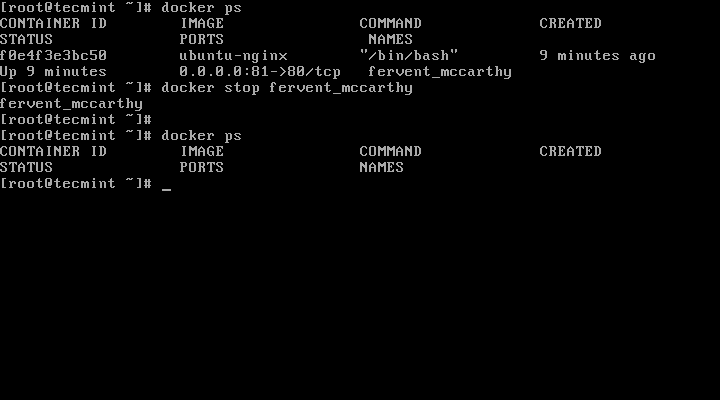
9. To stop the container run the following command followed by container ID or name:
As alternative to stop the running container, enter container shell command prompt and type exit to finish process:
# docker attach fervent_mccarthy
# exit
Be aware that using this kind of containers to run web servers or other kind of services are best suited only for development purposes or tests due to the fact that the services are only active while the container is running. Exiting the container disrupts all running services or any changes made.
This tutorial will concentrate on how to build a custom Docker image based on Ubuntu with Apache service installed. The whole the process will be automated using a Dockerfile.
Build Configure Docker Images with Dockerfile – Part 3
Docker images can be automatically build form text files, named Dockerfiles. A Docker file contains step-by-step ordered instructions or commands used to create and configure a Docker image.
Basically, a Docker file contains various instructions in order to build and configure a specific container based on your requirements. The following instructions are the most used, some of them being mandatory:
FROM = Mandatory as first instruction in a Docker file. Instructs Docker to pull the base image from which you are building the new image. Use a tag to specify the exact image from which you are building:
Ex: FROM ubuntu:14.04
MAINTAINER = Author of the build image
RUN = This instruction can be used on multiple lines and runs any commands after Docker image has been created.
CMD = Run any command when Docker image is started. Use only one CMD instruction in a Dockerfile.
ENTRYPOINT = Same as CMD but used as the main command for the image.
EXPOSE = Instructs the container to listen on network ports when running. The container ports are not reachable from the host by default.
ENV = Set container environment variables.
ADD = Copy resources (files, directories or files from URLs).
Step 1: Creating or Writing Dockerfile Repository
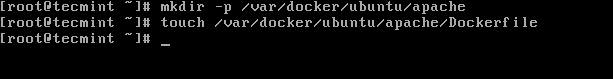
1. First, let’s create some kind of Dockerfile repositories in order to reuse files in future to create other images. Make an empty directory somewhere in /var partition where we will create the file with the instructions that will be used to build the newly Docker image.
2. Next, start editing the file with the following instructions:
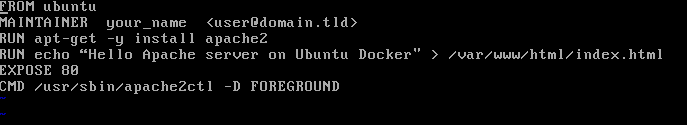
# vi /var/docker/ubuntu/apache/Dockerfile
Dokerfile excerpt:
FROM ubuntu
MAINTAINER  your_name  <user@domain.tld>
RUN apt-get -y install apache2
RUN echo “Hello Apache server on Ubuntu Docker” > /var/www/html/index.html
EXPOSE 80
CMD /usr/sbin/apache2ctl -D FOREGROUND
Dockerfile Repository
Now, let’s go through the file instructions:
The first line tells us that we are building from an Ubuntu image. If no tag is submitted, say 14:10 for example, the latest image from Docker Hub is used.
On the second line we’ve added the name and email of the image creator. Next two RUN lines will be executed in the container when building the image and will install Apache daemon and echo some text into default apache web page.
The EXPOSE line will instruct Docker container to listen on port 80, but the port will be not available to outside. The last line instructs the container to run Apache service in foreground after the container is started.
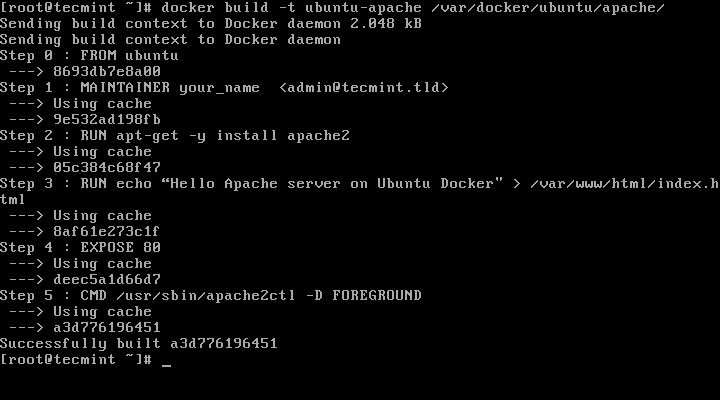
3. The last thing we need to do is to start creating the image by issuing the below command, which will locally create a new Docker image named ubuntu-apache based on the Dockerfile created earlier, as shown in this example:
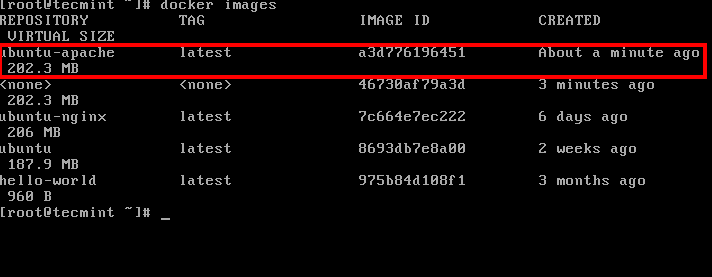
4. After the image has been created by Docker, you can list all available images and identify your image by issuing the following command:
# docker images
List All Docker Images
Step 2: Run the Container and Access Apache from LAN
5. In order to run the container continuously (in background) and access the container exposed services (ports) from the host or other remote machine in your LAN, run the below command on your host terminal prompt:
# docker run -d -p 81:80 ubuntu-apache
Run Docker Container Image
Here, the -d option runs the ubuntu-apache container in background (as a daemon) and the -p option maps the container port 80 to your localhost port 81. Outside LAN access to Apache service can be reached through port 81 only.
Netstat command will give you an idea about what ports the host is listening to.
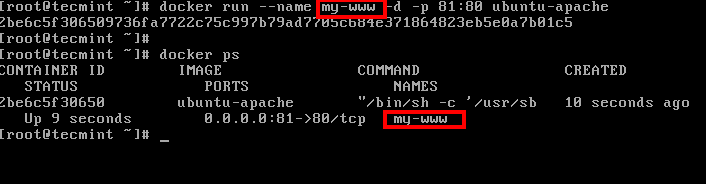
After the container has been started, you can also run docker ps command to view the status of the running container.
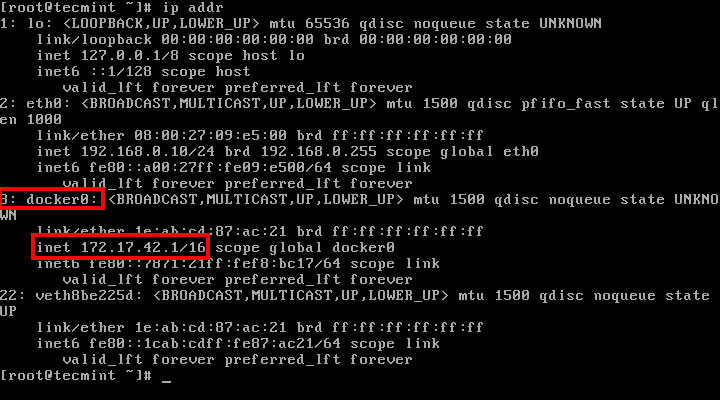
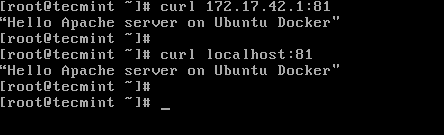
6. The webpage can be displayed on your host from command line using curl utility against your machine IP Address, localhost or docker net interface on port 81. Use ip command line to show network interface IP addresses.
# ip addr               [List nework interfaces]
# curl ip-address:81    [System Docker IP Address]
# curl localhost:81     [Localhost]
Check Docker Network Interface and IP Address
Check Docker Apache Webpage
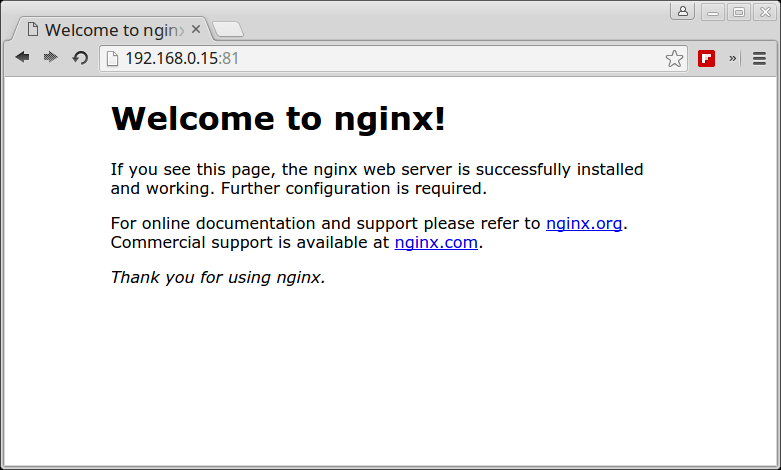
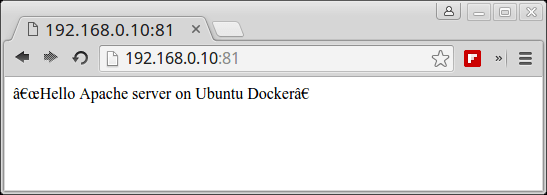
7. To visit the container webpage from your network, open a browser at remote location and use HTTP protocol, the IP Address of the machine where the container is running, followed by port 81 as illustrated on below image.
http://ip-address:81
Check Docker Container Apache Page
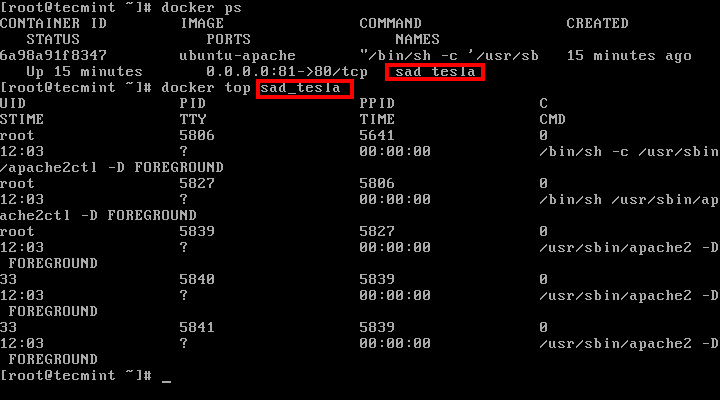
8. To get an inside of what processes are running inside the container issue the following command:
# docker ps
# docker top <name or ID of the container>
Check Running Docker Processes
9. To stop the container issue docker stop command followed by the container ID or name.
# docker stop <name or ID of the container>
# docker ps
10. In case you want to assign a descriptive name for the container use the --name option as shown in the below example:
12. After you finish editing the file, close it, reload the systemd daemon to reflect changes and start the container by issuing the following commands:
This was just a simple example on what you can do with a simple Dockerfile but you can pre-build some pretty sophisticated applications that you can fire-up in just a matter of seconds with minimal resources and effort.
ctop – Top-like Interface for Monitoring Docker Containers
ctop is a free open source, simple and cross-platform top-like command-line tool for monitoring container metrics in real-time. It allows you to get an overview of metrics concerning CPU, memory, network, I/O for multiple containers and also supports inspection of a specific container.
Docker Container Monitoring
At the time of writing this article, it ships with built-in support for Docker (default container connector) and runC; connectors for other container and cluster platforms will be added in future releases.
How to Install ctop in Linux Systems
Installing the latest release of ctop is as easy as running the following commands to download the binary for your Linux distribution and install it under /usr/local/bin/ctop and make it executable to run it.
Alternatively, install ctop via Docker using following command.
$ docker run --rm -ti --name=ctop -v /var/run/docker.sock:/var/run/docker.sock quay.io/vektorlab/ctop:latest
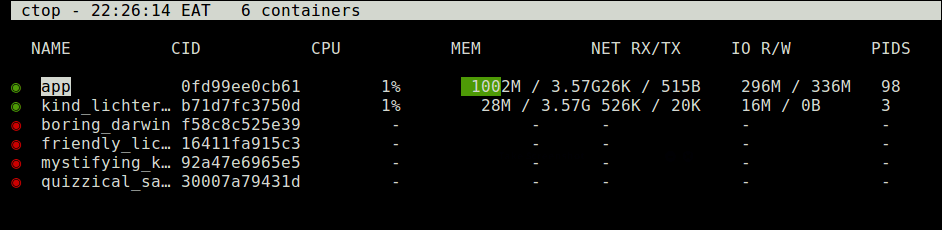
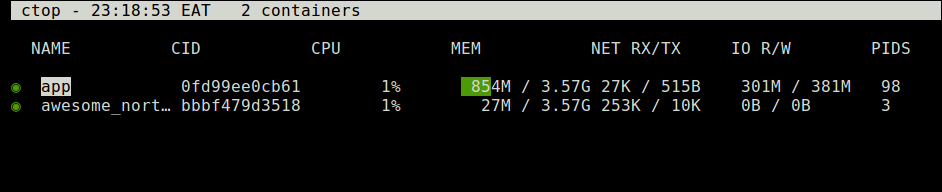
Once you have installed ctop, you can run it to list all your containers whether active or not.
$ ctop
Monitor Docker Containers
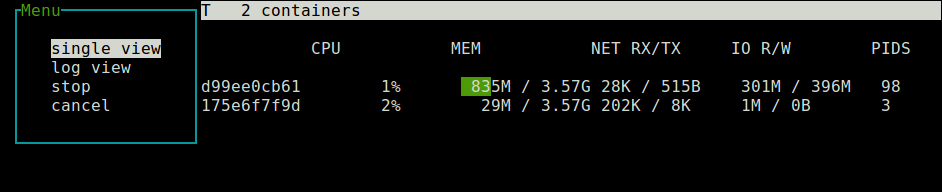
You can use the Up and Down arrow keys to highlight a container and click Enter to select it. You will see a menu as shown in the following screenshot. Choose “single view” and click on it to inspect the selected container.
Monitor Single Docker Container
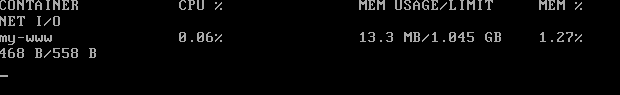
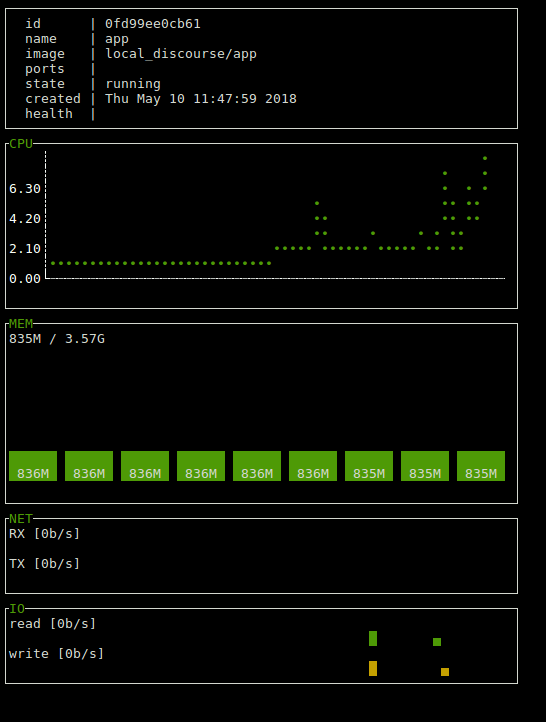
The following screenshot shows the single view mode for a specific container.
Inspect a Single Container
To display active containers only, use the -a flag.
$ ctop -a
Check Active Docker Container
To display CPU as % of system total, use the -scale-cpu option.
$ ctop -scale-cpu
You can also filter containers using the -f flag, for example.
$ ctop -f app
Additionally, you can select initial container sort field using the -s flag, and see the ctop help message as shown.
$ ctop -h
Note that connectors for other container and cluster systems are yet to be added to ctop. You can find more information from the Ctop Github repository.
ctop is a simple top-like tool for visualizing and monitoring container metrics in real-time. In this article, we’ve expalined how to install and use ctop in Linux. You can share your thoughts or ask any questions via the comment form below.
Docker is an open source and popular operating system-level virtualization (commonly known as “containerization”) technology that primarily runs on Linux and Windows. Docker makes it easier to create, deploy, and run applications by using containers.
With containers, developers (and system administrators) can package up an application with everything needed to run the application – the code, a run-time, libraries, environment variables, and configuration files, and ship it all out as one package. Yes, it’s that great!
In this article, we will show you how to install Docker CE (Community Edition), create and run Docker containers on Ubuntu distribution.
Installing Docker CE (Community Edition) in Ubuntu
1. To install Docker CE, first, you need to remove older versions of Docker were called docker, docker.io, or docker-engine from the system using the following command.
Reading package lists... Done
Building dependency tree
Reading state information... Done
The following additional packages will be installed:
  aufs-tools cgroupfs-mount pigz
The following NEW packages will be installed:
  aufs-tools cgroupfs-mount containerd.io docker-ce docker-ce-cli pigz
0 upgraded, 6 newly installed, 0 to remove and 167 not upgraded.
Need to get 50.7 MB of archives.
After this operation, 243 MB of additional disk space will be used.
Do you want to continue? [Y/n] y
Get:1 http://archive.ubuntu.com/ubuntu bionic/universe amd64 pigz amd64 2.4-1 [57.4 kB]
Get:2 https://download.docker.com/linux/ubuntu bionic/stable amd64 containerd.io amd64 1.2.4-1 [19.9 MB]
Get:3 http://archive.ubuntu.com/ubuntu bionic/universe amd64 aufs-tools amd64 1:4.9+20170918-1ubuntu1 [104 kB]
Get:4 http://archive.ubuntu.com/ubuntu bionic/universe amd64 cgroupfs-mount all 1.4 [6,320 B]
Get:5 https://download.docker.com/linux/ubuntu bionic/stable amd64 docker-ce-cli amd64 5:18.09.3~3-0~ubuntu-bionic [13.1 MB]
Get:6 https://download.docker.com/linux/ubuntu bionic/stable amd64 docker-ce amd64 5:18.09.3~3-0~ubuntu-bionic [17.4 MB]
Fetched 50.7 MB in 7s (7,779 kB/s)
...
4. After successfully installing the Docker CE package, the service should be auto-started and auto-enabled to start at system boot, you can check its status using the following command.
$ sudo systemctl status docker
Checking Docker CE Status
● docker.service - Docker Application Container Engine
   Loaded: loaded (/lib/systemd/system/docker.service; enabled; vendor preset: enabled)
   Active: active (running) since Wed 2019-03-06 08:06:42 UTC; 2min 18s ago
     Docs: https://docs.docker.com
 Main PID: 5274 (dockerd)
    Tasks: 8
   CGroup: /system.slice/docker.service
           └─5274 /usr/bin/dockerd -H fd:// --containerd=/run/containerd/containerd.sock

Mar 06 08:06:41 tecmint dockerd[5274]: time="2019-03-06T08:06:41.562587408Z" level=warning msg="Your kernel does not support cgroup rt runtime"
Mar 06 08:06:41 tecmint dockerd[5274]: time="2019-03-06T08:06:41.562767803Z" level=warning msg="Your kernel does not support cgroup blkio weight"
Mar 06 08:06:41 tecmint dockerd[5274]: time="2019-03-06T08:06:41.562966844Z" level=warning msg="Your kernel does not support cgroup blkio weight_device"
Mar 06 08:06:41 tecmint dockerd[5274]: time="2019-03-06T08:06:41.565298457Z" level=info msg="Loading containers: start."
Mar 06 08:06:41 tecmint dockerd[5274]: time="2019-03-06T08:06:41.950942467Z" level=info msg="Default bridge (docker0) is assigned with an IP address 172.17.0.0/16. Daemon option --bip can be used to set a prefer
Mar 06 08:06:42 tecmint dockerd[5274]: time="2019-03-06T08:06:42.036964493Z" level=info msg="Loading containers: done."
Mar 06 08:06:42 tecmint dockerd[5274]: time="2019-03-06T08:06:42.156279378Z" level=info msg="Docker daemon" commit=774a1f4 graphdriver(s)=overlay2 version=18.09.3
Mar 06 08:06:42 tecmint dockerd[5274]: time="2019-03-06T08:06:42.157145045Z" level=info msg="Daemon has completed initialization"
Mar 06 08:06:42 tecmint systemd[1]: Started Docker Application Container Engine.
Mar 06 08:06:42 tecmint dockerd[5274]: time="2019-03-06T08:06:42.224229999Z" level=info msg="API listen on /var/run/docker.sock"
5. Finally, verify that Docker CE is installed properly by running the hello-world image.
$ sudo docker run hello-world
Verify Docker CE Installation
Hello from Docker!
This message shows that your installation appears to be working correctly.

To generate this message, Docker took the following steps:
 1. The Docker client contacted the Docker daemon.
 2. The Docker daemon pulled the "hello-world" image from the Docker Hub.
    (amd64)
 3. The Docker daemon created a new container from that image which runs the
    executable that produces the output you are currently reading.
 4. The Docker daemon streamed that output to the Docker client, which sent it
    to your terminal.

To try something more ambitious, you can run an Ubuntu container with:
 $ docker run -it ubuntu bash

Share images, automate workflows, and more with a free Docker ID:
 https://hub.docker.com/

For more examples and ideas, visit:
 https://docs.docker.com/get-started/
Learn Basic Docker Commands in Ubuntu
6. To get information about Docker, run the following command.
7. To get information about Docker version, run the following command.
$ sudo docker version

Client:
 Version:           18.09.3
 API version:       1.39
 Go version:        go1.10.8
 Git commit:        774a1f4
 Built:             Thu Feb 28 06:53:11 2019
 OS/Arch:           linux/amd64
 Experimental:      false

Server: Docker Engine - Community
 Engine:
  Version:          18.09.3
  API version:      1.39 (minimum version 1.12)
  Go version:       go1.10.8
  Git commit:       774a1f4
  Built:            Thu Feb 28 05:59:55 2019
  OS/Arch:          linux/amd64
  Experimental:     false
8. To get a list of all available Docker commands run docker on your terminal.
$ docker

Usage:	docker [OPTIONS] COMMAND

A self-sufficient runtime for containers

Options:
      --config string      Location of client config files (default "/home/tecmint/.docker")
  -D, --debug              Enable debug mode
  -H, --host list          Daemon socket(s) to connect to
  -l, --log-level string   Set the logging level ("debug"|"info"|"warn"|"error"|"fatal") (default "info")
      --tls                Use TLS; implied by --tlsverify
      --tlscacert string   Trust certs signed only by this CA (default "/home/tecmint/.docker/ca.pem")
      --tlscert string     Path to TLS certificate file (default "/home/tecmint/.docker/cert.pem")
      --tlskey string      Path to TLS key file (default "/home/tecmint/.docker/key.pem")
      --tlsverify          Use TLS and verify the remote
  -v, --version            Print version information and quit

Management Commands:
  builder     Manage builds
  config      Manage Docker configs
  container   Manage containers
  engine      Manage the docker engine
  image       Manage images
  network     Manage networks
  node        Manage Swarm nodes
  plugin      Manage plugins
  secret      Manage Docker secrets
  service     Manage services
  stack       Manage Docker stacks
  swarm       Manage Swarm
  system      Manage Docker
  trust       Manage trust on Docker images
  volume      Manage volumes
....
Download a Docker Image in Ubuntu
9. To run a Docker container, first, you need to download an image from Docker Hub – provides free images from its repositories.
For example, to download a Docker image called CentOS 7, issue the following command.
$ sudo docker search centos

NAME                               DESCRIPTION                                     STARS               OFFICIAL            AUTOMATED
centos                             The official build of CentOS.                   5227                [OK]
ansible/centos7-ansible            Ansible on Centos7                              120                                     [OK]
jdeathe/centos-ssh                 CentOS-6 6.10 x86_64 / CentOS-7 7.5.1804 x86…   107                                     [OK]
consol/centos-xfce-vnc             Centos container with "headless" VNC session…   81                                      [OK]
imagine10255/centos6-lnmp-php56    centos6-lnmp-php56                              50                                      [OK]
centos/mysql-57-centos7            MySQL 5.7 SQL database server                   47
tutum/centos                       Simple CentOS docker image with SSH access      43
gluster/gluster-centos             Official GlusterFS Image [ CentOS-7 +  Glust…   40                                      [OK]
openshift/base-centos7             A Centos7 derived base image for Source-To-I…   39
centos/postgresql-96-centos7       PostgreSQL is an advanced Object-Relational …   37
centos/python-35-centos7           Platform for building and running Python 3.5…   33
kinogmt/centos-ssh                 CentOS with SSH                                 26                                      [OK]
openshift/jenkins-2-centos7        A Centos7 based Jenkins v2.x image for use w…   20
centos/php-56-centos7              Platform for building and running PHP 5.6 ap…   19
pivotaldata/centos-gpdb-dev        CentOS image for GPDB development. Tag names…   10
openshift/wildfly-101-centos7      A Centos7 based WildFly v10.1 image for use …   6
openshift/jenkins-1-centos7        DEPRECATED: A Centos7 based Jenkins v1.x ima…   4
darksheer/centos                   Base Centos Image -- Updated hourly             3                                       [OK]
pivotaldata/centos                 Base centos, freshened up a little with a Do…   2
pivotaldata/centos-mingw           Using the mingw toolchain to cross-compile t…   2
pivotaldata/centos-gcc-toolchain   CentOS with a toolchain, but unaffiliated wi…   1
openshift/wildfly-81-centos7       A Centos7 based WildFly v8.1 image for use w…   1
blacklabelops/centos               CentOS Base Image! Built and Updates Daily!     1                                       [OK]
smartentry/centos                  centos with smartentry                          0                                       [OK]
jameseckersall/sonarr-centos       Sonarr on CentOS 7                              0                                       [OK]
10. After you determined on what image you want to run based on your requirements, download it locally by running the below command (in this case a CentOS image is downloaded and used).
$ docker pull centos

Using default tag: latest
latest: Pulling from library/centos
a02a4930cb5d: Pull complete
Digest: sha256:184e5f35598e333bfa7de10d8fb1cebb5ee4df5bc0f970bf2b1e7c7345136426
Status: Downloaded newer image for centos:latest
11. To list all the available Docker images on your host run the following command.
$ sudo docker images

REPOSITORY          TAG                 IMAGE ID            CREATED             SIZE
hello-world         latest              fce289e99eb9        2 months ago        1.84kB
centos              latest              1e1148e4cc2c        3 months ago        202MB
12. If you don’t want a Docker image anymore and you can remove it using the following command.
13. In order to create and run a Docker container, first you need to run a command into a downloaded CentOSimage, so a basic command would be to check the distribution version file inside the container using cat command, as shown.
$ docker run centos cat /etc/issue
14. To run the containers again, first you need to get the Container ID or Name by running the following command, which will display a list of the running and stopped containers:
$ sudo docker ps -l

CONTAINER ID        IMAGE               COMMAND             CREATED              STATUS                          PORTS               NAMES
0ddfa81c5779        centos              "cat /etc/issue"    About a minute ago   Exited (0) About a minute ago                       elastic_shirley
15. Once the Container ID or Name has been acquired, you can start the container using the following command:
17. A more better way, so that you don’t have to remember the container ID would be to define a unique name for each container you create by using the --name option as shown.
$ docker run --name myname centos cat /etc/issue
18. In order to connect and run Linux commands into a container issue the following command.
$ docker run -it centos bash

[root@6213ec547863 /]# uname -a
Linux 6213ec547863 5.0.0-050000-generic #201903032031 SMP Mon Mar 4 01:33:18 UTC 2019 x86_64 x86_64 x86_64 GNU/Linux
[root@6213ec547863 /]# cat /etc/redhat-release
CentOS Linux release 7.6.1810 (Core)
19. To quit and back to host from the running container session you must type exit command as shown.
$ exit
That’s all for basic container manipulation. If you have any questions or comments about this article, use the feedback form below to reach us.
Ansible is an open source, powerful automation software for configuring, managing and deploying software applications on the nodes without any downtime just by using SSH. Today, most of the IT Automation tools runs as a agent in remote host, but ansible just need a SSH connection and Python (2.4 or later) to be installed on the remote nodes to perform it’s action.
Install Ansible in Linux
How Ansible Works?
There are many similar automation tools available like Puppet, Capistrano, Chef, Salt, Space Walk etc, but Ansible categorize into two types of server: controlling machines and nodes.
The controlling machine, where Ansible is installed and Nodes are managed by this controlling machine over SSH. The location of nodes are specified by controlling machine through its inventory.
The controlling machine (Ansible) deploys modules to nodes using SSH protocol and these modules are stored temporarily on remote nodes and communicate with the Ansible machine through a JSON connection over the standard output.
Ansible is agent-less, that means no need of any agent installation on remote nodes, so it means there are no any background daemons or programs are executing for Ansible, when it’s not managing any nodes.
Ansible can handle 100’s of nodes from a single system over SSH connection and the entire operation can be handled and executed by one single command ‘ansible’. But, in some cases, where you required to execute multiple commands for a deployment, here we can build playbooks.
Playbooks are bunch of commands which can perform multiple tasks and each playbooks are in YAML file format.
What’s the Use of Ansible
Ansible can be used in IT infrastructure to manage and deploy software applications to remote nodes. For example, let’s say you need to deploy a single software or multiple software to 100’s of nodes by a single command, here ansible comes into picture, with the help of Ansible you can deploy as many as applications to many nodes with one single command, but you must have a little programming knowledge for understanding the ansible scripts.
We’ve compiled a series on Ansible, title ‘Preparation for the Deployment of your IT Infrastructure with Ansible IT Automation Tool‘, through parts 1-4 and covers the following topics.
Part 1: How to Install and Configure Ansible for IT Management in Linux
Part 4: Managing Encrypted YAMAL data with Ansible-Vault
In this article, we will show you how to install ‘Ansible’ on RHEL/CentOS 7/6, Fedora 21-19, Ubuntu 14.10-13.04 and Debian 7/6 systems and also we will go through some basics on how how to manage a server by installing packages, applying updates and much more from basic to pro.
Prerequisites
Operating System: RHEL/CentOS/Fedora and Ubuntu/Debian/Linux Mint
Jinja2: A modern, fast and easy to use stand-alone template engine for Python.
PyYAML: A YAML parser and emitter for the Python programming language.
parmiko: A native Python SSHv2 channel library.
httplib2: A comprehensive HTTP client library.
sshpass: A non-interactive ssh password authentication.
My Environment Setup
Controlling Machine – Ansible
Operating System :	Linux Mint 17.1 Rebecca
IP Address	 :	192.168.0.254
Host-name	 :	tecmint.instrcutor.com
User		 :	tecmint
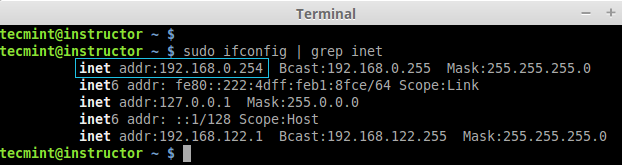
1. Before installing ‘Ansible‘ on the server, let’s first verify the details of the server like hostname and IP Address. Login into server as a root user and execute the below command to confirm system settings that we’re going to use for this setup.
# sudo ifconfig | grep inet
Verify System Details
2. Once you confirm your system settings, it’s time to install ‘Ansible’ software on the system.
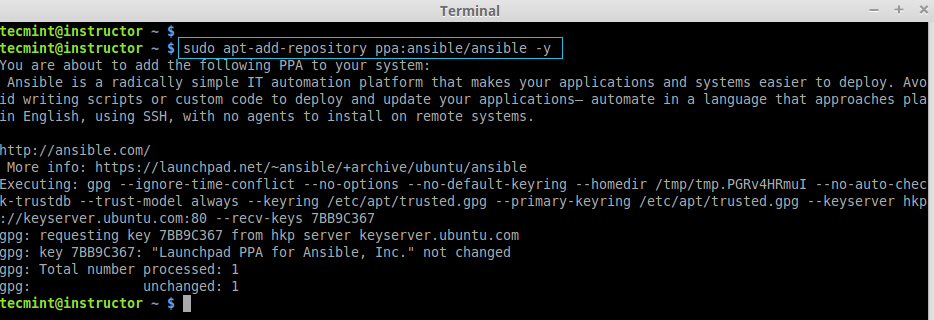
On Ubuntu/Debian/Linux Mint
Here we are going to use official Ansible PPA repository on the system, just run the below commands to add the repository.
Unfortunately, there are no official Ansible repository for RedHat based clones, but we can install Ansible by enabling epel repository under RHEL/CentOS 6, 7 and currently supported fedora distributions.
Fedora users can directly install Ansible through default repository, but if you are using RHEL/CentOS 6, 7, you have to enable EPEL repo.
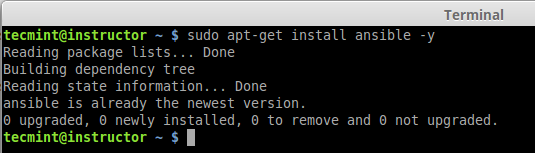
After configuring epel repository, you can install Ansible using following command.
$ sudo yum install ansible -y
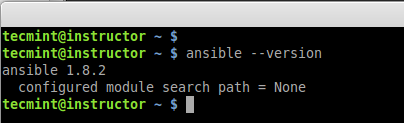
After installed successfully, you can verify the version by executing below command.
# ansible --version
Verify Ansible Version
Step 2: Preparing SSH Keys to Remote Hosts
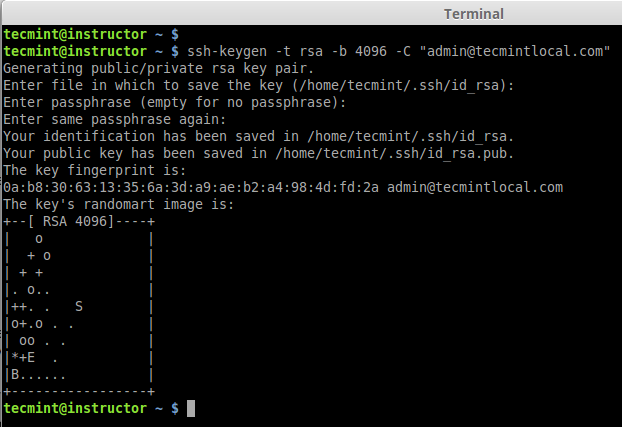
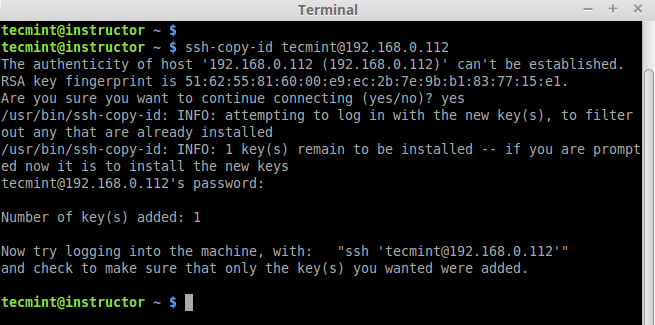
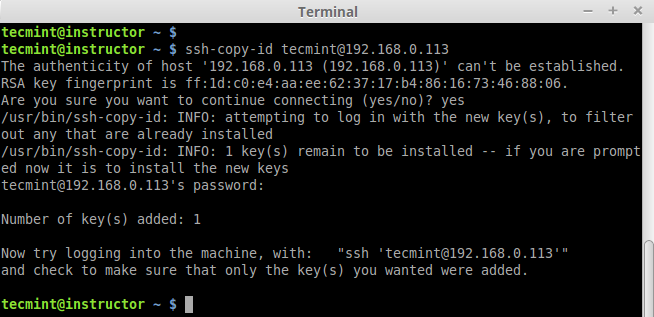
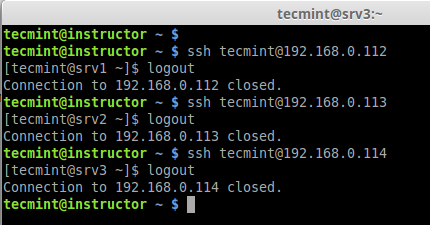
4. To perform any deployment or management from the localhost to remote host first we need to create and copy the ssh keys to the remote host. In every remote host there will be a user account tecmint (in your case may be different user).
First let we create a SSH key using below command and copy the key to remote hosts.
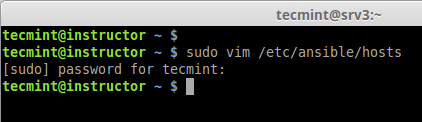
Inventory file, This file hold the host information’s like which host we need to get connect from local to remote. Default inventory file will be under /etc/ansible/hosts.
7. Now let’s add these three hosts to inventory file. Open and edit file using your favourite editor, Here I use vim.
Note: The ‘web-servers‘ in the brackets indicates as group names, it is used in classifying systems and deciding which systems you are going to controlling at what times and for what reason.
Create Ansible Inventory File
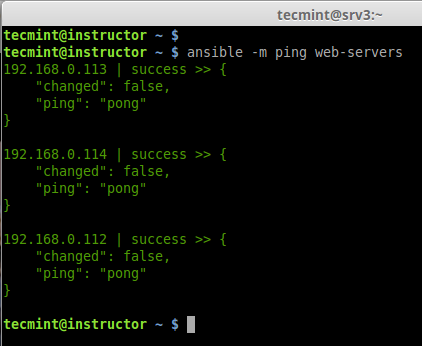
8. Now time to check our all 3 server by just doing a ping from my localhost. To perform the action we need to use the command ‘ansible‘ with options ‘-m‘ (module) and ‘-all‘ (group of servers).
In the above example, we’ve used ping module with Ansible command to ping all remote hosts at ones, the same way there are various modules can be used with Ansible, you can find available modules from ansible Official site here.
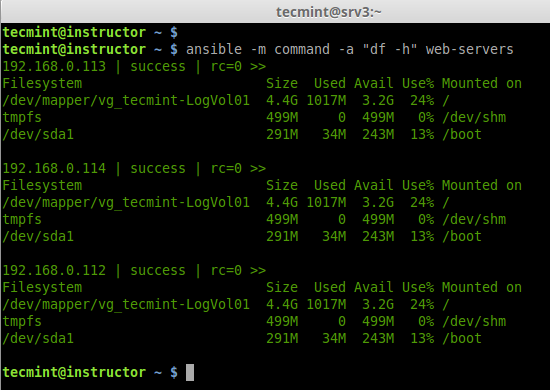
9. Now, here we are using another module called ‘command‘, which is used to execute list of commands (like, df, free, uptim, etc.) on all selected remote hosts at one go, for example watch out few examples shown below.
a. To check the partitions on all remote hosts
# ansible -m command -a "df -h" web-servers
Check Disk Space on all Hosts
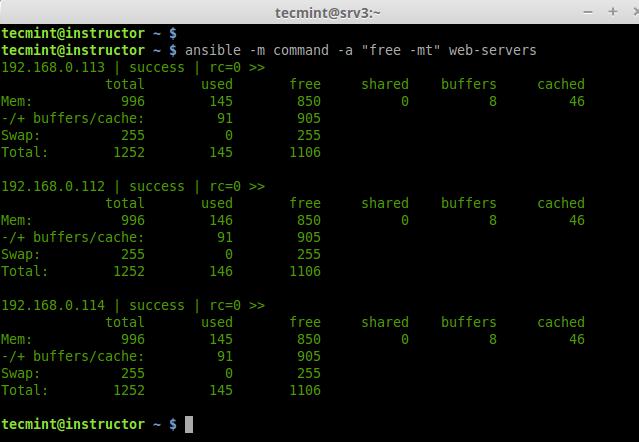
b. Check memory usage on all remote hosts.
# ansible -m command -a "free -mt" web-servers
Check Memory on all Hosts
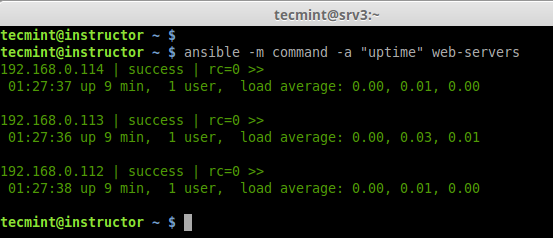
c. Checking Uptime for all 3 servers.
# ansible -m command -a "uptime" web-servers
Check uptime on all Hosts
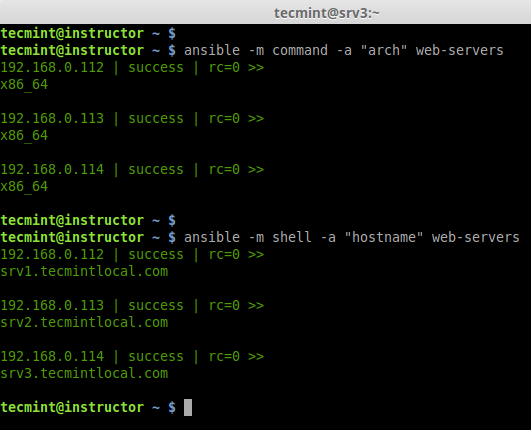
d. Check for hostname and Architecture.
# ansible -m command -a "arch" web-servers
# ansible -m shell -a "hostname" web-servers
Check hostname on all Hosts
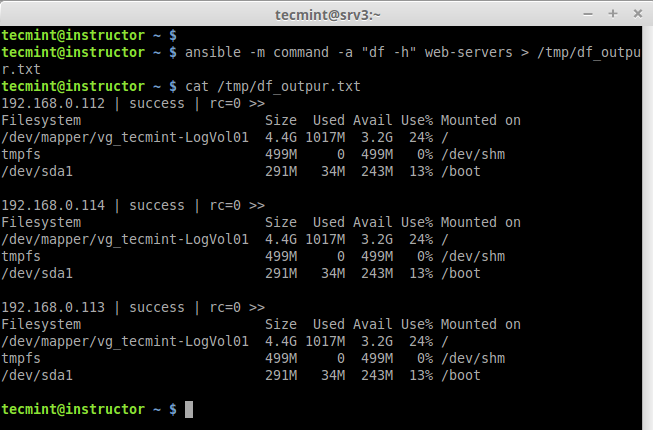
e. If we need the output to any file we can redirect as below.
# ansible -m command -a "df -h" web-servers > /tmp/df_outpur.txt
Redirect Output to File
Like this way, we can run many shell commands using ansible as what we have run the above steps.
Conclusion
Okay, We can see how to in next article.
Ansible is a Powerful IT automation tool which is must every sysadmins for deploying applications and managing server’s at one go. Among any other automation tool such as puppet, Capistrano, salt, Ansible is quit very interesting and very easy to setup for production environment. Capistrano oh no i feel headache please leave me alone :p this what i used to say.
Ansible use only SSH as there agent. We don’t have to install and run any agent in the remote servers. Hope this article will be interesting one for you too. In our next article, I will show you how to setup the directory structure for Ansible deployment and creating playbooks and working with it.
Till then keep on tracking us to get updated articles and don’t forget to tell us your opinions on the Ansible and also tell us do you use any other automation tool which is more powerful than Ansible….
In the previous article of this Ansible series, we explained that Ansible is an agent-less tool that allows you to quickly and efficiently manage multiple machines (also known as nodes – and perform deployments to them as well) from a single system.
Use Ansible Playbooks to Automate Complex Tasks on Linux – Part 2
After installing the software in the controller machine, creating the keys for passwordless login and copying them to the nodes, it’s time to learn how to optimize the process of managing such remote systems using Ansible.
Ansible Testing Environment
Throughout this article, as well as the next one, we will use the following test environment. All hosts are CentOS 7 boxes:
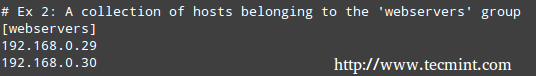
In addition, please note that both nodes have been added in the webservers section of the local /etc/ansible/hosts file:
Ansible Host File
That said, let’s get started with the topic at hand.
Introducing Ansible Playbooks
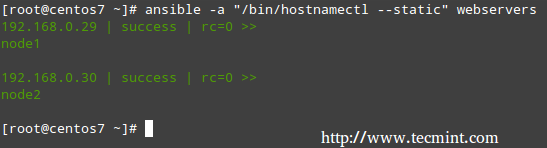
As described in the previous guide, you can use the ansible utility to run commands in remote nodes as follows:
# ansible -a "/bin/hostnamectl --static" webservers
Ansible: Run Commands on Remote Linux
In the example above, we ran hostnamectl --static on node1 and node2. It doesn’t take long for one to realize that this method of running tasks on remote computers works fine for short commands but can quickly become burdensome or messy for more complex tasks that require further well-structured configuration parameters or interactions with other services
For example, setting up and configuring WordPress on multiple hosts – which we will cover in the next article of this series). This is where Playbooks come into scene.
Simply put, Playbooks are plain text files written in the YAML format, and contain a list with items with one or more key/value pairs (also known as a “hash” or a “dictionary”).
Inside each Playbook you will find one or more group of hosts (each one of these groups is also called a play) where the desired tasks are to be performed.
An example from the official docs will help us to illustrate:
1.hosts: this is a list of machines (as per /etc/ansible/hosts) where the following tasks will be performed.
2.remote_user: remote account that will be used to perform the tasks.
3.vars: variables used to modify the behavior of the remote system(s).
4. tasks are executed in order, one at a time, against all machines that match hosts. Within a play, all hosts are going to get the same task directives.
If you need to execute a different set of associated tasks for a specific host, create another play in the current Playbook (in other words, the purpose of a play is to map a specific selection of hosts to well-defined tasks).
In that case, start a new play by adding the hosts directive at the bottom and starting over:
5. handlers are actions that are triggered at the end of the tasks section in each play, and are mostly used to restart services or trigger reboots in the remote systems.
# mkdir /etc/ansible/playbooks
And a file named apache.yml inside of there with the following contents:
---
- hosts: webservers
vars:
http_port: 80
max_clients: 200
remote_user: root
tasks:
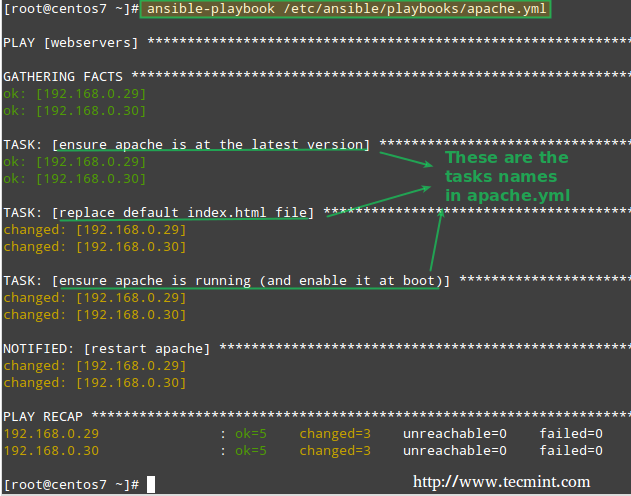
- name: ensure apache is at the latest version
yum: pkg=httpd state=latest
- name: replace default index.html file
copy: src=/static_files/index.html dest=/var/www/html/ mode=0644
notify:
- restart apache
- name: ensure apache is running (and enable it at boot)
service: name=httpd state=started enabled=yes
handlers:
- name: restart apache
service: name=httpd state=restarted
Second, create a directory /static_files:
# mkdir /static_files
where you will store the custom index.html file:
<!DOCTYPE html>
<html lang="en">
<head>
<meta charset="utf-8"/>
</script>
</head>
<body>
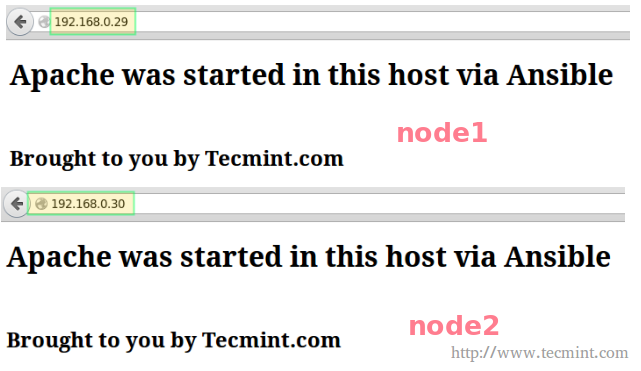
<h1>Apache was started in this host via Ansible</h1><br>
<h2>Brought to you by Tecmint.com</h2>
</body>
</html>
That said, now it’s time to use this playbook to perform the tasks mentioned earlier. You will note that Ansible will go through each task by host, one at a time, and will report on the status of such tasks:
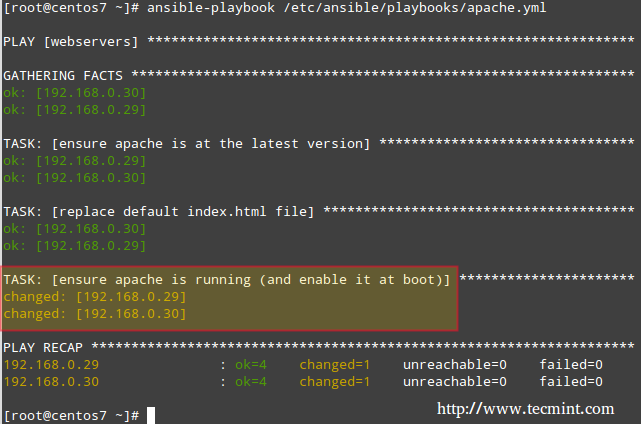
This time, the task reports that the Apache web server was started and enabled on each host:
Ansible: Start Web Server
Please consider the above example as a glimpse of the power of Ansible. While these are relatively easy tasks when performed on a small number of servers, it can become very tedious and time-consuming if you need to do the same in several (perhaps hundreds) of machines.
Summary
In this article we have described how to run commands and execute complex tasks on several remote hosts simultaneously using Ansible. The official documentation and the GitHub repository provide a lot of examples and guides on how to use Ansible to achieve almost any imaginable task.
As you start learning how to automate tasks on remote Linux hosts using Ansible, we would like to hear your thoughts. Questions, comments, and suggestions are also always welcome, so feel free to contact us using the form below any time.
In the previous two articles of this Ansible series, we explained how to install and configure Ansible to run commands and perform complex tasks in several remote servers simultaneously.
Automate Multiple WordPress Installations using Ansible – Part 3
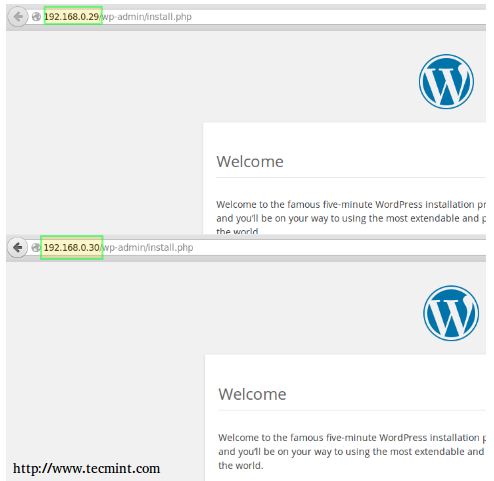
In the current tutorial we will explain how to set up WordPress in the same remote servers:
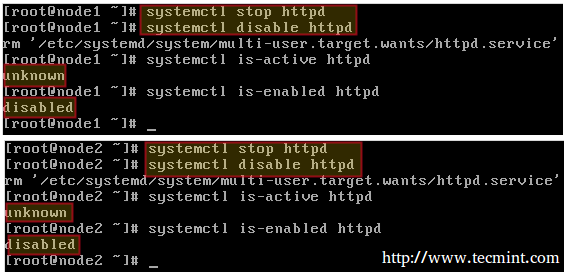
node1: 192.168.0.29node2: 192.168.0.30
where we installed, enabled, and started Apache (you probably know by now why we chose to work with a web server as an initial example in the last tutorial).
I highly encourage you to read Part 1 and Part 2 before proceeding further in order to make sure you’re familiar with the concepts associated with Ansible.
As you start adding more and more tasks to plays, your Playbooks can become increasingly difficult to handle. For that reason, the recommended approach in those situations (actually, in all cases) is to use a directory structure that contains the directives for each group of tasks in distinct files.
This approach allows us to re-use these configuration files in separate projects further down the road. Each of these files define what is called in the Ansible ecosystem a role.
In our case, we will create two roles. One of them (called wp-dependencies) will be used to install the WordPress dependencies (PHP and MariaDB – no need to install Apache as it’s already installed).
The other role (named wp-install-config) will include all the necessary tasks associated with the installation and configuration of WordPress.
Step 2: Creating Ansible Roles
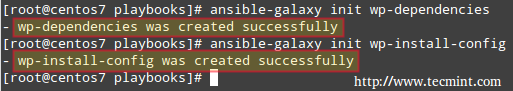
Ansible comes with an utility called ansible-galaxy that will help us to create the directory structure for our roles. We will do this in /etc/ansible/playbooks (which we created in Part 2) but in theory you can set it up in another directory if you want.
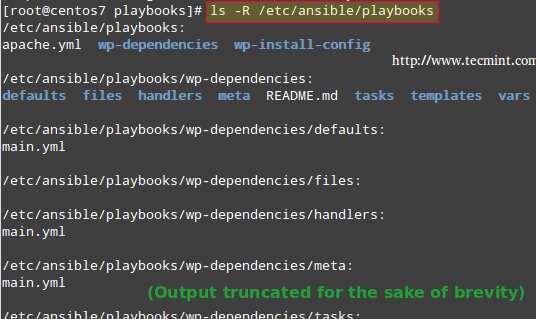
In the above image we can see that ansible-galaxy created two directories with the same name as our roles, and other subdirectories (defaults, files, handlers, meta, tasks, templates, and vars) and a README.md file inside each of them.
In addition, a YAML file named main.yml was created inside all of the directories listed earlier, with the exception of files and templates.
We will begin by editing the following configuration files as indicated:
1./etc/ansible/playbooks/wp-dependencies/tasks/main.yml. Note that we are including httpd in case you have not followed along with the previous tutorials of this series.
4.wp-config-sample.php (provided in this Pastebin) as follows and save it to your Ansible controller machine (as you can see in the last copy directive above, I downloaded it to the home directory of the superuser (/root/wp-config-sample.php).
Important: Please note that the value for variables DB_NAME, DB_USER, and DB_PASSWORD are the same as in /etc/ansible/playbooks/wp-dependencies/defaults/main.yml:
wp-config-sample.php
…
/** The name of the database for WordPress */
define('DB_NAME', 'MyWP');

/** MySQL database username */
define('DB_USER', 'wpUser');

/** MySQL database password */
define('DB_PASSWORD', 'wpP4ss');
…
5. For new database server installations where the root password is empty, such as in this case, unfortunately we need to setup the password for user root individually in every machine through mysql_secure_installation.
As far as I know, there is no available workaround that will allow you to set up the root password via Ansible in the same step where you create the administrative database account for WordPress.
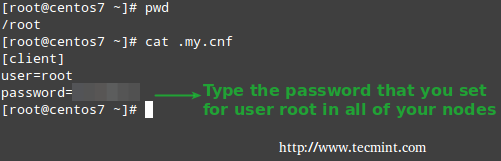
Make sure you use the same password in all hosts, then copy the credentials in /root/.my.cnf (the actual location may differ in your case, but in all instances it needs to match the value of the src parameter for the task Copy ~/.my.cnf to nodes in /etc/ansible/playbooks/wp-dependencies/tasks/main.yml).
In that file (see above) we’ve assumed that the password for root is YourMariaDBRootPassword.
Ansible Database Password
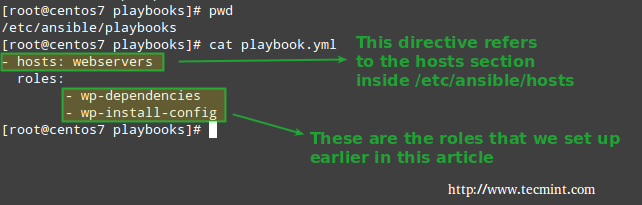
6. Next, our playbook (/etc/ansible/playbooks/playbook.yml) will look much more organized and simple when compared to the previous tutorial:
Finally, it’s time to run these tasks by invoking our playbook:
# ansible-playbook playbook.yml
Now let’s check if we can access the WordPress Admin page using the IP addresses of node1 192.168.0.29 and node2 192.168.0.30:
Ansible WordPress Installation
You can view the last two steps in the following screencast:
As you can see, you can set up multiple WordPress installations with little to no effort using Ansible. Then you can use the respective Admin user interface to configure each site separately.
Final considerations
If you are using another distribution to deploy WordPress, the packages name may vary, but it comes down to installing the Apache web server, the MariaDB database server, and the Python MySQL module. If that is the case, use your distribution’s software management system to search for the exact package name that you need to install.
One of such examples is setting up WordPress, as we have discussed in this guide. Whether you are a system administrator or a blogger, I hope you have found the concepts and examples in this tutorial useful.
Best of luck and do not hesitate to drop us a line if you need help or have any comments or suggestions!
Have you upgraded your kernel and redhat-release packages and you are encountering some issues. Do you want to downgrade to a lower minor release. In this article, we will describe how to do downgrade RHEL or CentOS version to previous minor version.
Note: The following steps will only work for downgrades within the same major version (such as from RHEL/CentOS 7.6 to 7.5) but not between major versions (such as from RHEL/CentOS 7.0 to 6.9).
A minor version is a release of RHEL that does not (in most cases) add new features or content. It focuses on solving minor problems, typically bugs or security issues. Most of what makes a specific minor version is included in the kernel, so you will need to find out which kernels are supported as part of the minor version you are targeting.
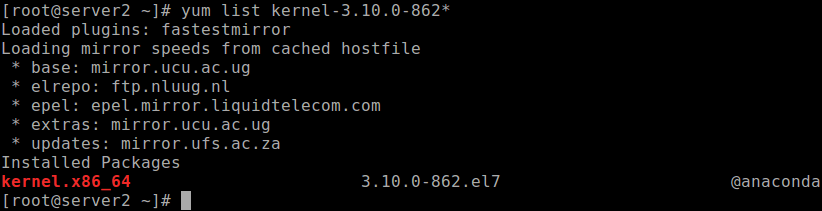
For the purpose of this article, we will show how to downgrade from 7.6 to 7.5. Before we proceed, note that the kernel version for 7.5 is 3.10.0-862. Got to Red Hat Enterprise Linux Release Dates for a complete list of minor releases and associated kernel versions.
Let’s check if the required kernel packages “kernel-3.10.0-862” is installed or not, using the following yum command.
# yum list kernel-3.10.0-862*
Check Kernel Version Package
If the output of the previous command shows that the kernel package is not installed, you need to install it on the system.
# yum install kernel-3.10.0-862.el7
Once the kernel installation is compete, to apply the changes, you need to reboot the system.
Then downgrade the redhat-release package to complete the process. The command below targets the latest minor version that is lower than the current running one, such as from 7.6 to 7.5, or from 7.5 o 7.4.
# yum downgrade redhat-release
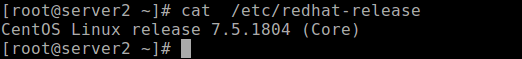
Finally, confirm the downgrade by checking the contents of /etc/redhat-release using the cat command.
# cat /etc/redhat-release
Check Release Version
That’s all! In this article, we have explained how to downgrade RHEL or CentOS distribution to a lower minor release. If you have any queries, use the feedback form below to reach us.
Searching or finding files on a Linux system from the terminal can be a little of a challenge especially for newbies. However, there are several command line tools/utilities for locating files in Linux.
In this article, we will review 5 command line tools to find, locate and search files quickly on Linux systems.
1. Find Command
find command is a powerful, widely used CLI tool for searching and locating files whose names match simple patterns, in a directory hierarchy. Using find is simple, all you need to do is provide a starting point (top of the directory heirarchy) where the search beings. This can be the current directory or any other directory where you suspect the file you are looking for is stored.
After the starting point, you can specify an expression (composed of test, actions, options and operators) which describes how to match files and what to do with the files that were matched.
It supports multiple options to locate files using attributes such as permissions, users, groups, file type, date, size and other possible criteria. You can learn some useful find command usage examples in the following articles:
locate command is another commonly used CLI utility for searching files quickly by name, just like find command. However, it is practically more efficient and faster compared to its counterpart because, instead of searching through the file system when a user initiates a file search operation (the way find works), locate queries a database which contains bits and parts of files and their corresponding paths on the file system.
This database can be prepared and updated using the updatedb command. Note that locate will not report files created after the most recent update of the relevant database.
Although grep command is not a tool for directly searching files (its instead used to print lines matching a pattern from one or more files), you can employ it to locate files. Assuming you know a phrase in the file(s) you are looking for or you are looking for a file that contains a particular string of characters, grep can help you list all files that contain a particular phrase.
For example, if you are looking for a README.md file which contains the phrase “An assortment”, which you suspect should be somewhere in your home directory, possibly in ~/bin, you can locate it as shown.
That’s all for now! If we have missed any Commandline tools/utilities for quickly locating files on a Linux system, let us know via the comment form below. You can ask any questions concerning this topic as well.
This tutorial will explain the first basic steps you need to go through after installing a minimal CentOS 7 system with no graphical environment in order to obtain information about the installed system, the hardware on top of which runs the system and configure other specific system tasks, such as networking, root privileges, software, services and others.
The first step you need to perform on a fresh installed CentOS system is to make sure the system is up-to-date with the latest kernel and system security patches, software repositories and packages.
To fully update a CentOS 7 system, issue the following commands with root privileges.
# yum check-update
# yum upgrade
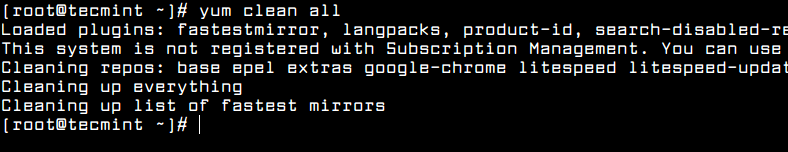
After the upgrade process completes, in order to release disk space you can remove all downloaded packages that where used in the process of upgrading alongside with all cached repositories information by executing the following command.
# yum clean all
Yum Clean All on CentOS 7
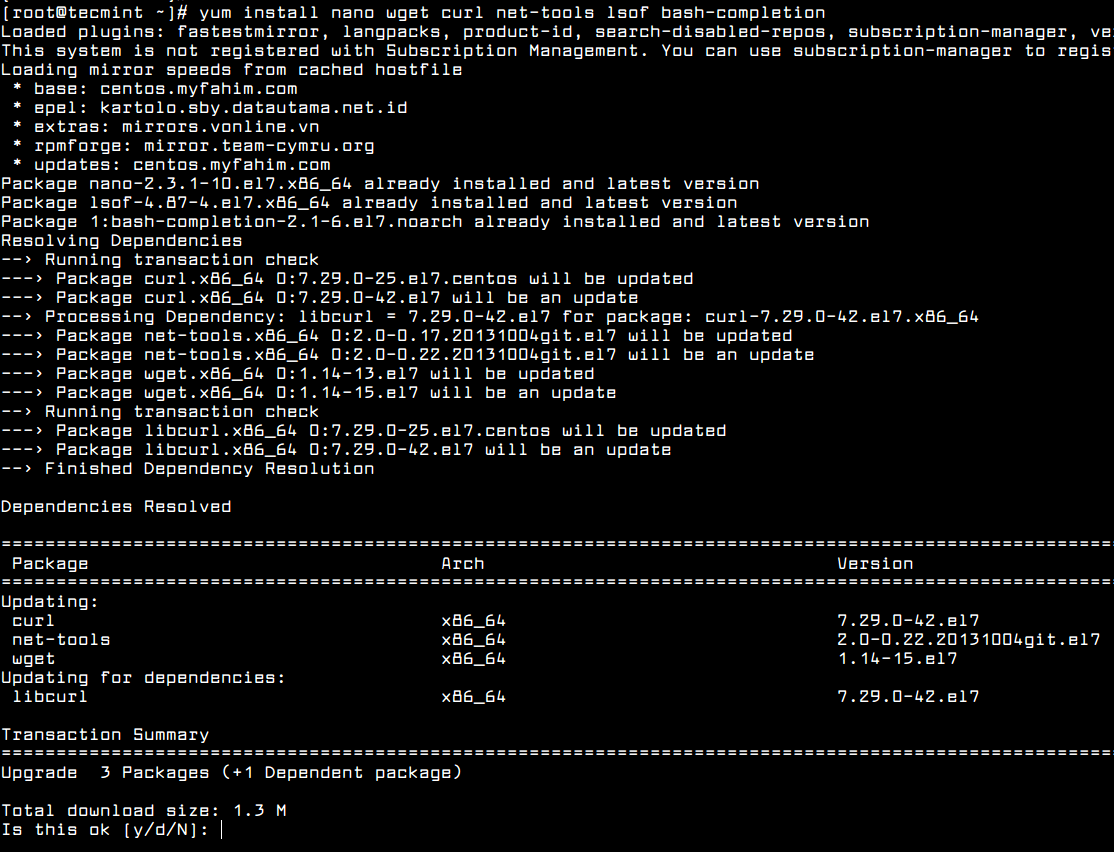
Install System Utilities on CentOS 7
The following utilities packages can prove to be useful for day-by-day system administration: nano (text editor to replace vi editor), wget, curl (utilities used for downloading packages over network mostly) net-tools, lsof(utilities for managing local networking) and bash-completion (command line autocomplete).
Install them all in one-shot by executing the below command.
CentOS 7 has a wide range of tools that can be used to configure and manage networking, from manually editing the network configuration file to using commands such as ip, ifconfig, nmtui, nmcli or route.
The easiest utility a beginner can use to manage and change network configurations is nmtui graphical command line.
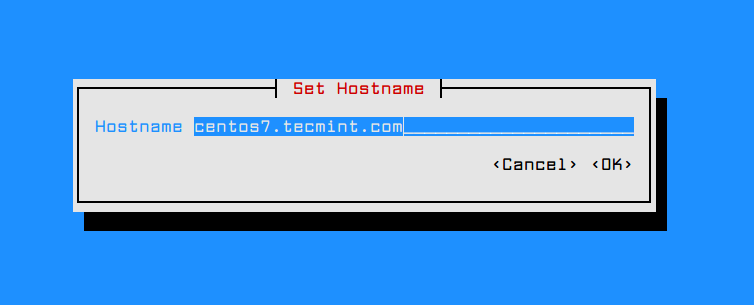
In order to change the system hostname via nmtui utility, execute nmtui-hostname command, set your machine hostname and press OK to finish, as illustrated in the below screenshot.
# nmtui-hostname
Set Hostname in CentOS 7
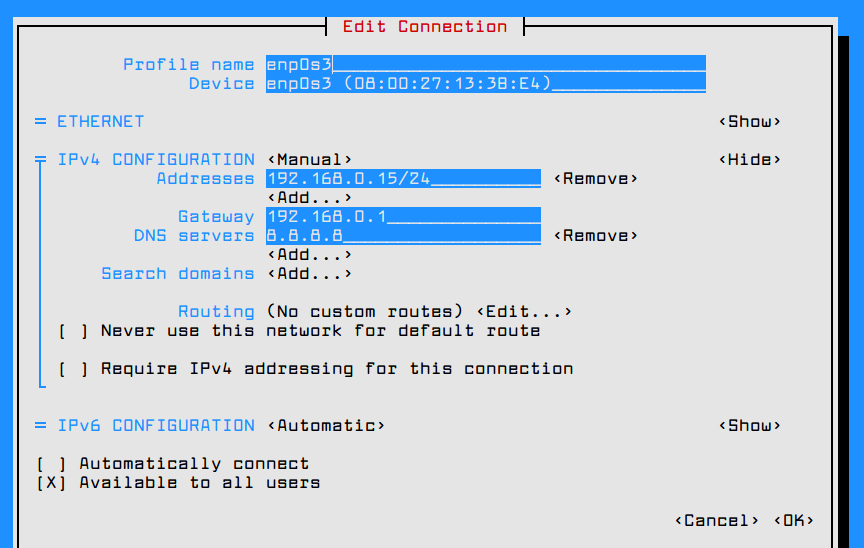
To manipulate a network interface, execute nmtui-edit command, choose the interface you want to edit and select edit from the right menu, as shown in the below screenshot.
# nmtui-edit
Configure Network in CentOS 7
Once you’re in the graphical interface provided by nmtui utility you can setup the network interface IP settings as illustrated in the below screenshot. When you finish, navigate to OK using [tab] key to save the configuration and quit.
Setup Network IP Address
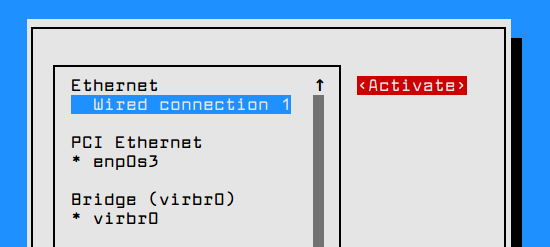
In order to apply the network interface new configuration, execute nmtui-connect command, select the interface you want to manage and hit on Deactivate/Activate option to decommission and rise-up the interface with the IP settings, as presented in the below screenshots.
# nmtui-connect
Active Network Interface
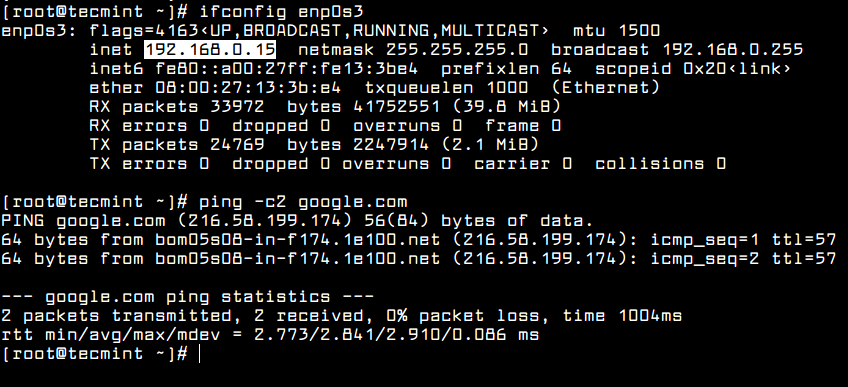
In order to view the network interface settings, you can inspect the content of the interface file or you can issue the below commands.
# ifconfig enp0s3
# ip a
# ping -c2 google.com
Verify Network Configuration
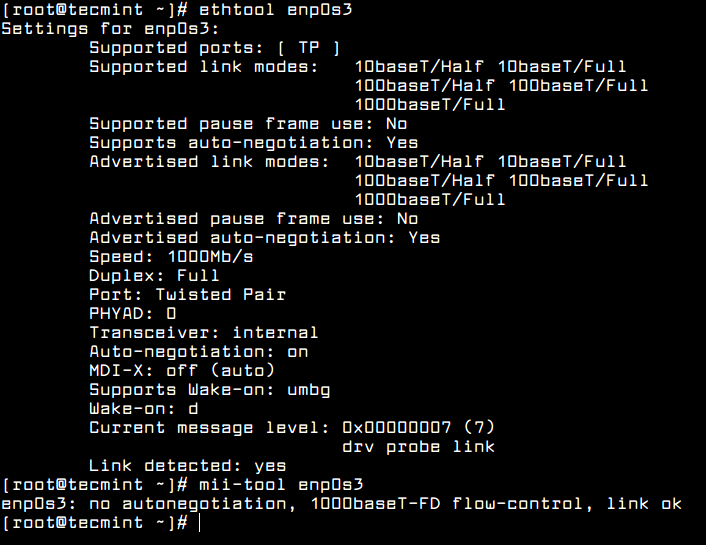
Other useful utilities that can be used to manage speed, link state or obtain information about machine network interfaces are ethtool and mii-tool.
# ethtool enp0s3
# mii-tool enp0s3
Check Network Connection
An important aspect of your machine networking is to list all open network sockets in order to see what programs are listening on what ports and what’s the state of the established network connections.
To list all servers that have opened TCP or UDP sockets in listening state issue the following commands. However, UDP server won’t list any socket state due to the fact that UDP is a connectionless protocol which only sends packets over network and doesn’t establish connections.
# netstat -tulpn
# ss -tulpn
# lsof -i4 -6
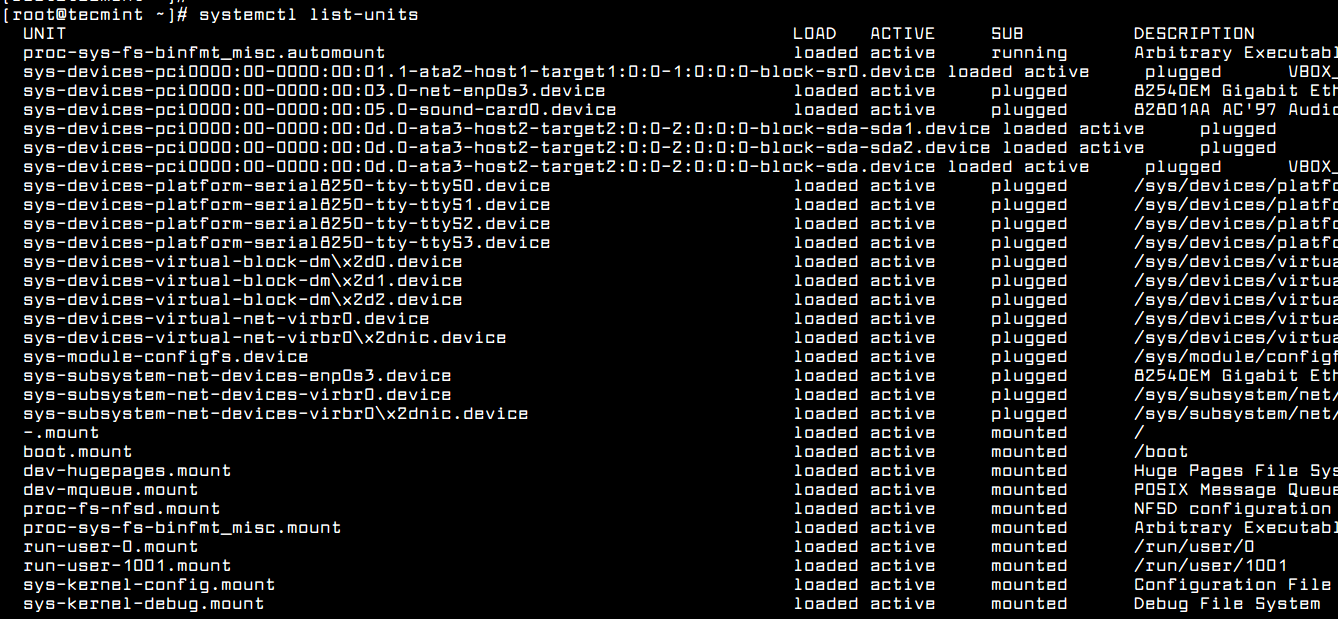
Manage Services in CentOS 7
CentOS 7 manages daemons or service via systemctl utility. In order to list all services state, issue the following command.
# systemctl list-units
List All Services State
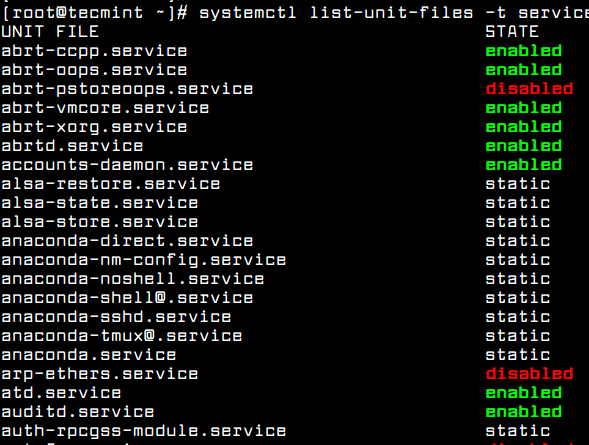
To check if a daemon or service is enabled to automatically start when the system starts, issue the following command.
# systemctl list-unit-files -t service
List Enabled Services
To list the old SysV services present in your system and disable them issue the following chkconfig commands.
# chkconfig --list
# chkconfig service_name off
5. Disable Unwanted Services in CentOS 7
It’s recommended after installing CentOS 7, to list what services are running in the system by running the above commands and disable and remove them in order to reduce the attacks vectors against your system.
For instance, Postfix daemon is installed and enabled by default in CentOS 7. If your system don’t require running a mail server, it’s best to stop, disable and remove the postfix service by issuing the below commands.
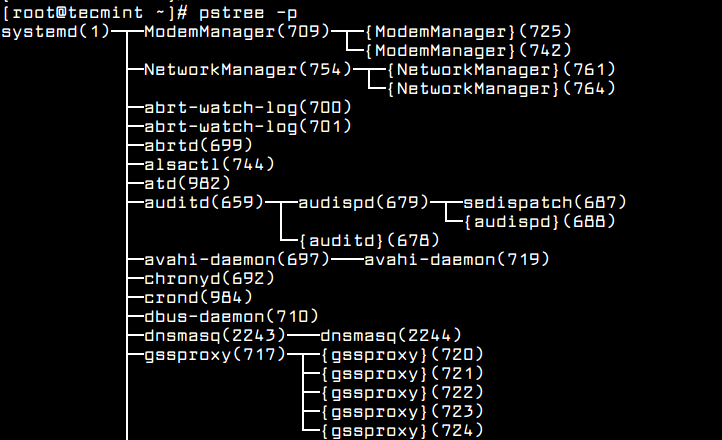
In addition to netstat, ss, lsof or systemctl commands, you can also run ps, top or pstree commands in order to discover and identify what unwanted services are running in your system and disable or remove them.
By default, pstree utility is not installed in CentOS 7. To install it execute the following command.
# yum install psmisc
# pstree -p
List Linux Processes in Tree Format
Enable Firewall in CentOs 7
Firewalld is the main firewall utility that uses interacts with in order to manage iptables rules.
To enable and start and verify the firewall in CentOS 7, execute the following commands.
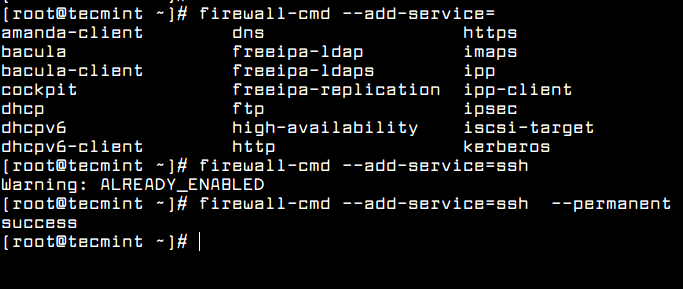
In order to open a specific service to incoming connections, first verify if the application is already present in firewalld rules and, then, add the rule for the service, as shown in the below example which allows SSHincoming connections. Use --permanent switch to add the rule permanently.
In order to grant root permissions for a normal user, first create the user by issuing adduser command, set the password for the user and grant root permissions to the user by executing the below command which adds the new user to the administrative wheel group.
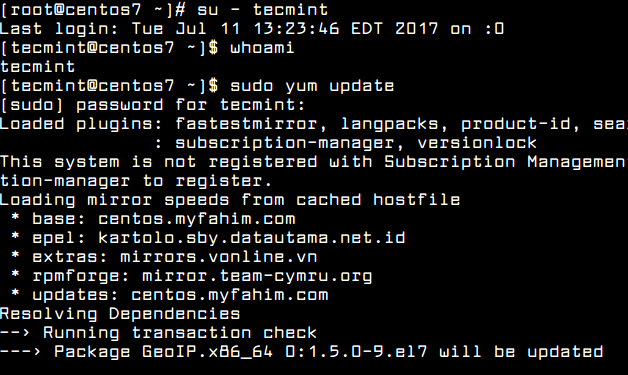
To test if the new user has root privileges, login to the system with user’s credentials and run yum command with sudo permissions, as shown in the below excerpt.
# su - tecmint
# sudo yum update
Verify Sudo User Permissions
Configure SSH Public Key Authentication on CentOS 7
In order to secure SSH your server and set up public key authentication to increase the security of your server with a private SSH key to log in, first generate a SSH Key Pair with a following command.
Don’t not enter a passphrase in case you want to automate server management via SSH.
# ssh-keygen -t RSA
After the SSH key pairs had been generated, copy the key to the server you want to connect to by issuing the below command. Initially, enter you remote SSH user password in order to copy the public key.
# ssh-copy-id remote_user@SSH_SERVER_IP
After the SSH public key has been copied to the remote server, login to the remote SSH server with the following command.
# ssh remote_user@SSH_SERVER_IP
Finally, in order to secure the SSH server, make sure you disallow remote SSH access to the root account by opening the configuration SSH file /etc/ssh/sshd_config with your text editor as root and change it from Yes to No.
PermitRootLogin no
To apply the setting you need to restart the SSH service so that it will use the new configuration.
# systemctl restart sshd
That’s all! These are just a few basic settings and commands every system administrator needs to know and apply on a fresh installed CentOS system or in order to perform day to day tasks on the system.
To secure and harden CentOS 7 server, check out these following articles.
One of the serious needs of a Linux system is to be kept up to date regularly with the latest security patches or updates available for the corresponding distribution.
In a previous article, we’ve explained how to configure automatic security update in Debian/Ubuntu, in this article we will explain how to set up your CentOS/RHEL 7/6 distribution to auto update essential security packages when needed.
Other Linux distributions in the same families (Fedora or Scientific Linux) can be configured similarly.
Configure Automatic Security Updates on CentOS/RHEL Systems
On CentOS/RHEL 7/6, you will need to install the following package:
# yum update -y && yum install yum-cron -y
Enable Automatic Security Updates on CentOS/RHEL 7
Once the installation is complete, open /etc/yum/yum-cron.conf and locate these lines – you will have to make sure that the values matches those listed here:
The first line indicates that the unattended update command will be:
# yum --security upgrade
whereas the other lines enable notifications and automatic download and installation of security upgrades.
The following lines are also required to indicate that notifications will be sent via email from root@localhost to the same account (again, you may choose another one if you want).
Enable Automatic Security Updates on CentOS/RHEL 6
By default, the cron is configured to download and install all updates immediately, but we can change this behavior in /etc/sysconfig/yum-cron configuration file by modifying these two parameters to yes.
# Don't install, just check (valid: yes|no)
CHECK_ONLY=yes

# Don't install, just check and download (valid: yes|no)
# Implies CHECK_ONLY=yes (gotta check first to see what to download)
DOWNLOAD_ONLY=yes
To enable email notification that about the security package updates, set the MAILTO parameter to a valid mail address.
# by default MAILTO is unset, so crond mails the output by itself
# example:  MAILTO=root
MAILTO=admin@tecmint.com
Finally, start and enable the yum-cron service:
------------- On CentOS/RHEL 7 -------------
systemctl start yum-cron
systemctl enable yum-cron

------------- On CentOS/RHEL 6 -------------
# service yum-cron start
# chkconfig --level 35 yum-cron on
Congrats! You have successfully set up unattended upgrades on CentOS/RHEL 7/6.
Summary
In this article we have discussed how to keep your server updated regularly with the latest security patches or updates. Additionally, you learned how to configure email notifications in order to keep yourself updated when new patches are applied.
If you have any concerns about this article? Feel free to drop us a note using the comment form below. We look forward to hearing from you.