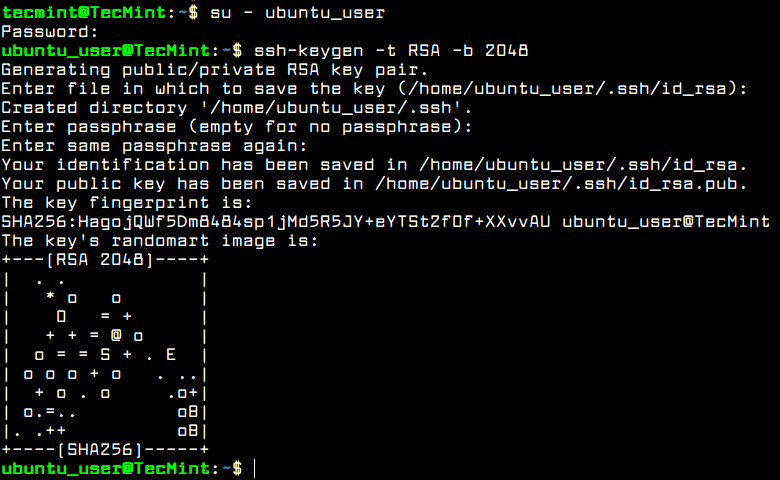
Lightweight Directory Access Protocol (LDAP in short) is an industry standard, lightweight, widely used set of protocols for accessing directory services. A directory service is a shared information infrastructure for accessing, managing, organizing, and updating everyday items and network resources, such as users, groups, devices, emails addresses, telephone numbers, volumes and many other objects.
The LDAP information model is based on entries. An entry in a LDAP directory represents a single unit or information and is uniquely identified by what is called a Distinguished Name (DN). Each of the entry’s attributes has a type and one or more values.
An attribute is a piece of information associated with an entry. The types are typically mnemonic strings, such as “cn” for common name, or “mail” for email address. Each attribute is assigned one or more values consisting in a space-separated list.
The following is an illustration of how information is arranged in the LDAP directory.
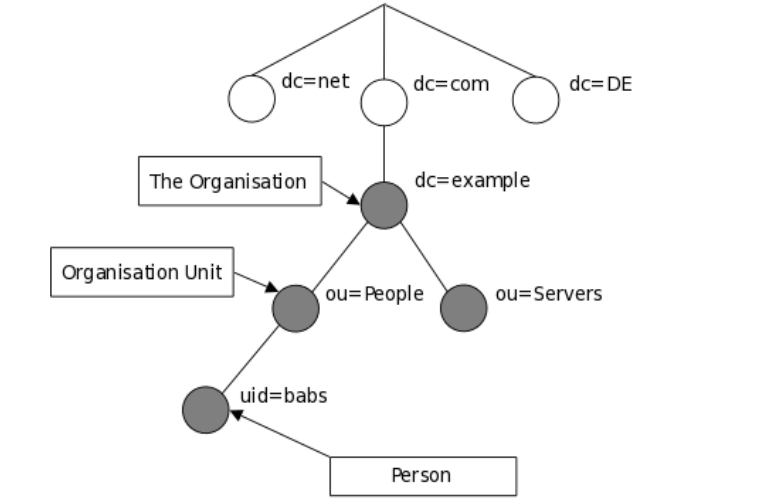
Ldap Information Model
Step 1: Installing LDAP Server
1. First start by installing OpenLDAP, an open source implementation of LDAP and some traditional LDAP management utilities using the following commands.
# yum install openldap openldap-servers	    #CentOS 7
$ sudo apt install slapd ldap-utils	    #Ubuntu 16.04/18.04
On Ubuntu, during the package installation, you will be prompted to enter the password for the admin entry in your LDAP directory, set a secure password and confirm it.
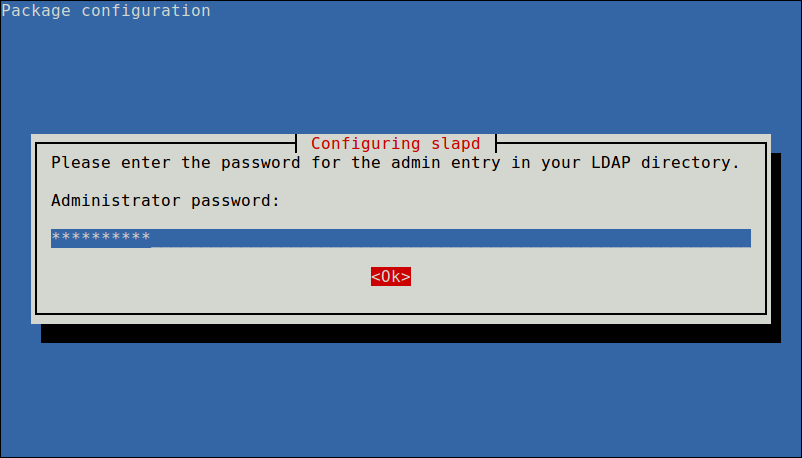
Configure Slapd Admin Password
When the installation is complete, you can start the service as explained next.
2. On CentOS 7, run the following commands to start the openldap server daemon, enable it to auto-start at boot time and check if its up and running (on Ubuntu the service should be auto-started under systemd, you can simply check its status):
$ sudo systemctl start slapd
$ sudo systemctl enable slapd
$ sudo systemctl status slapd
3. Next, allow requests to the LDAP server daemon through the firewall as shown.
# firewall-cmd --add-service=ldap    #CentOS 7
$ sudo ufw allow ldap                #Ubuntu 16.04/18.04
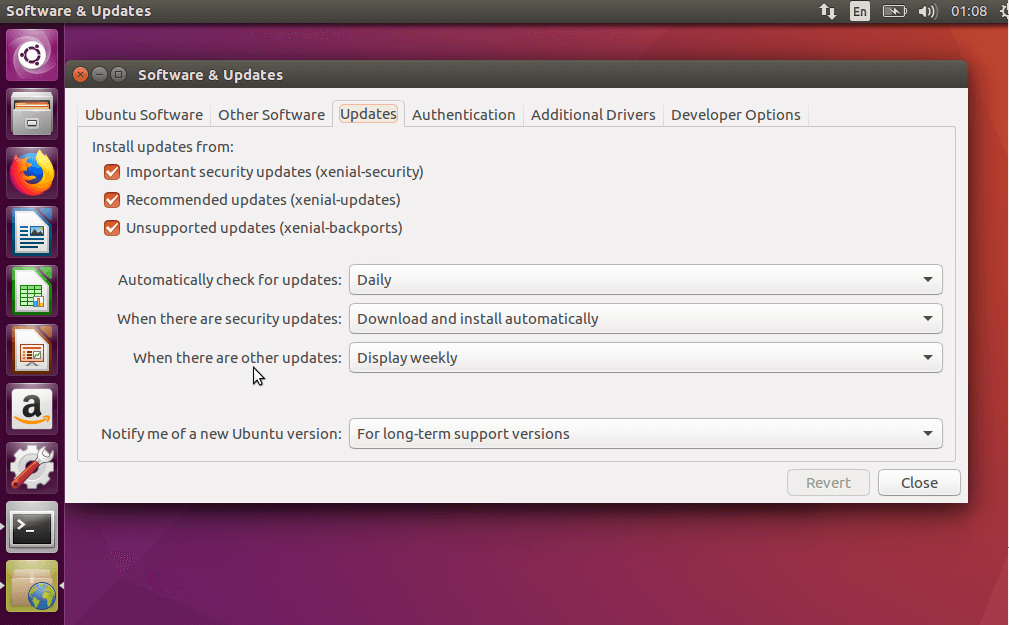
Step 2: Configuring LDAP Server
Note: It is not recommended to manually edit the LDAP configuration, you need to add the configurations in a file and use the ldapadd or ldapmodify command to load them to the LDAP directory as shown below.
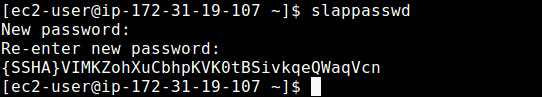
4. Now create a OpenLDAP administrative user and assign a password for that user. In the below command, a hashed value is created for the given password, take note of it, you will use it in the LDAP configuration file.
$ slappasswd
Create Ldap Admin User
5. Then create an LDIF file (ldaprootpasswd.ldif) which is used to add an entry to the LDAP directory.
$ sudo vim ldaprootpasswd.ldif
Add the following contents in it:
dn: olcDatabase={0}config,cn=config
changetype: modify
add: olcRootPW
olcRootPW: {SSHA}PASSWORD_CREATED
explaining the attribute-value pairs above:
- olcDatabase: indicates a specific database instance name and can be typically found inside /etc/openldap/slapd.d/cn=config.
- cn=config: indicates global config options.
- PASSWORD: is the hashed string obtained while creating the administrative user.
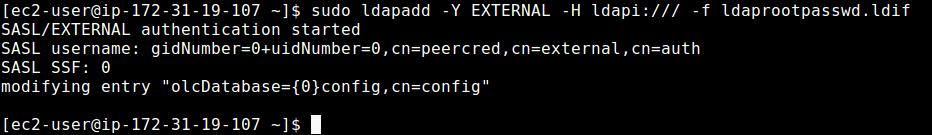
6. Next, add the corresponding LDAP entry by specifying the URI referring to the ldap server and the file above.
$ sudo ldapadd -Y EXTERNAL -H ldapi:/// -f ldaprootpasswd.ldif
Add Parameters from Root Password File
Step 3: Configuring LDAP Database
7. Now copy the sample database configuration file for slapd into the /var/lib/ldap directory, and set the correct permissions on the file.
$ sudo cp /usr/share/openldap-servers/DB_CONFIG.example /var/lib/ldap/DB_CONFIG
$ sudo chown -R ldap:ldap /var/lib/ldap/DB_CONFIG
$ sudo systemctl restart slapd
8. Next, import some basic LDAP schemas from the /etc/openldap/schema directory as follows.
$ sudo ldapadd -Y EXTERNAL -H ldapi:/// -f /etc/openldap/schema/cosine.ldif
$ sudo ldapadd -Y EXTERNAL -H ldapi:/// -f /etc/openldap/schema/nis.ldif
$ sudo ldapadd -Y EXTERNAL -H ldapi:/// -f /etc/openldap/schema/inetorgperson.ldif
9. Now add your domain in the LDAP database and create a file called ldapdomain.ldif for your domain.
$ sudo vim ldapdomain.ldif
Add the following content in it (replace example with your domain and PASSWORD with the hashed value obtained before):
dn: olcDatabase={1}monitor,cn=config
changetype: modify
replace: olcAccess
olcAccess: {0}to * by dn.base="gidNumber=0+uidNumber=0,cn=peercred,cn=external,cn=auth"
  read by dn.base="cn=Manager,dc=example,dc=com" read by * none

dn: olcDatabase={2}hdb,cn=config
changetype: modify
replace: olcSuffix
olcSuffix: dc=example,dc=com

dn: olcDatabase={2}hdb,cn=config
changetype: modify
replace: olcRootDN
olcRootDN: cn=Manager,dc=example,dc=com

dn: olcDatabase={2}hdb,cn=config
changetype: modify
add: olcRootPW
olcRootPW: {SSHA}PASSWORD

dn: olcDatabase={2}hdb,cn=config
changetype: modify
add: olcAccess
olcAccess: {0}to attrs=userPassword,shadowLastChange by
  dn="cn=Manager,dc=example,dc=com" write by anonymous auth by self write by * none
olcAccess: {1}to dn.base="" by * read
olcAccess: {2}to * by dn="cn=Manager,dc=example,dc=com" write by * read
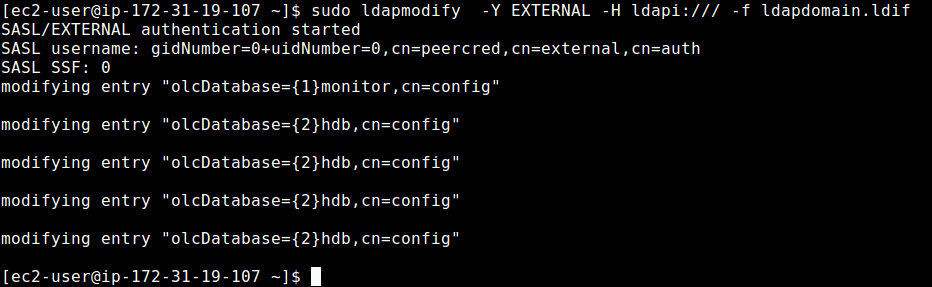
10. Then add the above configuration to the LDAP database with the following command.
$ sudo ldapmodify -Y EXTERNAL -H ldapi:/// -f ldapdomain.ldif
Load Domain Configuration
11. In this step, we need to add some entries to our LDAP directory. Create another file called baseldapdomain.ldif with the following content.
dn: dc=example,dc=com
objectClass: top
objectClass: dcObject
objectclass: organization
o: example com
dc: example

dn: cn=Manager,dc=example,dc=com
objectClass: organizationalRole
cn: Manager
description: Directory Manager

dn: ou=People,dc=example,dc=com
objectClass: organizationalUnit
ou: People

dn: ou=Group,dc=example,dc=com
objectClass: organizationalUnit
ou: Group
Save the file and then add the entries to the LDAP directory.
$ sudo ldapadd -Y EXTERNAL -x -D cn=Manager,dc=example,dc=com -W -f baseldapdomain.ldif
12. The next step is to create a LDAP user for example, tecmint, and set a password for this user as follows.
$ sudo useradd tecmint
$ sudo passwd tecmint
13. Then create the definitions for a LDAP group in a file called ldapgroup.ldif with the following content.
dn: cn=Manager,ou=Group,dc=example,dc=com
objectClass: top
objectClass: posixGroup
gidNumber: 1005
In the above configuration, gidNumber is the GID in /etc/group for tecmint and add it to the OpenLDAP directory.
$ sudo ldapadd -Y EXTERNAL -x -W -D "cn=Manager,dc=example,dc=com" -f ldapgroup.ldif
14. Next, create another LDIF file called ldapuser.ldif and add the definitions for user tecmint.
dn: uid=tecmint,ou=People,dc=example,dc=com
objectClass: top
objectClass: account
objectClass: posixAccount
objectClass: shadowAccount
cn: tecmint
uid: tecmint
uidNumber: 1005
gidNumber: 1005
homeDirectory: /home/tecmint
userPassword: {SSHA}PASSWORD_HERE
loginShell: /bin/bash
gecos: tecmint
shadowLastChange: 0
shadowMax: 0
shadowWarning: 0
then load fthe configuration to the LDAP directory.
$ ldapadd -Y EXTERNAL -x -D cn=Manager,dc=example,dc=com -W -f ldapuser.ldif
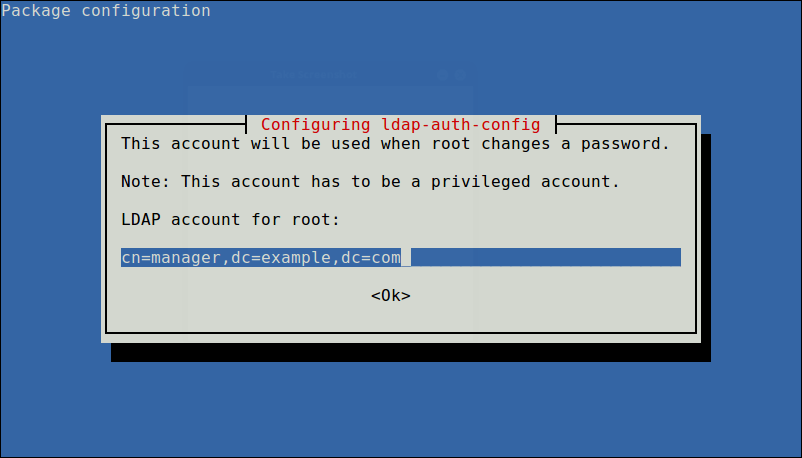
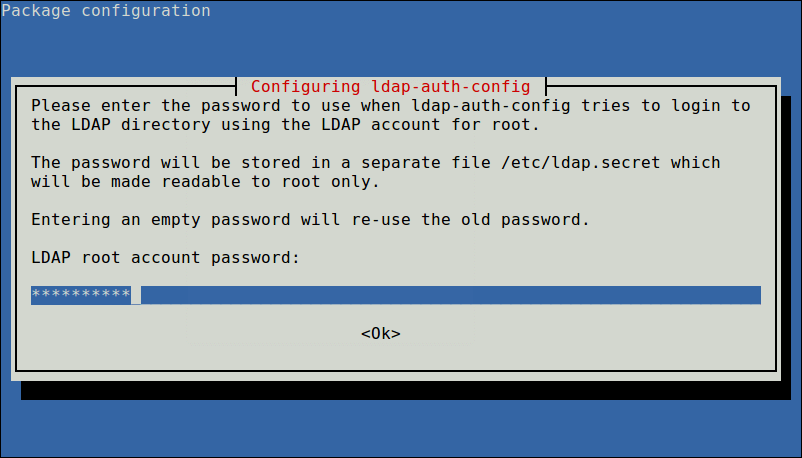
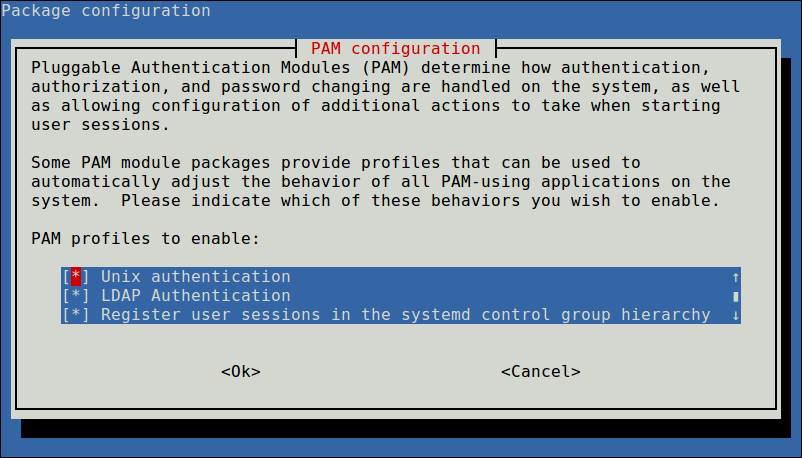
Once you have setup a central server for authentication, the final part is to enable the client to authenticate using LDAP as explained in this guide:
For more information, see the appropriate documentation from OpenLDAP Software document catalog and Ubuntu users can refer to the OpenLDAP server guide.
Summary
OpenLDAP is a open source implementation of LDAP in Linux. In this article, we have shown how to install and configure OpenLDAP server for centralized authentication, in Ubuntu 16.04/18.04 and CentOS 7. If you have a question or thoughts to share, do not hesitate to reach us via the comment form below.