
mshell v.1.4.1 Cheatsheet, January 26th, 2026.
EVERY DAY Programmer’s Notebook (Futuristic) – main features (January 2026).
This is a short description of the main features for Every Day Programmer’s Notebook – a natural client extension for the mshell Ecosystem (mshell v1.4.1 – shell for AI & Mathematics). Other parts of the ecosystem include mshell itself, as the core of the entire ecosystem, mshell Studio (mshell Library Manager + mshell Knowledge Database and Validator), and mshell Editor (edi): https://www.appservgrid.com/paw92/index.php/2026/01/05/mshell-ecosystem-short-description-of-main-components/
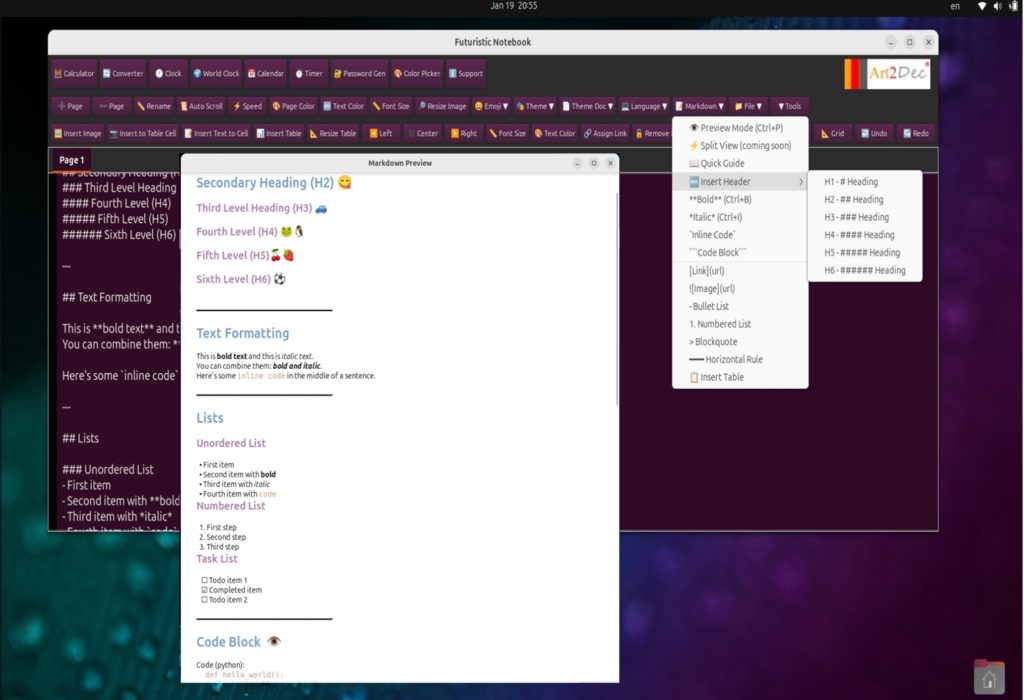
Inline Markdown Editor with Emoji support (January 2026).
Inline Markdown Editor with Emoji support (January 2026).
What is SUPPORTED:
Headings H1-H6 – all levels are available ✅
Horizontal rules (━━━) ✅
Bold text ✅
Italic text ✅
Inline code ✅
Bulleted lists (•) ✅
✅ Formatted lists
✅ Checkboxes
☐ (empty)
☑ (checked)
✅ Triple formatting:
bold and italic
✅ Code blocks ( )
✅ Blockquotes (>)
✅ Numbered lists (1. 2. 3.)
Everything works with inline formatting and preview. It has full integration with Futuristic Notebook and mshell v.1.4.1 for working with various programming languages. Perfect for creating README.md and other Markdown files on GitHub, in your version control systems and your development packages. Developed and tested on Ubuntu 24.04, Debian, Raspberry PI OS, MacOS Sequoia 15.5, aarch 64 GNU/Linux.
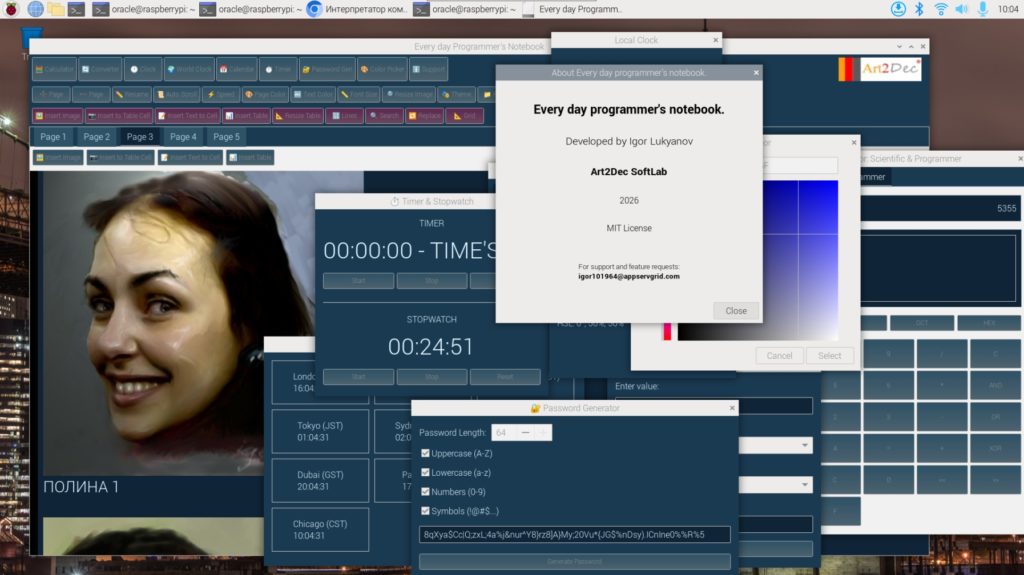
Every day programmer’s notebook (macOS version).

If you are a programmer and use a Linux, macOS, or Raspberry Pi machine as your daily workstation, or even as an occasional tool — this application is exactly what you need.
It’s not a single utility but a unified ecosystem of tools designed to simplify your everyday routine.
Instead of juggling dozens of separate apps, Everyday Programmer’s Notebook gives you one clean environment containing everything you constantly need.
What’s inside this unified suite?
- Scientific & Programmer Calculator
Two complete modes in one tool.
Scientific mode supports decimal arithmetic, logarithms, roots, powers, trigonometric functions (in degrees or radians), inverse operations and more.
Programmer mode works simultaneously in binary, octal, decimal and hexadecimal, performs logical operations (AND, OR, XOR, NOT, shifts) and standard arithmetic within all four numeral systems. - Unit Converter
Instant conversion between metric and imperial systems: length, area, volume, temperature and more.
Simple, accurate and always at hand. - Local Digital Clock
A clean, elegant digital time display synchronized with your system clock. - World Clock
Nine major world cities with automatic time-zone offsets, updated every second. - Timer & Stopwatch
Precise timing tools with start/stop/reset controls — perfect for productivity tracking or long-running tasks. - Calendar (25-year range)
A lightweight calendar viewer covering decades — ideal for scheduling, planning, or viewing past and future dates. - Password Generator (up to 64 characters)
Fully customizable:
Uppercase / lowercase letters, digits, symbols — enable or disable any group.
Creates strong passwords instantly. - Color Picker (two modes)
Digital palette (RGB/HEX/HSL) and analog spectrum mode.
Perfect for UI work, design, theming or coding. - Advanced Notebook / Text Reader & Editor
A powerful page-based notebook that supports text, images and tables on each page.
Key features include:
— Auto-scrolling (digital reading mode)
— Line numbering
— Grid overlays
— Page-specific background colors
— Per-page text color and font size
— Theme switching for the whole application
— Unlimited number of pages (limited only by your hardware)
— Import from TXT, MD, RTF, DOC, DOCX, PDF
— Export to TXT, HTML, Markdown, DOCX, PDF
— Image insertion
— Searching and Replacement options
— Table creation with text and/or images inside cells
— Saving & loading notebook files with virtually unlimited pages, limited only by the user’s hardware
This is not a simple notebook — it is a unified environment for writing, reading, organizing, and presenting your information. Contact info about Everyday programmer’s notebook (all versions: MacOS, Linux, Raspberry PI) Igor Lukyanov, Art2Dec SoftLab, igor_lukyanov@appservgrid.com
Every day programmer’s notebook (Linux version).

If you are a programmer and use a Linux, macOS, or Raspberry Pi machine as your daily workstation, or even as an occasional tool — this application is exactly what you need.
It’s not a single utility but a unified ecosystem of tools designed to simplify your everyday routine.
Instead of juggling dozens of separate apps, Everyday Programmer’s Notebook gives you one clean environment containing everything you constantly need.
What’s inside this unified suite?
- Scientific & Programmer Calculator
Two complete modes in one tool.
Scientific mode supports decimal arithmetic, logarithms, roots, powers, trigonometric functions (in degrees or radians), inverse operations and more.
Programmer mode works simultaneously in binary, octal, decimal and hexadecimal, performs logical operations (AND, OR, XOR, NOT, shifts) and standard arithmetic within all four numeral systems. - Unit Converter
- Local Digital Clock
- World Clock
- Timer & Stopwatch
- Infinite Calendar (GTK-powered)
- Password Generator (up to 64 characters)
Uppercase / lowercase letters, digits, symbols — enable or disable any custom group.
Creates strong passwords instantly. - Color Picker (two modes)
Digital palette (RGB/HEX/HSL) and analog spectrum mode. - Advanced Notebook / Text Reader & Editor
A powerful page-based notebook that supports text, images and tables on each page.
— Auto-scrolling (digital reading mode)
— Line numbering
— Grid overlays
— Page-specific background colors
— Per-page text color and font size
— Theme switching for the whole application
— Unlimited number of pages (limited only by your hardware)
— Searching and Replacement options
— Import from TXT, MD, RTF, DOC, DOCX, PDF
— Export to TXT, HTML, Markdown, DOCX, PDF
— Image insertion
— Table creation with text and/or images inside cells
— Saving & loading notebook files with virtually unlimited pages, limited only by the user’s hardware
This is not a simple notebook — it is an unified environment for writing, reading, organizing, and presenting your information. Contact info about Everyday programmer’s notebook: Igor Lukyanov, Art2Dec SoftLab, igor_lukyanov@appservgrid.com
Every day programmer’s notebook (Raspberry PI version).
If you are a programmer and use a Linux, macOS, or Raspberry Pi machine as your daily workstation, or even as an occasional tool — this application is exactly what you need.
It’s not a single utility but a unified ecosystem of tools designed to simplify your everyday routine.
Instead of juggling dozens of separate apps, Everyday Programmer’s Notebook gives you one clean environment containing everything you constantly need.
What’s inside this unified suite?
- Scientific & Programmer Calculator
Two complete modes in one tool.
Scientific mode supports decimal arithmetic, logarithms, roots, powers, trigonometric functions (in degrees or radians), inverse operations and more.
Programmer mode works simultaneously in binary, octal, decimal and hexadecimal, performs logical operations (AND, OR, XOR, NOT, shifts) and standard arithmetic within all four numeral systems. - Unit Converter
- Local Digital Clock
- World Clock
- Timer & Stopwatch
- Infinite Calendar (GTK-powered)
- Password Generator (up to 64 characters)
Uppercase / lowercase letters, digits, symbols — enable or disable any custom group.
Creates strong passwords instantly. - Color Picker (two modes)
Digital palette (RGB/HEX/HSL) and analog spectrum mode. - Advanced Notebook / Text Reader & Editor
A powerful page-based notebook that supports text, images and tables on each page.
— Auto-scrolling (digital reading mode)
— Line numbering
— Grid overlays
— Page-specific background colors
— Per-page text color and font size
— Theme switching for the whole application
— Unlimited number of pages (limited only by your hardware)
— Searching and Replacement options
— Import from TXT, MD, RTF, DOC, DOCX, PDF
— Export to TXT, HTML, Markdown, DOCX, PDF
— Image insertion
— Table creation with text and/or images inside cells
— Saving & loading notebook files with virtually unlimited pages, limited only by the user’s hardware
This is not a simple notebook — it is an unified environment for writing, reading, organizing, and presenting your information. Contact info about Everyday programmer’s notebook: Igor Lukyanov, Art2Dec SoftLab, igor_lukyanov@appservgrid.com