However, in order to gather data and create statistics about local services or other specific system resources that run on remote instances, such as CPU, disks, internal system process, RAM, etc, you need to install and configure a Zabbix agent.
This tutorial will focus on how to install latest version of Zabbix 3.4 Server on Debian/Ubuntu and RHEL/CentOS 7 with MySQL/MariaDB backend database to store collected data, PHP and Apache Web Server as the mainly web interface.
Important: The given Zabbix instructions also works on all Debian derivatives and RedHat based systems like RHEL/CentOS and Fedora.
Step 1: Install Apache Web Server and PHP
1. First, install Apache Web Server alongside with PHP and its extensions in order to provide the web backed functionality for Zabbix Server by issuing the following command.
--------------- On Debian/Ubuntu ---------------
$ sudo apt-get install apache2 php7.0 php7.0-mysql php7.0-ldap php7.0-bcmath php7.0-mbstring php7.0-gd php7.0-xml php7.0-mcrypt

--------------- On CentOS/RHEL ---------------
# yum -y install epel-release
# yum install httpd php php-mysql php-ldap php-bcmath- php-mbstring php-gd php-xml php-mcrypt
2. Next, you need to tune PHP interpreter and adjust some values in order to run Zabbix Server. So, open Apache php.ini configuration file for editing by issuing the following command:
$ sudo nano /etc/php/7.0/apache2/php.ini 	[On Debian/Ubuntu]
# vi /etc/php.ini				[On RHEL/CentOS 7]
Now, search with CTRL+C and replace the following PHP values as it follows:
max_execution_time 300
memory_limit 128M
always_populate_raw_post_data -1
session.auto_start = 0
mbstring.func_overload = 0
date.timezone = Europe/Bucharest
Replace the date.timezone variable according to your server geographical location. A list of PHP supported Timezones can be found here http://php.net/manual/en/timezones.php.
3. After updating PHP configuration file, restart Apache daemon to reflect changes by issuing the following command.
$ sudo systemctl restart apache2.service	 [On Debian/Ubuntu]
# systemctl restart httpd.service		 [On RHEL/CentOS 7]
Step 2: Install MariaDB Database and Library
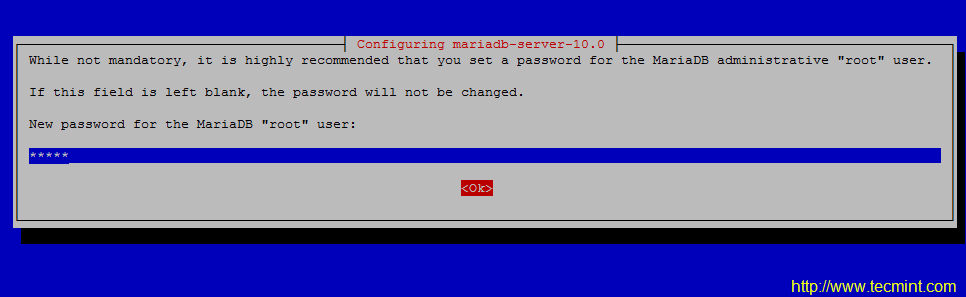
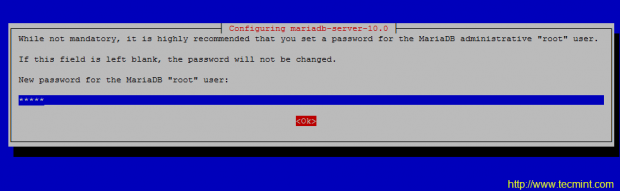
4. On the next step install MariaDB database and MySQL development library from binary packages. As MariaDB installs on your system you will be asked to set a password for the database root user during installation (Only on Debian 8/9). Choose a strong password, repeat it and wait for the installation to finish.
$ sudo apt-get install mariadb-server mariadb-client libmysqld-dev	 [On Debian/Ubuntu]
# yum install mariadb-server mariadb-client mariadb-devel	         [On RHEL/CentOS 7]
Set MySQL root Password
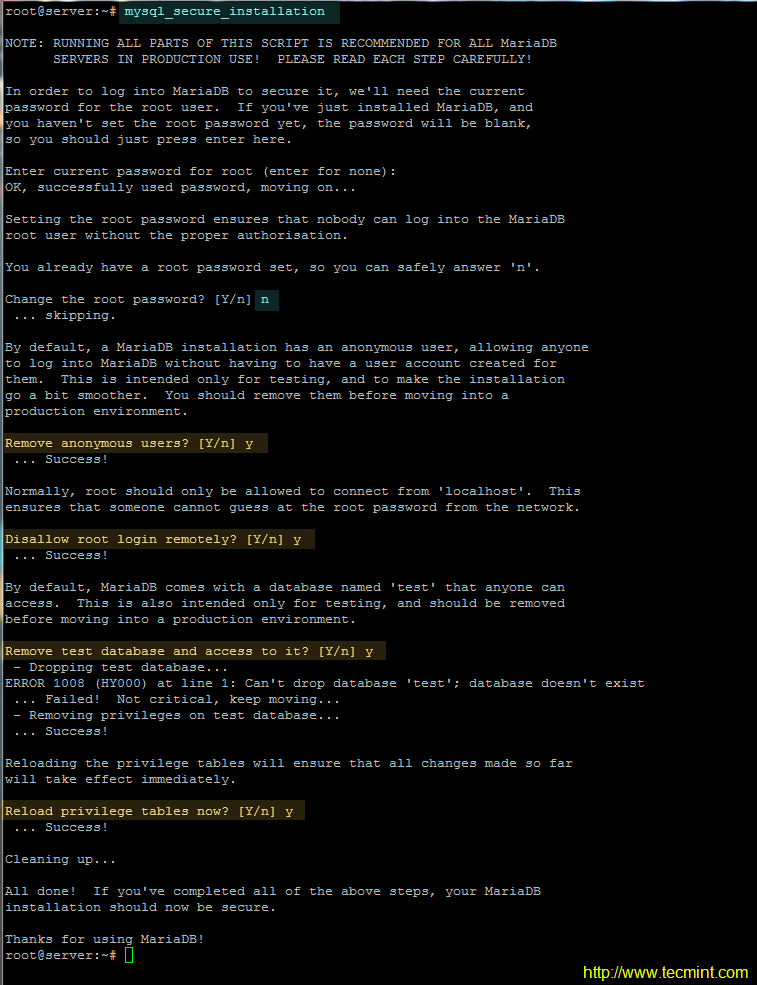
5. When the installation of Mariadb finishes, secure the database by issuing mysql_secure_installationcommand with system root privileges ( answer with yes for removing anonymous users, disable root login remotely, remove test database and access to it and apply all changes).
# mysql_secure_installation
Use the below screenshot as a guide.
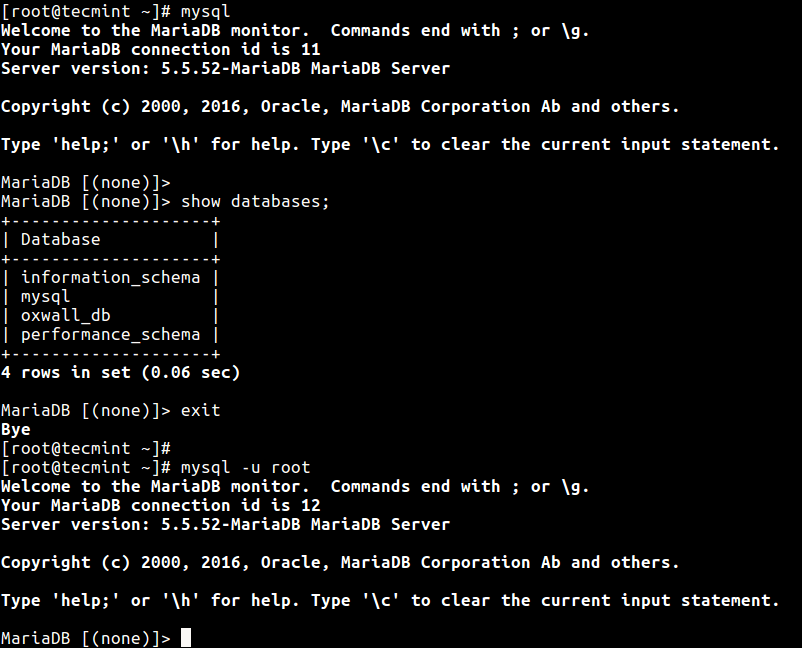
6. The next requirement for Zabbix is setting-up a RDBMS database. Log in to your LAMP stack database component (MySQL or MariaDB) and create a Zabbix database and the credentials required to manage the database, by issuing the following commands.
Make sure you replace database name, user and password to match your own settings.
# mysql -u root -p
MariaDB [(none)]> create database zabbixdb character set utf8 collate utf8_bin;
MariaDB [(none)]> grant all privileges on zabbixdb.* to 'zabbixuser'@'localhost' identified by 'password1';
MariaDB [(none)]> flush privileges;
MariaDB [(none)]> exit
Step 3: Install Zabbix Server
7. Now, start to install Zabbix server and Zabbix PHP frontend application by adding the official Zabbix repositories to your system package manager by issuing the following commands with root privileges.
Install Zabbix on Debian
# wget http://repo.zabbix.com/zabbix/3.4/debian/pool/main/z/zabbix-release/zabbix-release_3.4-1+stretch_all.deb
# dpkg -i zabbix-release_3.4-1+stretch_all.deb
# apt update
# apt install zabbix-server-mysql zabbix-frontend-php
Install Zabbix on Ubuntu
# wget http://repo.zabbix.com/zabbix/3.4/ubuntu/pool/main/z/zabbix-release/zabbix-release_3.4-1+xenial_all.deb
# dpkg -i zabbix-release_3.4-1+xenial_all.deb
# apt-get update
# apt install zabbix-server-mysql zabbix-frontend-php
Install Zabbix on CentOS
# rpm -ivh http://repo.zabbix.com/zabbix/3.4/rhel/7/x86_64/zabbix-release-3.4-2.el7.noarch.rpm
# yum install zabbix-server-mysql zabbix-web-mysql
If you want to download and compile an older version, please visit Zabbix official Sourceforge repositories.
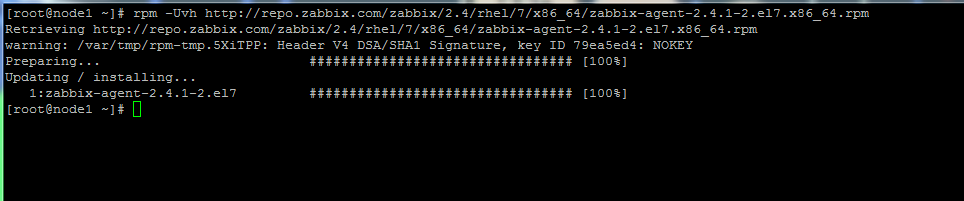
8. Next, issue the below command with root privileges in order to install Zabbix agent in your system. Zabbix client will be used to actively monitor server’s local system resources.
# apt install zabbix-agent    [On Debian/Ubuntu]
# yum install zabbix-agent    [On RHEL/CentOS 7]
9. On the next step, restart Apache HTTP server in order to apply Zabbix configuration file installed for Apache.
# systemctl restart apache2   [On Debian/Ubuntu]
# systemctl restart httpd     [On RHEL/CentOS 7]
# setenforce 0                [Disable SELinux on RHEL/CentOS 7]
Step 4: Configure Zabbix Server and Agent
10. Before configuring the server, first, import Zabbix initial database schema to MySQL database. Import the schema against the database created for Zabbix application, by issuing the below command.
# zcat /usr/share/doc/zabbix-server-mysql/create.sql.gz | mysql -u zabbixuser zabbixdb -p
11. On the next step, setup Zabbix server by opening the main configuration file for editing with the following command.
# nano /etc/zabbix/zabbix_server.conf
In zabbix_server.conf file search and modify the following lines as presented in the below excerpt. Update the variables to reflect your own database settings.
DBHost=localhost
DBName=zabbixdb
DBUser=zabbixuser
DBPassword=password1
12. Finally, save and close Zabbix server configuration file by pressing Ctrl+o and Ctrl+x file and restart Zabbix daemon to apply changes by issuing the below command.
# systemctl restart zabbix-server.service
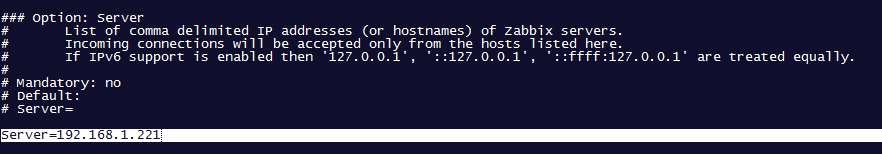
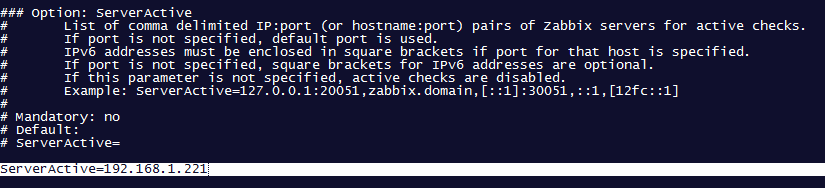
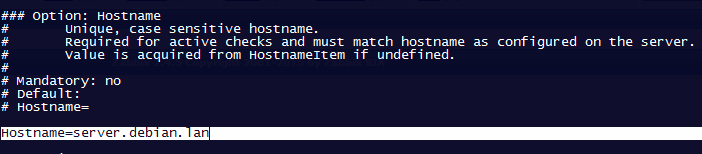
13. Next, configure Zabbix Agent configuration file by updating the following lines. First, open the file for editing.
# nano /etc/zabbix/zabbix_agentd.conf
Zabbix agent configuration file excerpt:
Server=127.0.0.1
ListenPort=10050
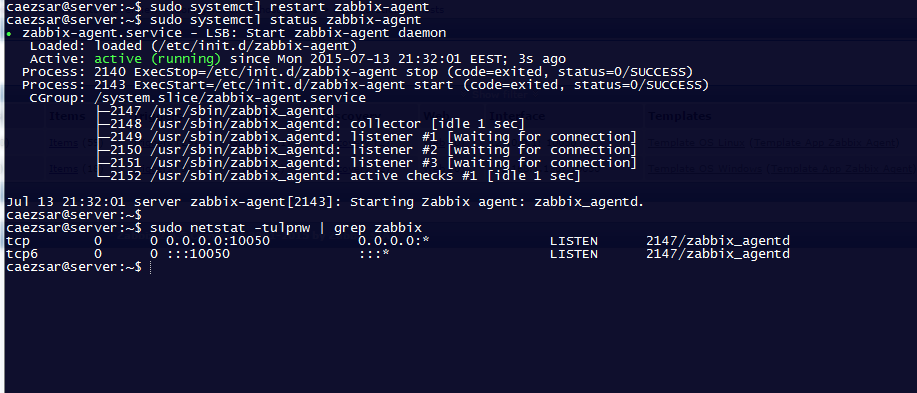
14. Save and close Zabbix agent configuration file and restart Zabbix Agent to reflect changes by issuing the following command.
# systemctl restart zabbix-agent.service
Step 5: Install and Configure Zabbix Frontend Interface
15. Now it’s time to install Zabbix Server Frontend web interface. In order to accomplish this step open a browser and navigate to your server IP Address using HTTP or HTTPS protocol and the welcome screen should appear. Hit the Next button to move forward.
http://192.168.1.151/zabbix/setup.php
OR
https://192.168.1.151/zabbix/setup.php
On the first welcome screen, just hit the Next step button to move to the new step of the installation process.
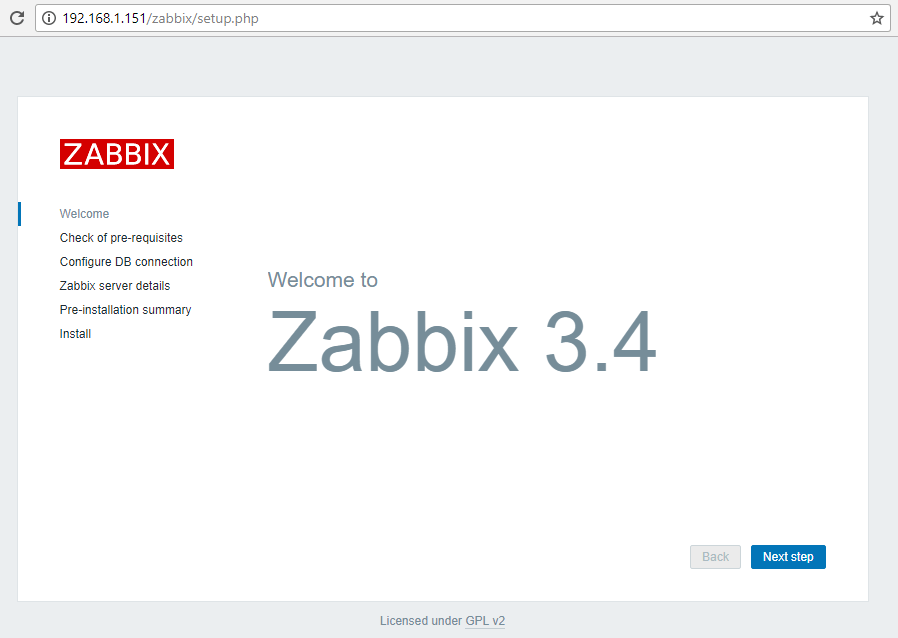
Zabbix Welcome Screen
16. After a series of checks, if all pre-requires values are satisfied, hit the Next button to proceed further.
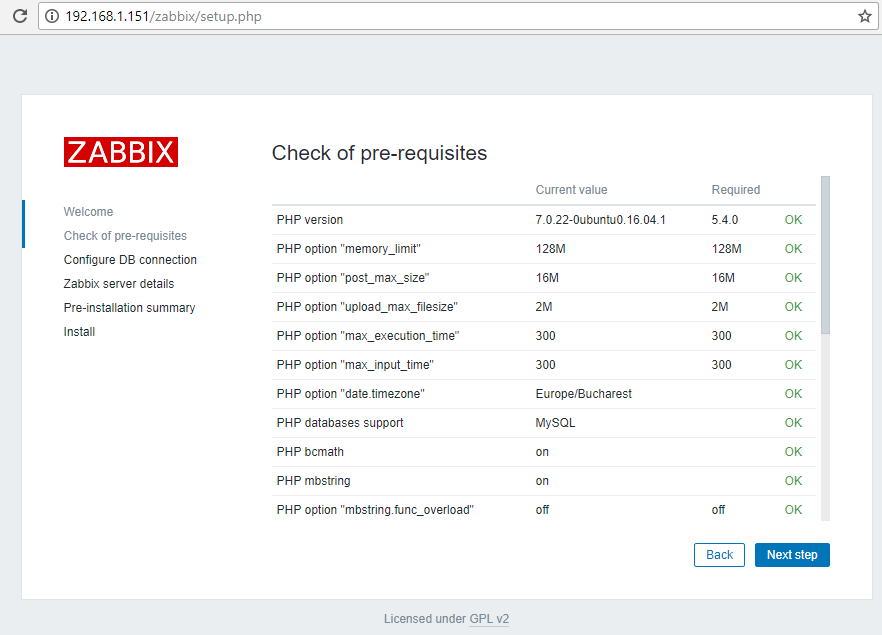
Check Zabbix Pre-Requisites
17. On the next step provide the settings for MySQL database, hit the Test connection button to test MySQL connectivity and move to the step by pressing the Next button.
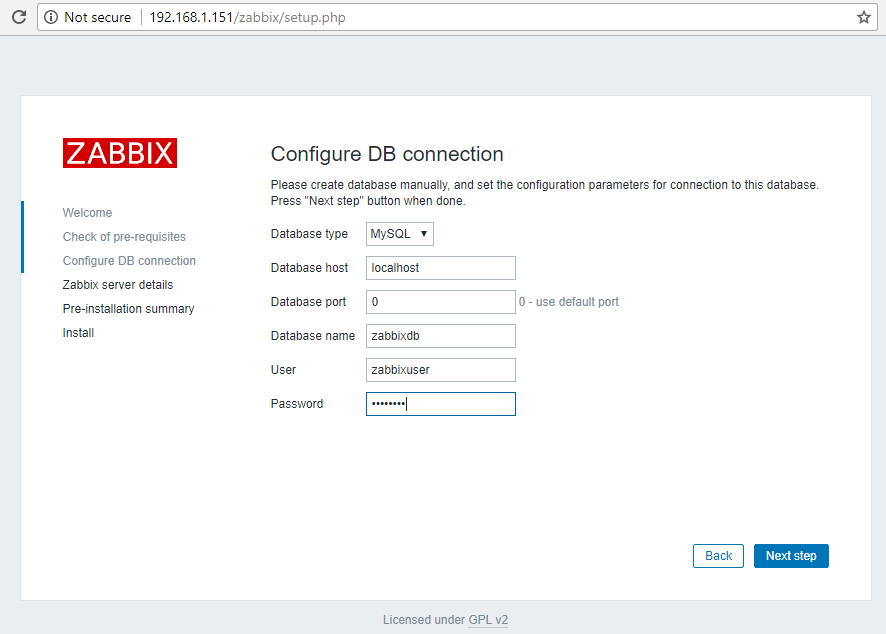
Zabbix DB Configuration
18. Next, supply the Host (or IP Address) and the Port of the Zabbix server (use the host localhost and the port 10051 because zabbix server is configured to run on the same host as the zabbix frontend web interface in this tutorial) and a Name for Zabbix frontend installation. When you’re done hit Next to continue.
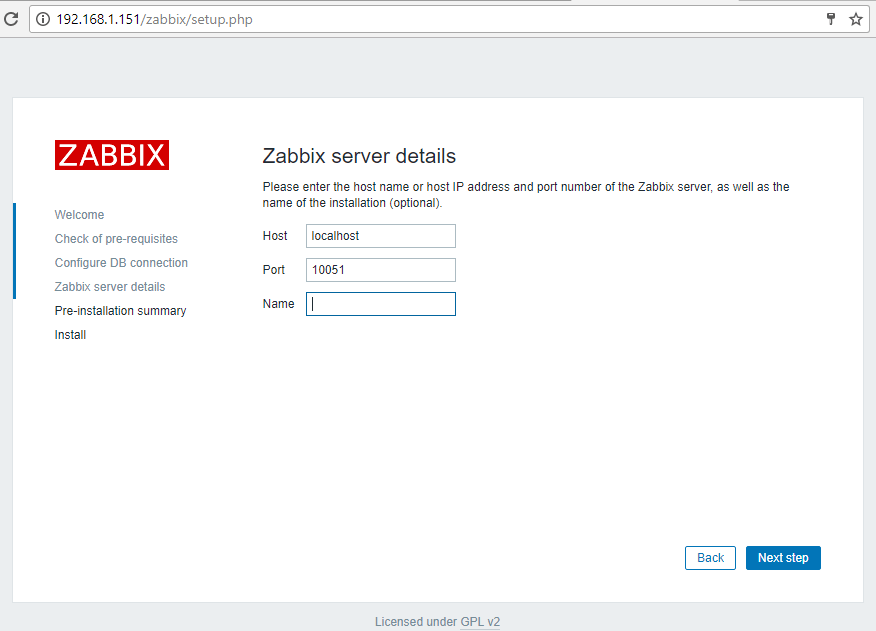
Zabbix Server Details
19. Next, check all the configurations parameters, enter command line and issue the following command to grant zabbix permissions to write the apache web configuration file in conf directory.
Then switch back to web interface and hit Next button to write zabbix configuration file.
# chown -R www-data /var/www/html/conf/		[on Debian 8]
# chown -R apache /var/www/html/conf/		[on RHEL/CentOS 7]
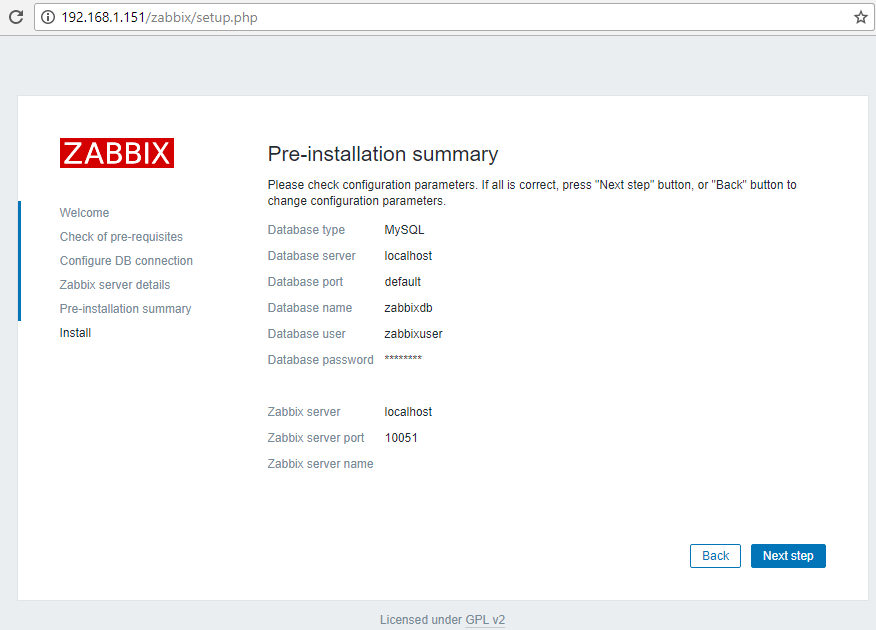
Zabbix Pre-Installation Summary
20. After the installation process completes, a congratulations message will appear in your browser. Hit on Finish button to exit Zabbix frontend installer.
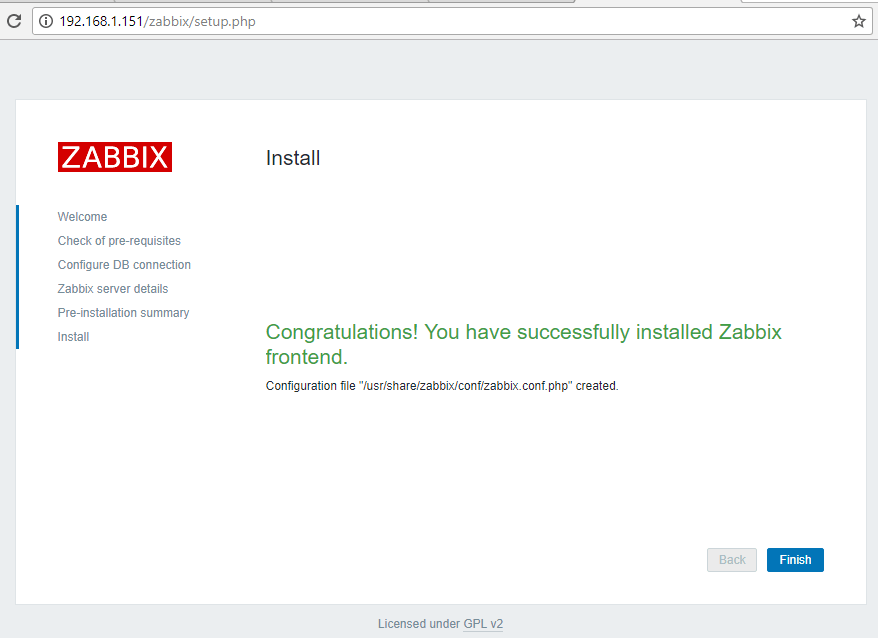
Zabbix Installation Completed
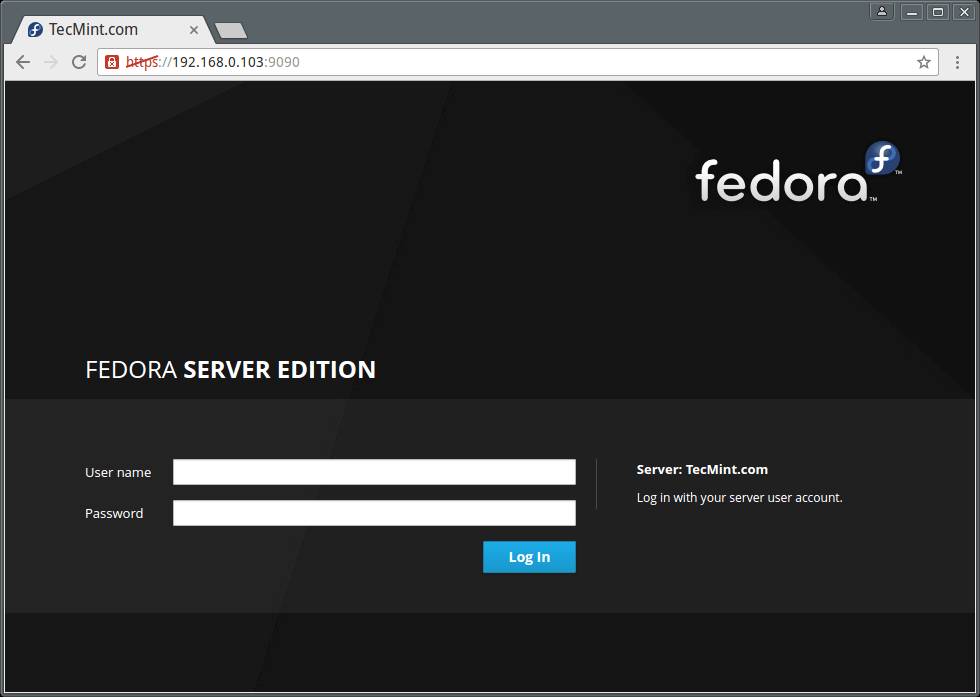
21. Finally, navigate to your server IP address or domain name by appending /zabbix URL address and log in to Zabbix web admin panel with the default credentials presented below.
https://your_domain.tld/zabbix/
Username: Admin
Password: zabbix
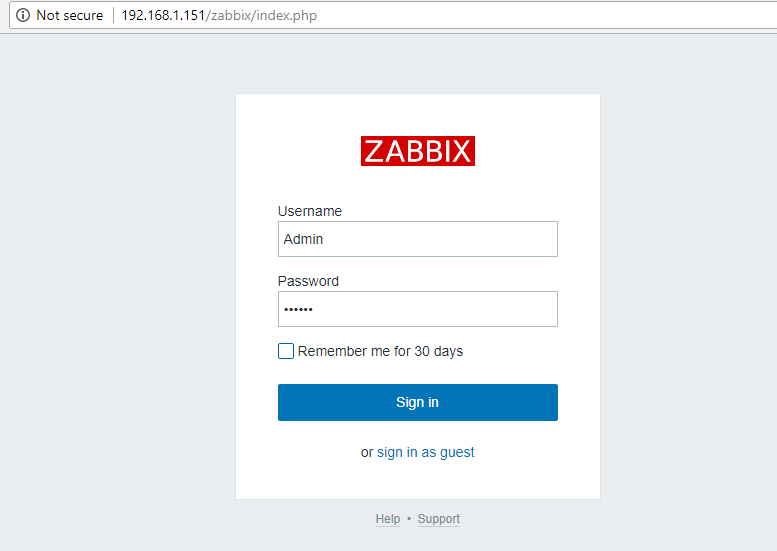
Zabbix Admin Login
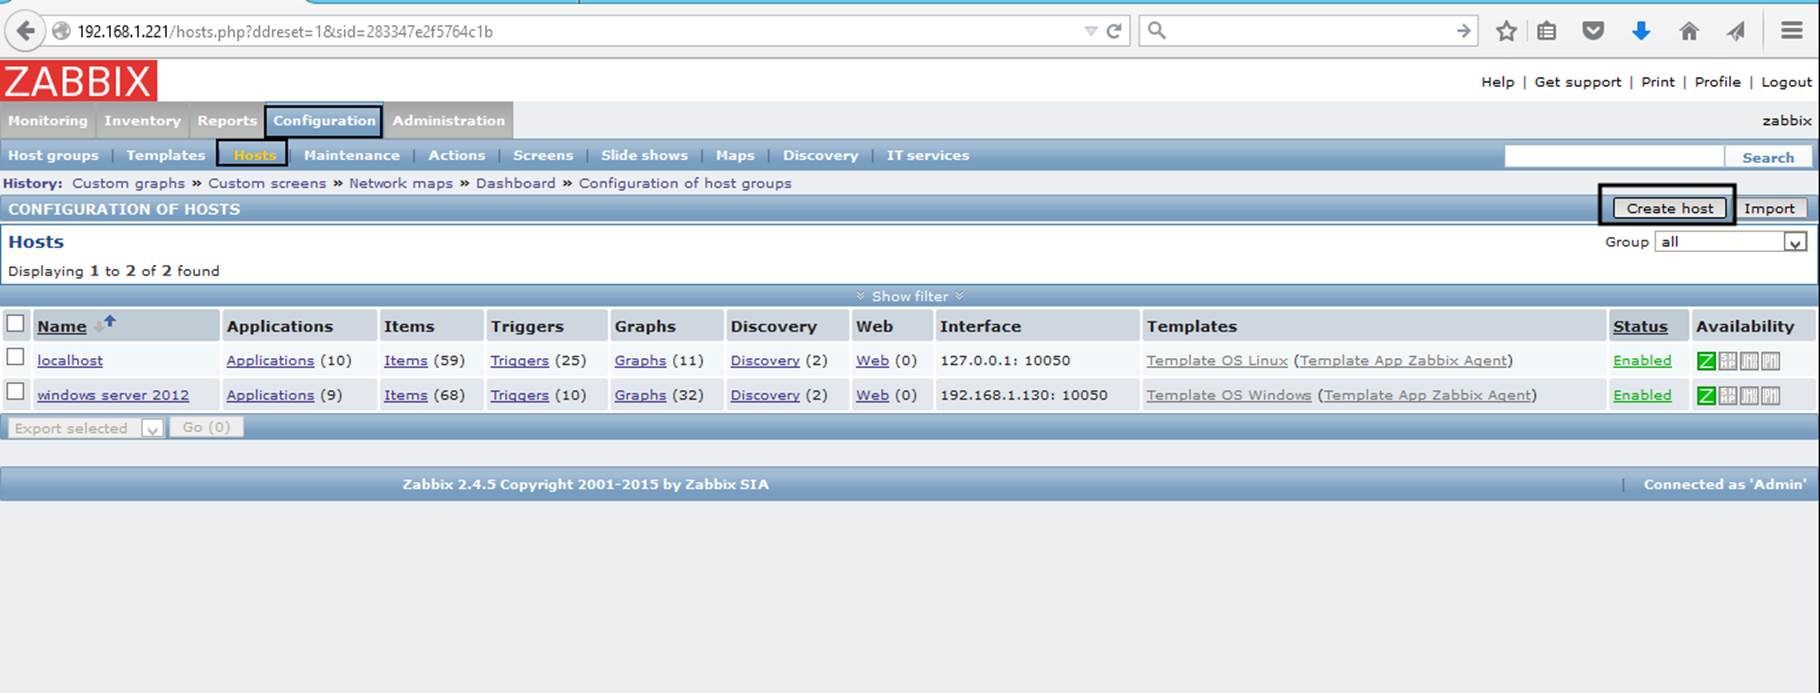
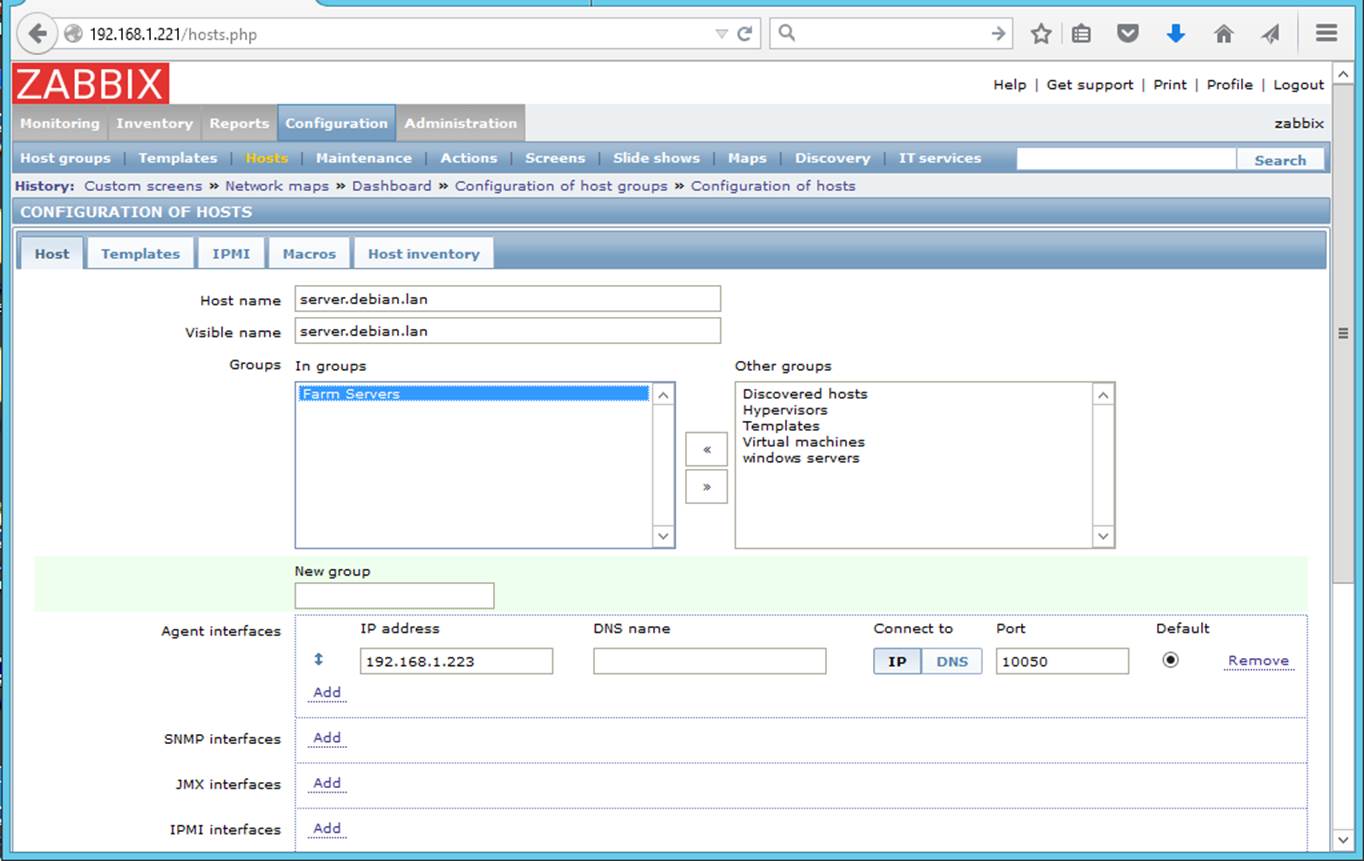
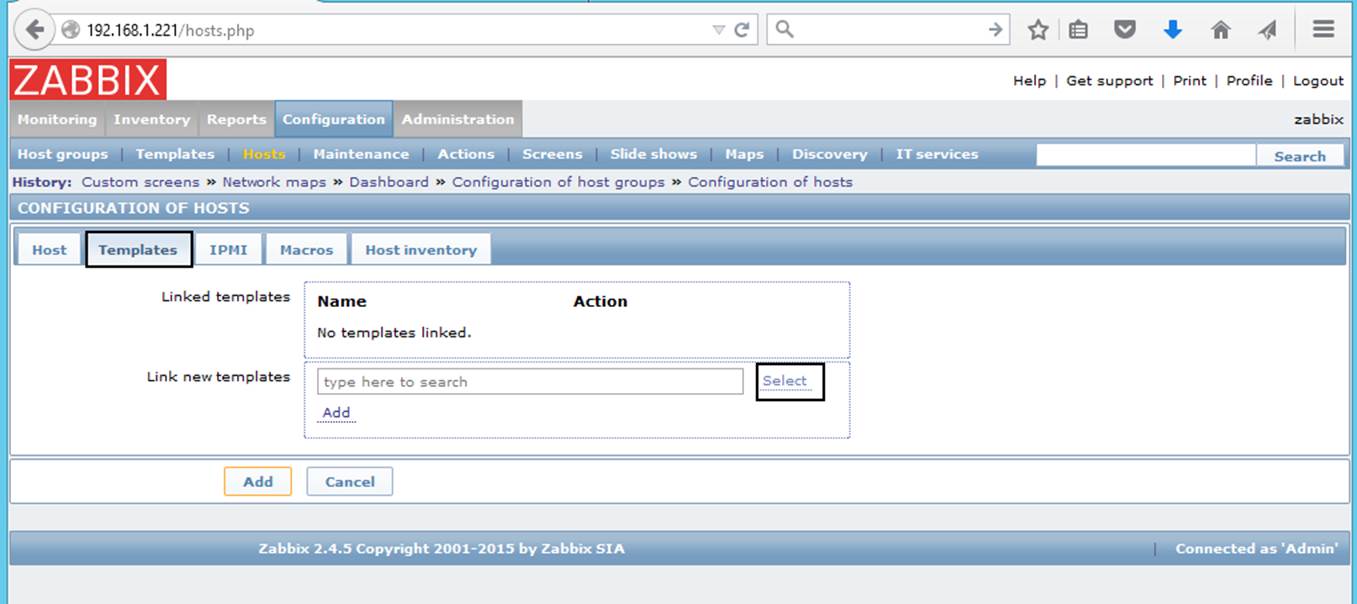
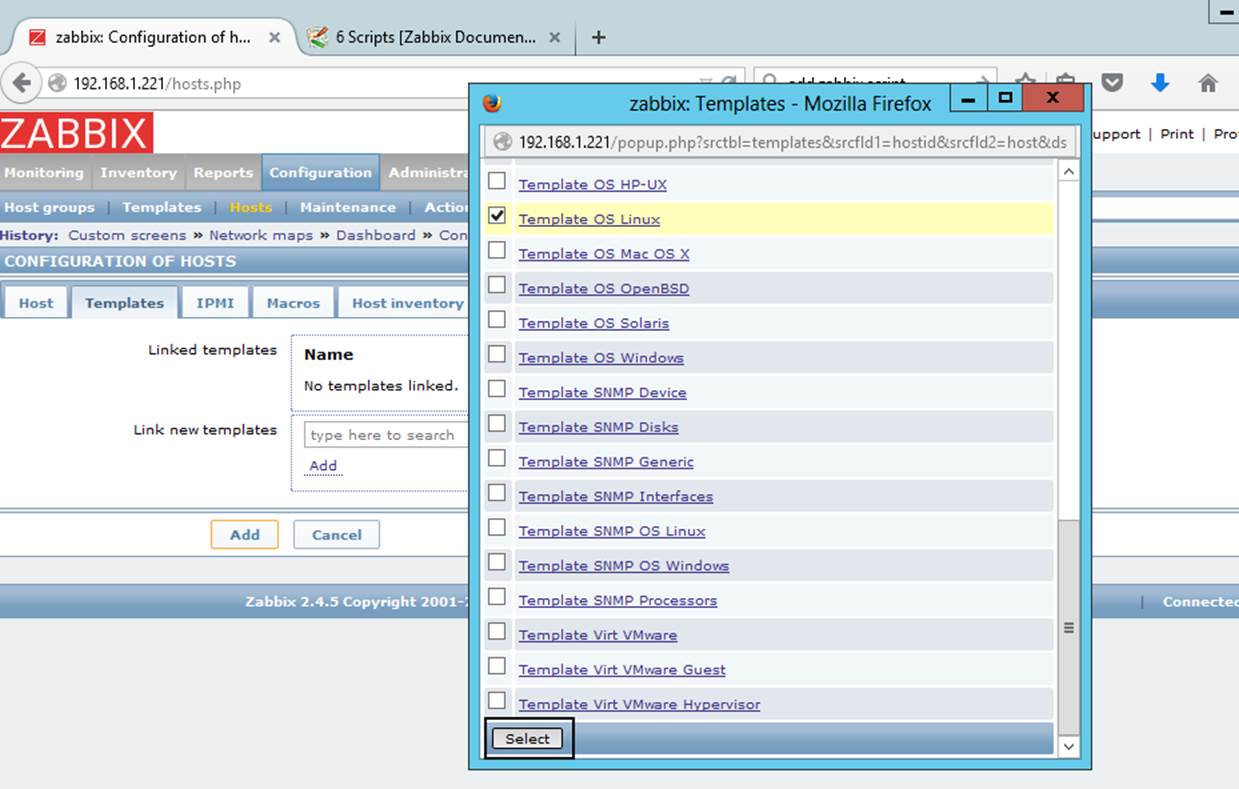
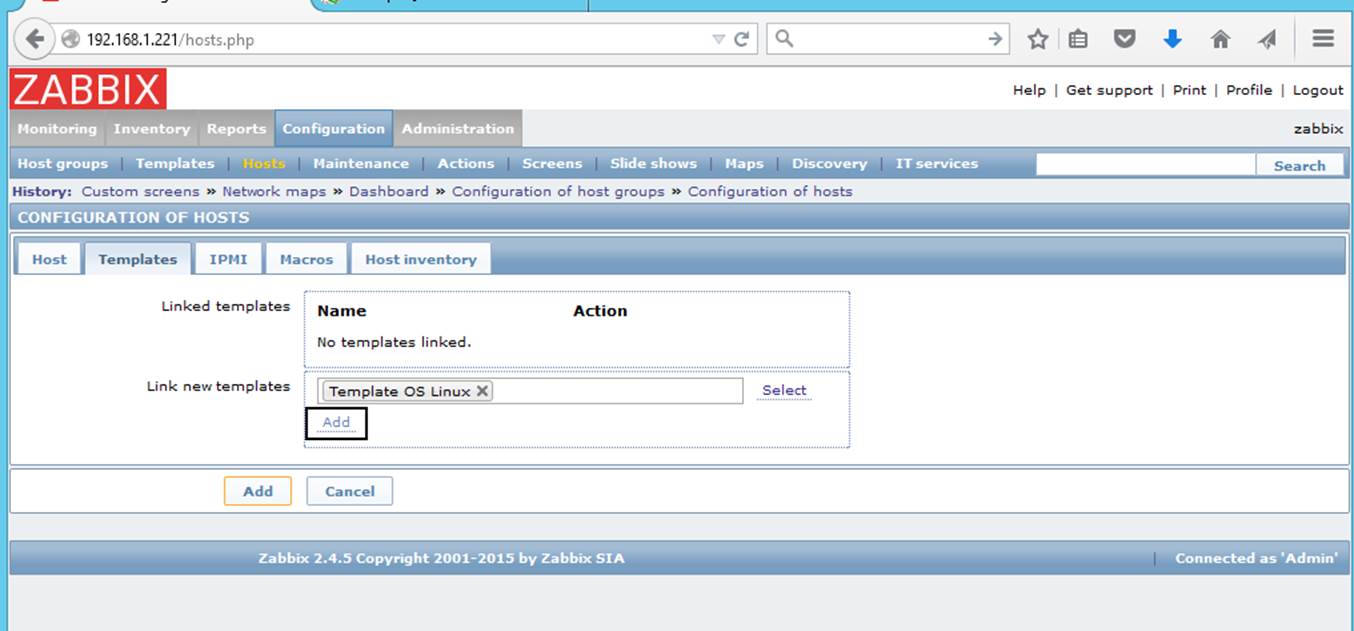
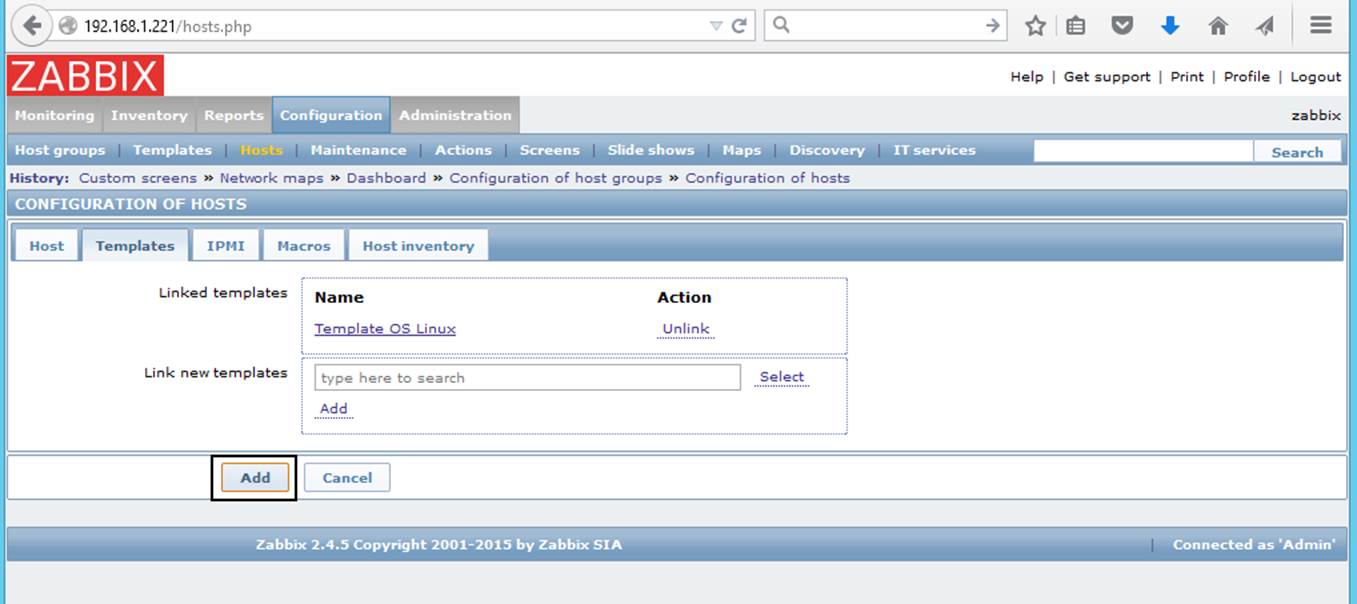
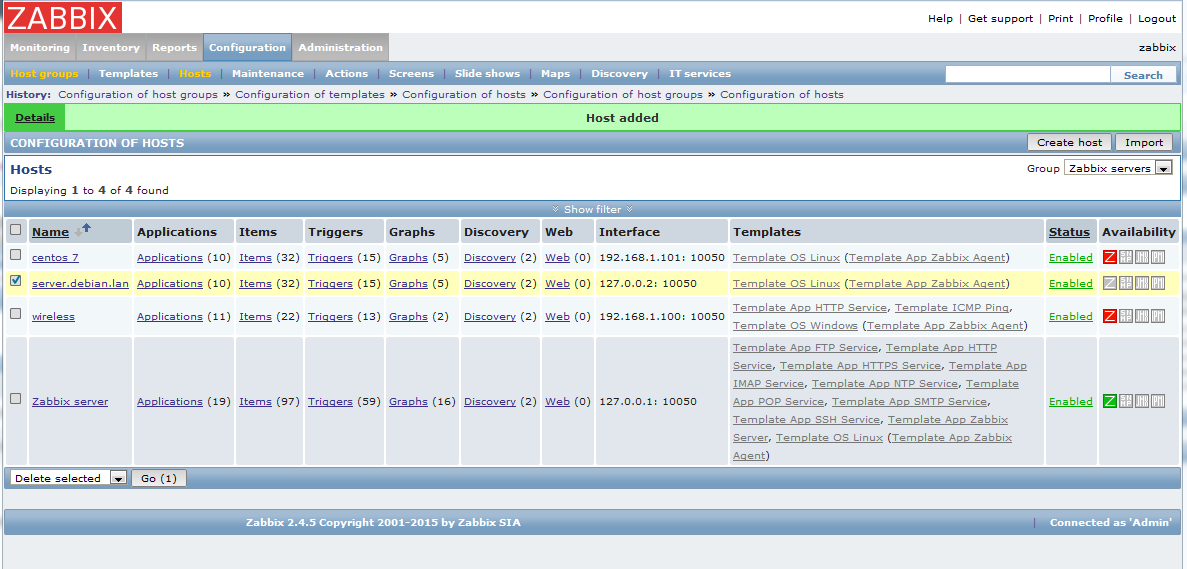
22. After you’ve logged in to Zabbix admin panel, you can start to configure Zabbix and add new network resources to be monitored by Zabbix server.
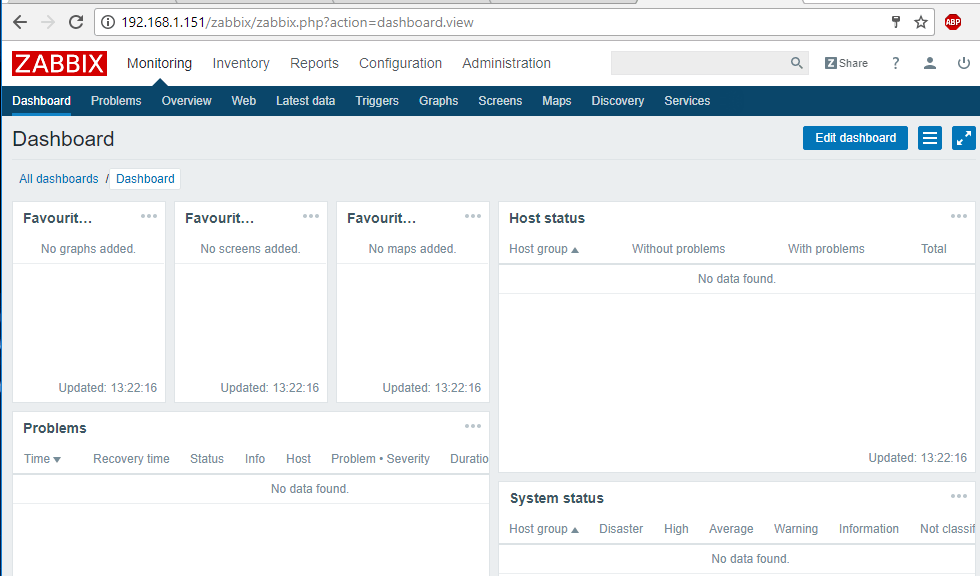
Zabbix Dashboard
23. To change Zabbix frontend admin account password, navigate to Administration -> Users –> User and hit on Change password button and add your new password, as illustrated in the below screenshot. Finally, hit on the bottom Update button in order to save admin account new password.
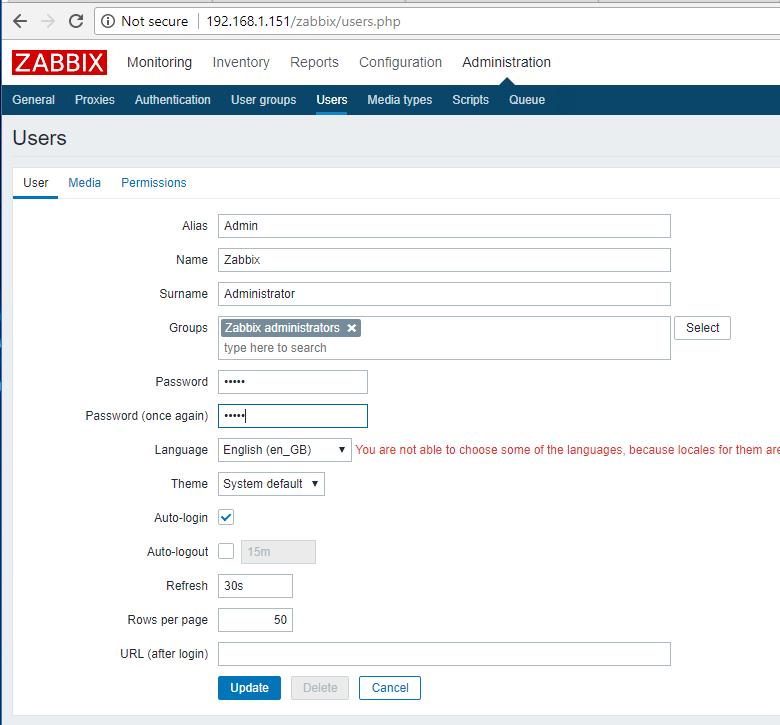
Change Zabbix Admin Password
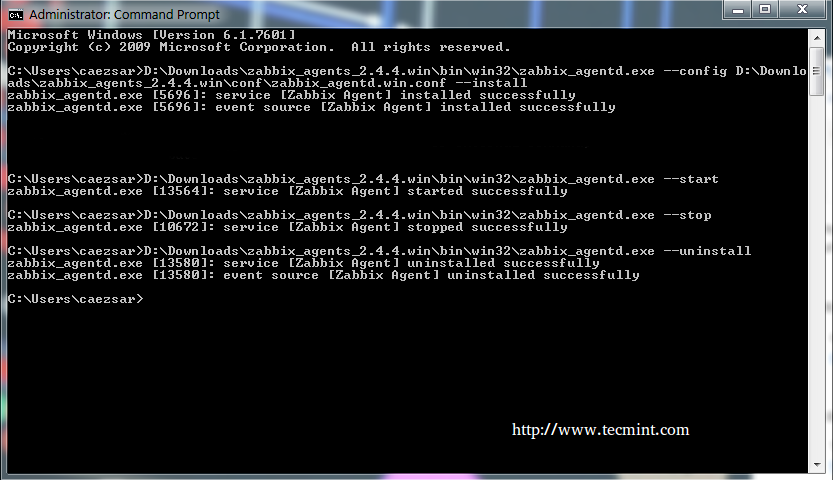
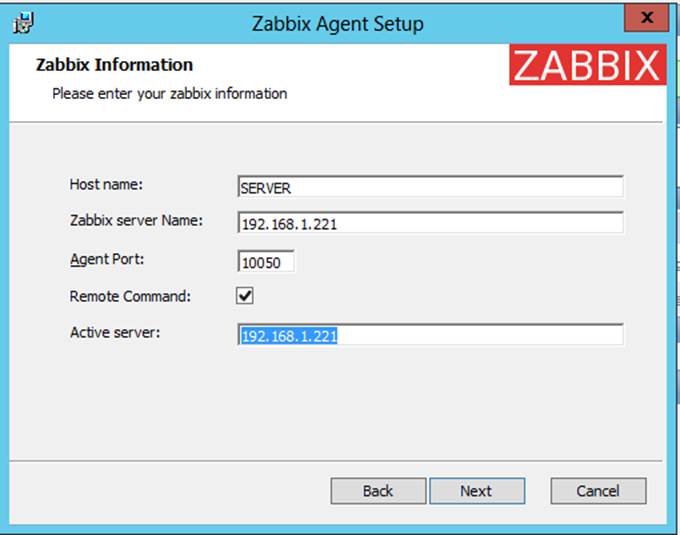
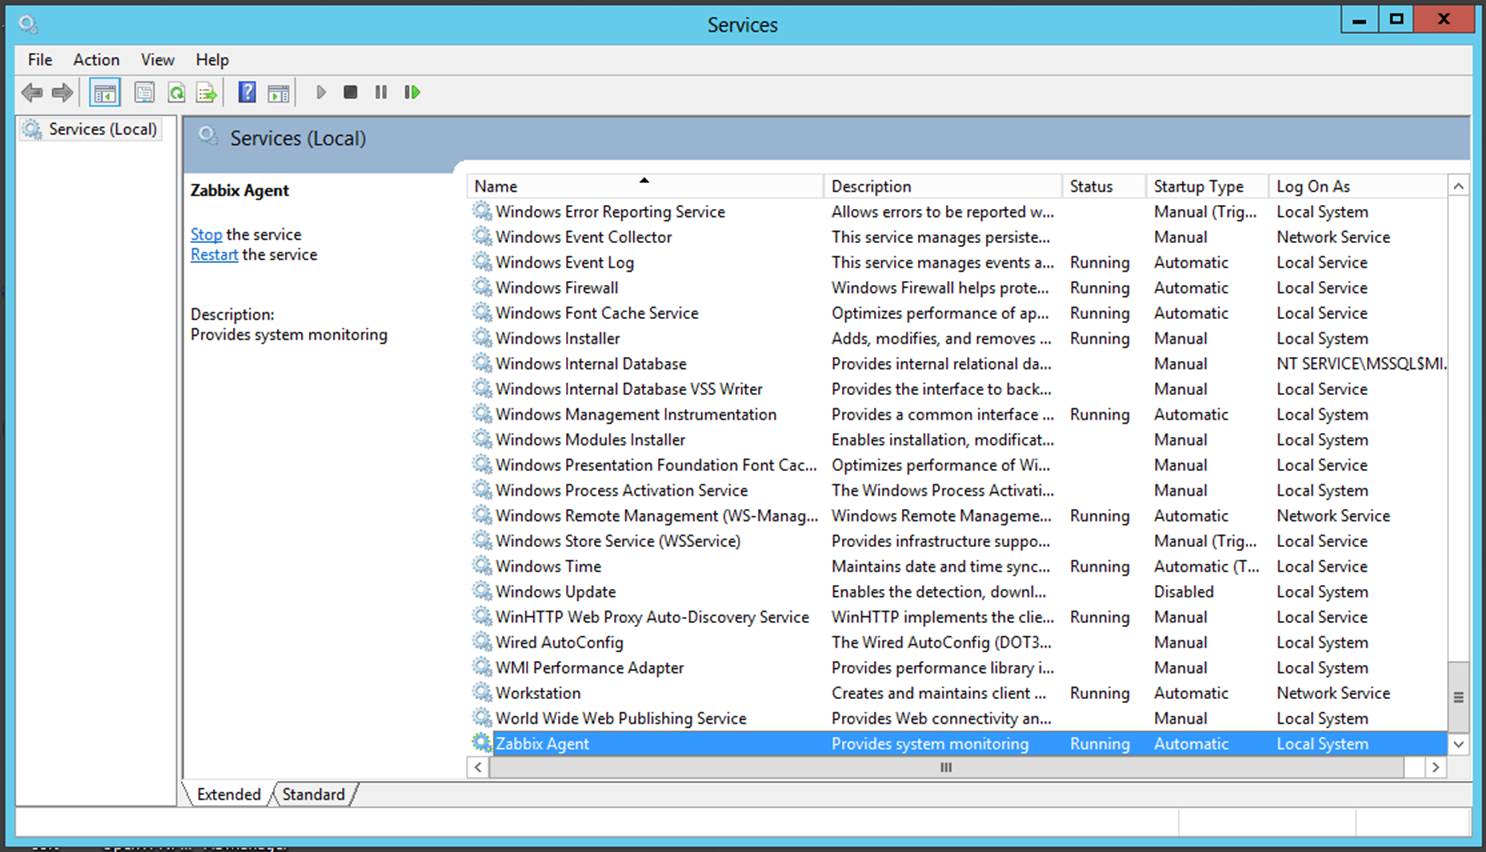
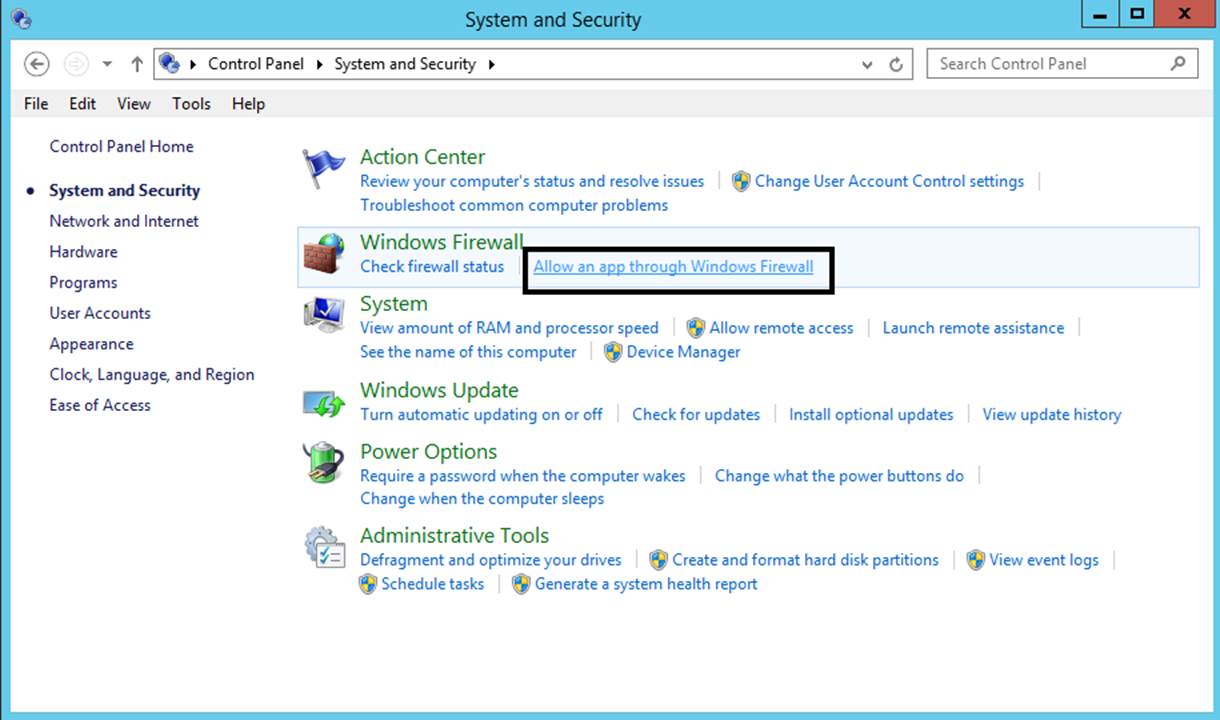
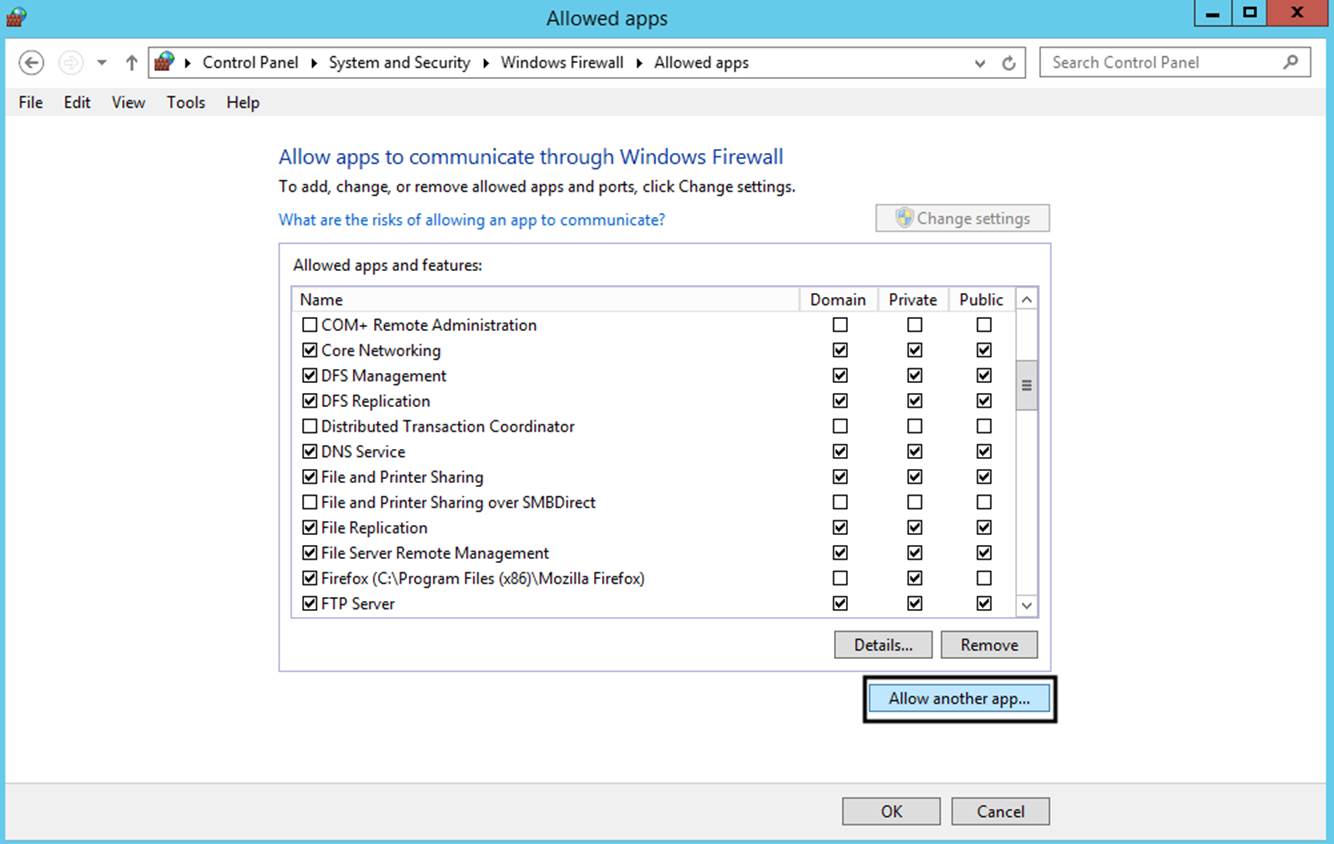
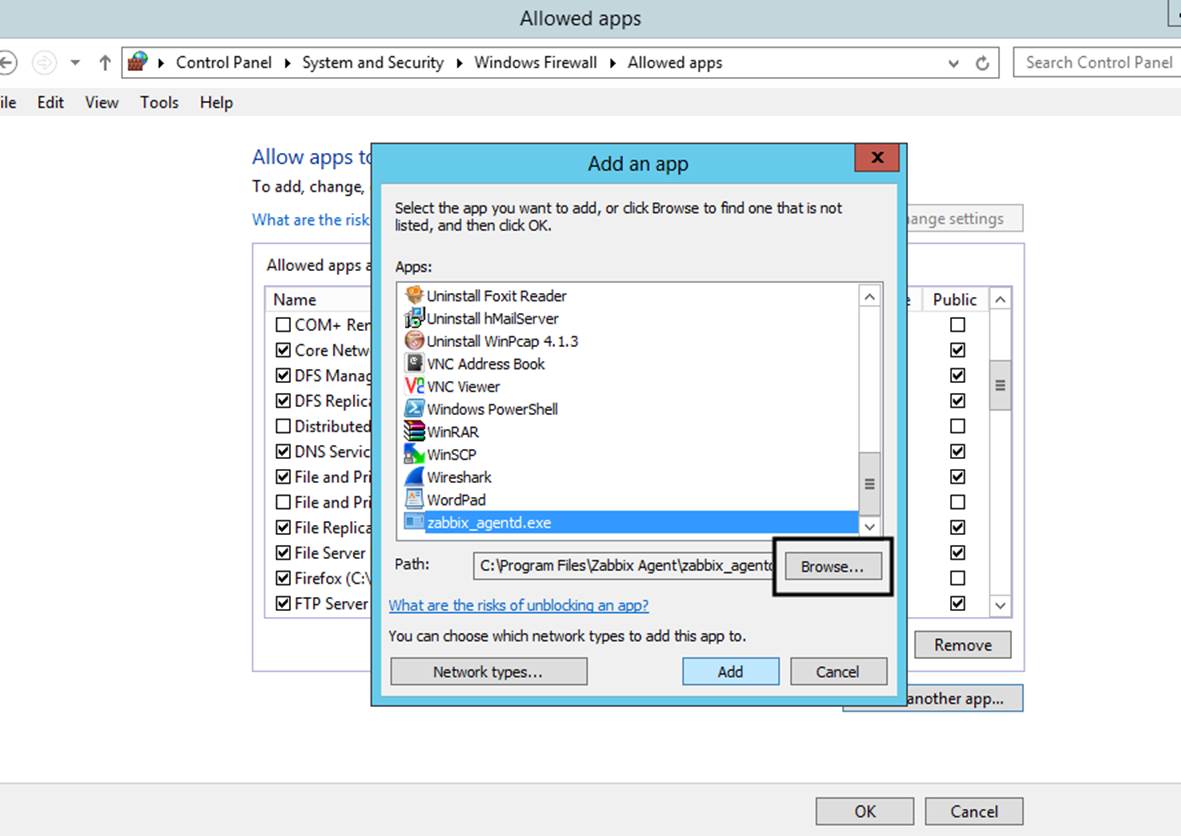
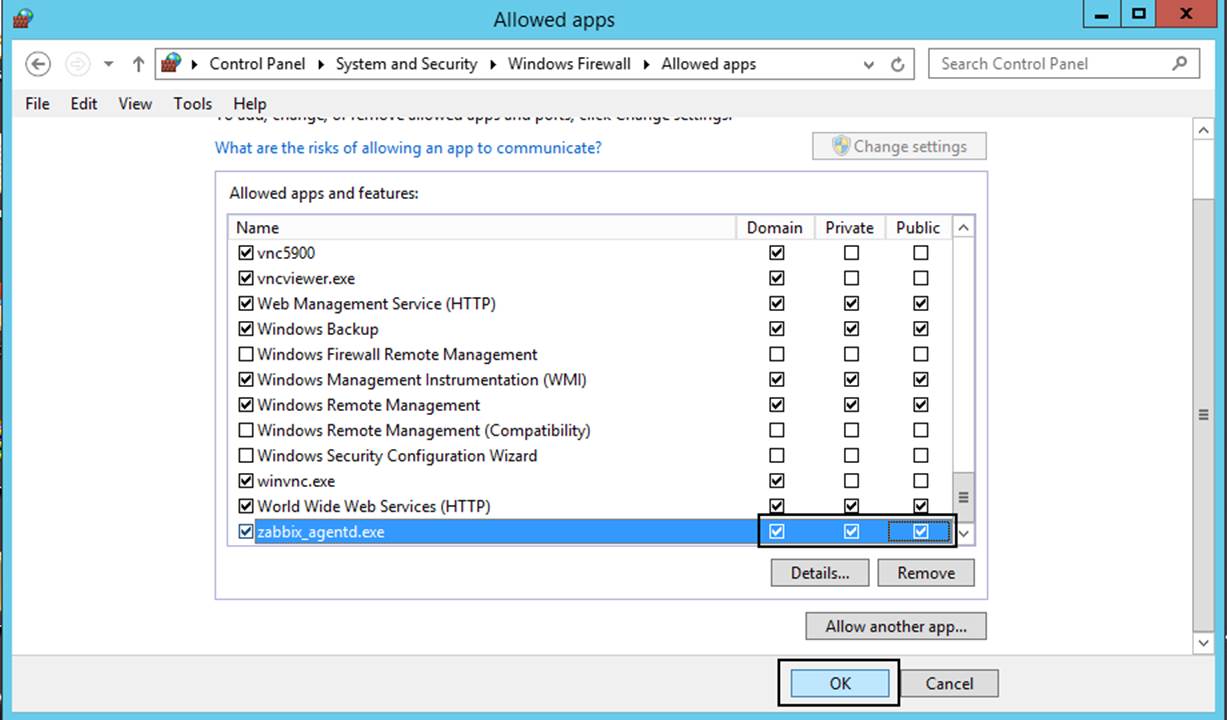
That’all! On the next series concerning Zabbix monitoring system will discuss how to setup the server further using the web interface and how to install and configure Zabbix agents on different Linux distributions or even Windows systems.
Source