How to Sync Two Apache Web Servers/Websites Using Rsync

There are so many tutorials available on web to mirror or take a backup of your web files with different methods, here I am creating this article for my future reference and here I’ll be using a very simple and versatile command of Linux to create a backup of your website. This tutorial will help you to sync data between your two web servers with “Rsync“.

Sync Apache Web Server

Sync Two Apache Web Server

The purpose of creating a mirror of your Web Server with Rsync is if your main web server fails, your backup server can take over to reduce downtime of your website. This way of creating a web server backup is very good and effective for small and medium size web businesses.

Advantages of Syncing Web Servers

The main advantages of creating a web server backup with rsync are as follows:

  1. Rsync syncs only those bytes and blocks of data that have changed.
  2. Rsync has the ability to check and delete those files and directories at backup server that have been deleted from the main web server.
  3. It takes care of permissions, ownerships and special attributes while copying data remotely.
  4. It also supports SSH protocol to transfer data in an encrypted manner so that you will be assured that all data is safe.
  5. Rsync uses compression and decompression method while transferring data which consumes less bandwidth.

How To Sync Two Apache Web Servers

Let’s proceed with setting up rsync to create a mirror of your web server. Here, I’ll be using two servers.

Main Server
  1. IP Address: 192.168.0.100
  2. Hostname: webserver.example.com
Backup Server
  1. IP Address: 192.168.0.101
  2. Hostname: backup.example.com

Step 1: Install Rsync Tool

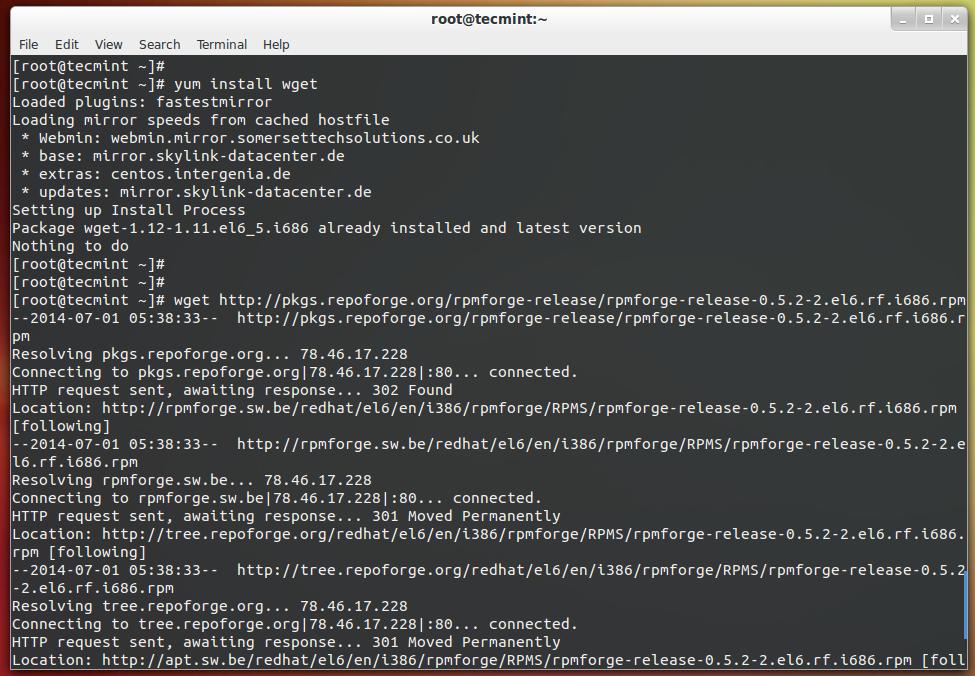
Here in this case web server data of webserver.example.com will be mirrored on backup.example.com. And to do so first, we need to install Rsync on both the server with the help of following command.

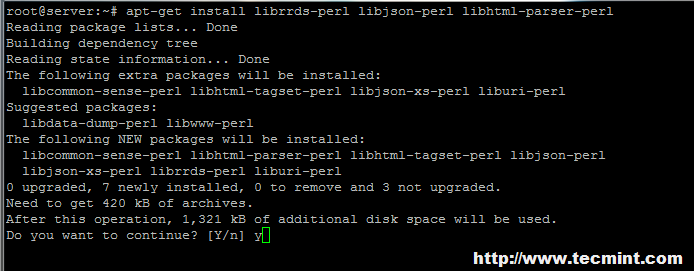
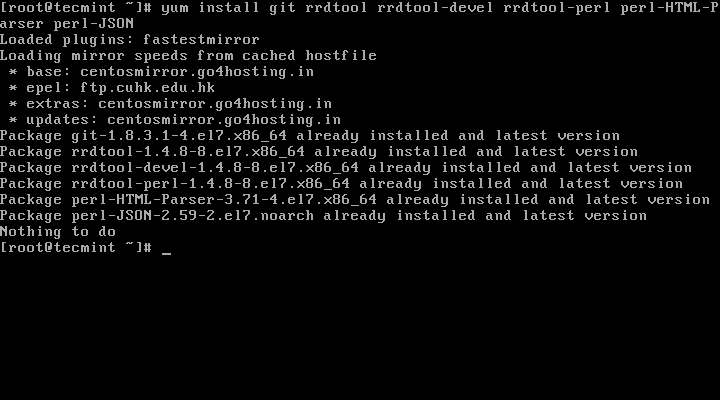
[root@tecmint]# yum install rsync        [On Red Hat based systems]
[root@tecmint]# apt-get install rsync    [On Debian based systems]

Step 2: Create a User to run Rsync

We can setup rsync with root user, but for security reasons, you can create an unprivileged user on main webserver i.e webserver.example.com to run rsync.

[root@tecmint]# useradd tecmint
[root@tecmint]# passwd tecmint

Here I have created a user “tecmint” and assigned a password to user.

Step 3: Test Rsync Setup

It’s time to test your rsync setup on your backup server (i.e. backup.example.com) and to do so, please type following command.

[root@backup www]# rsync -avzhe ssh tecmint@webserver.example.com:/var/www/ /var/www
Sample Output
tecmint@webserver.example.com's password:

receiving incremental file list
sent 128 bytes  received 32.67K bytes  5.96K bytes/sec
total size is 12.78M  speedup is 389.70

You can see that your rsync is now working absolutely fine and syncing data. I have used “/var/www” to transfer; you can change the folder location according to your needs.

Step 4: Automate Sync with SSH Passwordless Login

Now, we are done with rsync setups and now its time to setup a cron for rsync. As we are going to use rsync with SSH protocol, ssh will be asking for authentication and if we won’t provide a password to cron it will not work. In order to work cron smoothly, we need to setup passwordless ssh logins for rsync.

Here in this example, I am doing it as root to preserve file ownerships as well, you can do it for alternative users too.

First, we’ll generate a public and private key with following commands on backups server (i.e. backup.example.com).

[root@backup]# ssh-keygen -t rsa -b 2048

When you enter this command, please don’t provide passphrase and click enter for Empty passphrase so that rsync cron will not need any password for syncing data.

Sample Output
Generating public/private rsa key pair.
Enter file in which to save the key (/root/.ssh/id_rsa):
Enter passphrase (empty for no passphrase):
Enter same passphrase again:
Your identification has been saved in /root/.ssh/id_rsa.
Your public key has been saved in /root/.ssh/id_rsa.pub.
The key fingerprint is:
9a:33:a9:5d:f4:e1:41:26:57:d0:9a:68:5b:37:9c:23 root@backup.exmple.com
The key's randomart image is:
+--[ RSA 2048]----+
|          .o.    |
|           ..    |
|        ..++ .   |
|        o=E *    |
|       .Sooo o   |
|       =.o o     |
|      * . o      |
|     o +         |
|    . .          |
+-----------------+

Now, our Public and Private key has been generated and we will have to share it with main server so that main web server will recognize this backup machine and will allow it to login without asking any password while syncing data.

[root@backup html]# ssh-copy-id -i /root/.ssh/id_rsa.pub root@webserver.example.com

Now try logging into the machine, with “ssh ‘root@webserver.example.com‘”, and check in.ssh/authorized_keys.

[root@backup html]# root@webserver.example.com

Now, we are done with sharing keys. To know more in-depth about SSH password less login, you can read our article on it.

  1. SSH Passwordless Login in in 5 Easy Steps

Step 5: Schedule Cron To Automate Sync

Let’s setup a cron for this. To setup a cron, please open crontab file with the following command.

[root@backup ~]# crontab –e

It will open up /etc/crontab file to edit with your default editor. Here In this example, I am writing a cron to run it every 5 minutes to sync the data.

*/5        *        *        *        *   rsync -avzhe ssh root@webserver.example.com:/var/www/ /var/www/

The above cron and rsync command simply syncing “/var/www/” from the main web server to a backup serverin every 5 minutes. You can change the time and folder location configuration according to your needs. To be more creative and customize with Rsync and Cron command, you can check out our more detailed articles at:

  1. 10 Rsync Commands to Sync Files/Folders in Linux
  2. 11 Cron Scheduling Examples in Linux

Source

GoAccess (A Real-Time Apache and Nginx) Web Server Log Analyzer

GoAccess is an interactive and real time web server log analyzer program that quickly analyze and view web server logs. It comes as an open source and runs as a command line in Unix/Linux operating systems. It provides brief and beneficial HTTP (web server) statistics report for Linux administrators on the fly. It also take care of both the Apache and Ngnix web server log formats.

GoAccess parses and analyze the given web server log formats in preferred options including CLF (Common Log Format), W3C format (IIS) and Apache virtual hosts and then generate output of the data to the terminal.

GoAccess Features

It has the following features.

  1. General Statistics, bandwidth etc.
  2. Top Visitors, Visitors Time Distribution, Referring Sites & URLs and 404 or Not Found.
  3. Hosts, Reverse DNS, IP Location.
  4. Operating Systems, Browsers and Spiders.
  5. HTTP Status Codes
  6. Geo Location – Continent/Country/City
  7. Metrics per Virtual Host
  8. Support for HTTP/2 & IPv6
  9. Ability to output JSON and CSV
  10. Incremental log processing and support for large datasets + data persistence
  11. Different Color Schemes

How Do I Install GoAccess?

Presently, the most recent version of GoAccess 0.9.7 is not available from default system package repositories, so to install latest stable version, you need to manually download and compile it from source code under Linux systems as shown:

Install GoAccess from Source

# yum install ncurses-devel glib2-devel geoip-devel
# cd /usr/src
# wget http://tar.goaccess.io/goaccess-0.9.8.tar.gz
# tar zxvf goaccess-0.9.8.tar.gz
# cd goaccess-0.9.8/
# ./configure
# make; make install

Install GoAccess Using Package Manager

The easiest and preferred way to install GoAccess on Linux using the default package manager of your respective Linux distribution.

Note: As I said above, not all distributions will have the most recent version of GoAccess available in the system default repositories..

On RedHat, CentOS and Fedora
# yum install goaccess
# dnf install goaccess    [From Fedora 23+ versions]
On Debian and Ubuntu Systems

GoAccess utility is available since Debian Squeeze 6 and Ubuntu 11.04. To install just run the following command on the terminal.

# apt-get install goaccess

Note: The above command will not always provide you the most latest version. To get the latest stable version of GoAccess, add the official GoAccess Debian & Ubuntu repository as shown:

$ echo "deb http://deb.goaccess.io/ $(lsb_release -cs) main" | sudo tee -a /etc/apt/sources.list.d/goaccess.list
$ wget -O - http://deb.goaccess.io/gnugpg.key | sudo apt-key add -
$ sudo apt-get update
$ sudo apt-get install goaccess

How Do I Use GoAccess?

Once, goaccess is installed, execute ‘goaccess‘ command without any arguments will list the help menu.

# goaccess
Sample Output
GoAccess - 0.9.8

Usage: goaccess [ options ... ] -f log_file [-c][-M][-H][-q][-d][...]
The following options can also be supplied to the command:

Log & Date Format Options

  --log-format=        - Specify log format. Inner quotes need to
                                    be escaped, or use single quotes.
  --date-format=      - Specify log date format. e.g.,
                                    %d/%b/%Y
  --time-format=      - Specify log time format. e.g.,
                                    %H:%M:%S

User Interface Options

  -c --config-dialog              - Prompt log/date/time configuration
                                    window.
  -i --hl-header                  - Color highlight active panel.
  -m --with-mouse                 - Enable mouse support on main dashboard.
  --color=<fg:bg[attrs, PANEL]>   - Specify custom colors. See manpage for
                                    more details and options.
  --color-scheme=<1|2>            - Color schemes: 1 => Grey, 2 => Green.
  --html-report-title=     - Set HTML report page title and header.
  --no-color                      - Disable colored output.
  --no-column-names               - Don't write column names in term
                                    output.
  --no-csv-summary                - Disable summary metrics on the CSV
                                    output.
  --no-progress                   - Disable progress metrics.
  --no-tab-scroll                 - Disable scrolling through panels on TAB.

File Options

  -f --log-file=        - Path to input log file.
  -l --debug-file=      - Send all debug messages to the specified
                                    file.
  -p --config-file=     - Custom configuration file.
  --invalid-requests=   - Log invalid requests to the specified
                                    file.
  --no-global-config              - Don't load global configuration
                                    file.
.....

The easiest way to get the any web server statistics use the flag ‘f‘ with input log file name as shown below. The below command will give you general statistics of your web server logs.

# goaccess -f /var/log/httpd/tecmint.com
# goaccess -f /var/log/nginx/tecmint.com

The above command gives you an complete overview of web server metrics by showing summaries of various reports as panels on a one scrollable view as shown.

Apache Logs Overview

View Web Server Apache Logs

View Web Server Apache Logs

Apache Logs by Operating System – Overview

View Apache Logs By Operating System

View Apache Logs By Operating System

Apache Logs by Visitor Bandwidth – Overview

View Apache Visitor Bandwidth Usage

View Apache Visitor Bandwidth Usage

Apache Logs by Web Browser – Overview

View Apache Usage based on Browsers

View Apache Usage based on Browsers

How do I generate Apache HTML report?

To generate an HTML report of your Apache webserver logs, just run it against your web log file.

# goaccess -f /var/log/httpd/access_log > reports.html

Monitor Apache Logs Using Web Browser

GoAccess: Monitor Apache Logs Using Web Browser

For more information and usage please visit http://goaccess.io/.

Source

httpstat – A Curl Statistics Tool to Check Website Performance

httpstat is a Python script that reflects curl statistics in a fascinating and well-defined way, it is a single file which is compatible with Python 3 and requires no additional software (dependencies) to be installed on a users system.

It is fundamentally a wrapper of cURL tool, means that you can use several valid cURL options after a URL(s), excluding the options -w-D-o-s, and -S, which are already employed by httpstat.

httpstat Curl Statistics Tool

httpstat Curl Statistics Tool

You can see in the above image an ASCII table displaying how long each process took, and for me the most important step is “server processing” – if this number is higher, then you need to tune your server to speed up website.

For website or server tuning you can check our articles here:

  1. 5 Tips to Tune Performance of Apache Web Server
  2. Speed Up Apache and Nginx Performance Upto 10x
  3. How to Boost Nginx Performance Using Gzip Module
  4. 15 Tips to Tune MySQL/MariaDB Performance

Grab httpstat to check out your website speed using following instillation instructions and usage.

Install httpstat in Linux Systems

You can install httpstat utility using two possible methods:

1. Get it directly from its Github repo using the wget command as follows:

$ wget -c https://raw.githubusercontent.com/reorx/httpstat/master/httpstat.py

2. Using pip (this method allows httpstat to be installed on your system as a command) like so:

$ sudo pip install httpstat

Note: Make sure pip package installed on the system, if not install it using your distribution package manager yum or apt.

How to Use httpstat in Linux

httpstat can be used according to the way you installed it, if you directly downloaded it, run it using the following syntax from within the download directory:

$ python httpstat.py url cURL_options 

In case you used pip to install it, you can execute it as a command in the form below:

$ httpstat url cURL_options  

To view the help page for httpstat, issue the command below:

$ python httpstat.py --help
OR
$ httpstat --help
httpstat help
Usage: httpstat URL [CURL_OPTIONS]
       httpstat -h | --help
       httpstat --version

Arguments:
  URL     url to request, could be with or without `http(s)://` prefix

Options:
  CURL_OPTIONS  any curl supported options, except for -w -D -o -S -s,
                which are already used internally.
  -h --help     show this screen.
  --version     show version.

Environments:
  HTTPSTAT_SHOW_BODY    Set to `true` to show response body in the output,
                        note that body length is limited to 1023 bytes, will be
                        truncated if exceeds. Default is `false`.
  HTTPSTAT_SHOW_IP      By default httpstat shows remote and local IP/port address.
                        Set to `false` to disable this feature. Default is `true`.
  HTTPSTAT_SHOW_SPEED   Set to `true` to show download and upload speed.
                        Default is `false`.
  HTTPSTAT_SAVE_BODY    By default httpstat stores body in a tmp file,
                        set to `false` to disable this feature. Default is `true`
  HTTPSTAT_CURL_BIN     Indicate the curl bin path to use. Default is `curl`
                        from current shell $PATH.
  HTTPSTAT_DEBUG        Set to `true` to see debugging logs. Default is `false`

From the output of the help command above, you can see that httpstat has a collection of useful environmental variables that influence its behavior.

To use them, simply export the variables with the appropriate value in the .bashrc or .zshrc file.

For instance:

export  HTTPSTAT_SHOW_IP=false
export  HTTPSTAT_SHOW_SPEED=true
export  HTTPSTAT_SAVE_BODY=false
export  HTTPSTAT_DEBUG=true

Once your are done adding them, save the file and run the command below to effect the changes:

$ source  ~/.bashrc

You can as well specify the cURL binary path to use, the default is curl from current shell $PATH environmental variable.

Below are a few examples showing how httpsat works.

$ python httpstat.py google.com
OR
$ httpstat google.com

httpstat - Showing Website Statistics

httpstat – Showing Website Statistics

In the next command:

  1. -x command flag specifies a custom request method to use while communicating with the HTTP server.
  2. --data-urlencode data posts data (a=b in this case) with URL-encoding turned on.
  3. -v enables a verbose mode.
$ python httpstat.py httpbin.org/post -X POST --data-urlencode "a=b" -v 

httpstat - Custom Post Request

httpstat – Custom Post Request

You can look through the cURL man page for more useful and advanced options or visit the httpstat Github repository: https://github.com/reorx/httpstat

In this article, we have covered a useful tool for monitoring cURL statistics is a simple and clear way. If you know of any such tools out there, do not hesitate to let us know and you can as well ask a question or make a comment about this article or httpstat via the feedback section below.

Source

iftop – A Real Time Linux Network Bandwidth Monitoring Tool

In our earlier article, we have reviewed the usage of TOP Command and it’s parameters. In this article we have came up with another excellent program called Interface TOP (IFTOP) is a real time console-based network bandwidth monitoring tool.

It will show a quick overview of network activities on an interface. Iftop shows a real time updated list of network usage bandwidth every 210 and 40 seconds on average. In this post we are going to see the installation and how to use IFTOP with examples in Linux.

Requirements:

  1. libpcap : library for capturing live network data.
  2. libncurses : a programming library that provides an API for building text-based interfaces in a terminal-independent way.

Install libpcap and libncurses

First start by installing libpcap and libncurses libraries using your Linux distribution package manager as shown.

$ sudo apt install libpcap0.8 libpcap0.8-dev libncurses5 libncurses5-dev  [On Debian/Ubuntu]
# yum  -y install libpcap libpcap-devel ncurses ncurses-devel             [On CentOS/RHEL]
# dnf  -y install libpcap libpcap-devel ncurses ncurses-devel             [On Fedora 22+]

Download and Install iftop

Iftop is available in the official software repositories of Debian/Ubuntu Linux, you can install it using apt command as shown.

$ sudo apt install iftop

On RHEL/CentOS, you need to enable the EPEL repository, and then install it as follows.

# yum install epel-release
# yum install  iftop

On Fedora distribution, iftop is also available from the default system repositories to install using the following command.

# dnf install iftop

Other Linux distributions, can download iftop source package using wget command and compile it from source as shown.

# wget http://www.ex-parrot.com/pdw/iftop/download/iftop-0.17.tar.gz
# tar -zxvf iftop-0.17.tar.gz
# cd iftop-0.17
# ./configure
# make
# make install

Basic usage of Iftop

Once installation done, go to your console and run the iftop command without any arguments to view bandwidth usage of default interface, as shown in the screen shot below.

$ sudo iftop

Sample output of iftop command which shows bandwidth of default interface as shown below.

Monitor Linux Network Bandwidth Real Time

Monitor Linux Network Bandwidth Real Time

Monitor Linux Network Interface

First run the following ifconfig command or ip command to find all attached network interfaces on your Linux system.

$ sudo ifconfig
OR
$ sudo ip addr show

Then use the -i flag to specify the interface you want to monitor. For example the command below used to monitor bandwidth on the wireless interface on the test computer.

$ sudo iftop -i wlp2s0

Monitor Linux Wifi Network Bandwidth

Monitor Linux Wifi Network Bandwidth

To disable hostname lookups, use the -n flag.

$ sudo iftop -n  eth0

To turn on port display, use the -P switch.

$ sudo iftop -P eth0

Iftop Options and Usage

While running iftop you can use the keys like SD to see more information like sourcedestination etc. Please do run man iftop if you want to explore more options and tricks. Press ‘q‘ to quit from running windows.

In this article, we’ve showed how to install and use iftop, a network interface monitoring tool in Linux. If you want to know more about iftop please visit iftop website. Kindly share it and send your comment through our comment box below.

Source

How to Install and Configure ‘Collectd’ and ‘Collectd-Web’ to Monitor Server Resources in Linux

Collectd-web is a web front-end monitoring tool based on RRDtool (Round-Robin Database Tool), which interprets and graphical outputs the data collected by the Collectd service on Linux systems.

Collectd service comes by default with a huge collection of available plug-ins into its default configuration file, some of them being, by default, already activated once you have installed the software package.

Collectd-web CGI scripts which interprets and generates the graphical html page statistics can be simply executed by the Apache CGI gateway with minimal of configurations required on Apache web server side.

However, the graphical web interface with the generated statistics can, also, be executed by the standalone web server offered by Python CGIHTTPServer script that comes pre-installed with the main Git repository.

This tutorial will cover the installation process of Collectd service and Collectd-web interface on RHEL/CentOS/Fedora and Ubuntu/Debian based systems with the minimal configurations needed to be done in order to run the services and to enable a Collectd service plug-in.

Please go through the following articles of collectd series.

Part 1Install and Configure ‘Collectd’ and ‘Collectd-Web’ to Monitor Linux Resources

Step 1: – Install Collectd Service

1. Basically, the Collectd daemon task is to gather and store data statistics on the system that it runs on. The Collectd package can be downloaded and installed from the default Debian based distribution repositories by issuing the following command:

On Ubuntu/Debian
# apt-get install collectd			[On Debian based Systems]

Install Collectd on Ubuntu

Install Collectd on Debian/Ubuntu

On RHEL/CentOS 6.x/5.x

On older RedHat based systems like CentOS/Fedora, you first need to enable epel repository under your system, then you can able to install collectd package from the epel repository.

# yum install collectd
On RHEL/CentOS 7.x

On latest version of RHEL/CentOS 7.x, you can install and enable epel repository from default yum repos as shown below.

# yum install epel-release
# yum install collectd

Install Collectd on CentOS

Install Collectd on CentOS/RHEL/Fedora

Note: For Fedora users, no need to enable any third party repositories, simple yum to get the collectd package from default yum repositories.

2. Once the package is installed on your system, run the below command in order to start the service.

# service collectd start			[On Debian based Systems]
# service collectd start                        [On RHEL/CentOS 6.x/5.x Systems]
# systemctl start collectd.service              [On RHEL/CentOS 7.x Systems]

Step 2: Install Collectd-Web and Dependencies

3. Before starting to import the Collectd-web Git repository, first you need to assure that Git software package and the following required dependencies are installed on your machine:

----------------- On Debian / Ubuntu systems -----------------
# apt-get install git
# apt-get install librrds-perl libjson-perl libhtml-parser-perl

Install Git on Ubuntu

Install Git on Debian/Ubuntu

----------------- On RedHat/CentOS/Fedora based systems -----------------
# yum install git
# yum install rrdtool rrdtool-devel rrdtool-perl perl-HTML-Parser perl-JSON

Install Git on CentOS

Install Git and Dependencies

Step 3: Import Collectd-Web Git Repository and Modify Standalone Python Server

4. On the next step choose and change the directory to a system path from the Linux tree hierarchy where you want to import the Git project (you can use /usr/local/ path), then run the following command to clone Collectd-web git repository:

# cd /usr/local/
# git clone https://github.com/httpdss/collectd-web.git

Git Clone Collectd-Web

Git Clone Collectd-Web

5. Once the Git repository is imported into your system, go ahead and enter the collectd-web directory and list its contents in order to identify the Python server script (runserver.py), which will be modified on the next step. Also, add execution permissions to the following CGI script: graphdefs.cgi.

# cd collectd-web/
# ls
# chmod +x cgi-bin/graphdefs.cgi

Set Execute Permission

Set Execute Permission

6. Collectd-web standalone Python server script is configured by default to run and bind only on loopback address (127.0.0.1).

In order to access Collectd-web interface from a remote browser, you need to edit the runserver.py script and change the 127.0.1.1 IP Address to 0.0.0.0, in order to bind on all network interfaces IP Addresses.

If you want to bind only on a specific interface, then use that interface IP Address (not advised to use this option in case your network interface Address is dynamically allocated by a DHCP server). Use the below screenshot as an excerpt on how the final runserver.py script should look like:

# nano runserver.py

Configure Collect-web

Configure Collect-web

If you want to use another network port than 8888, modify the PORT variable value.

Step 4: Run Python CGI Standalone Server and Browse Collectd-web Interface

7. After you have modified the standalone Python server script IP Address binding, go ahead and start the server in background by issuing the following command:

# ./runserver.py &

Optional, as an alternate method you can call the Python interpreter to start the server:

# python runserver.py &

Start Collect-Web Server

Start Collect-Web Server

8. To visit Collectd-web interface and display statistics about your host, open a browser and point the URL at your server IP Address and port 8888 using HTTP protocol.

By default you will see a number of graphics about CPU, disk usage, network traffic, RAM, processes and other system resources by clicking on the hostname displayed on Hosts form.

http://192.168.1.211:8888

Access Collect-Web Panel

Access Collect-Web Panel

Linux Disk Monitoring

Linux Disk Monitoring

9. To stop the standalone Python server issue the below command or you may cancel or stop the script by hitting Ctrl+c key:

# killall python

Step 5: Create a Custom Bash Script to Manage the Standalone Python Server

10. To manage the standalone PyhtonCGIServer script more easily (startstop and view status), create the following collectd-server Bash script at a system executable path with the following configurations:

# nano /usr/local/bin/collectd-server

Add the following excerpt to collectd-server file.

#!/bin/bash

PORT="8888"
  case $1 in
            start)
	cd /usr/local/collectd-web/
	python runserver.py 2> /tmp/collectd.log &
    sleep 1
    stat=`netstat -tlpn 2>/dev/null | grep $PORT | grep "python"| cut -d":" -f2 | cut -d" " -f1`
            if [[ $PORT -eq $stat ]]; then
    sock=`netstat -tlpn 2>/dev/null | grep $PORT | grep "python"`
    echo -e "Server is  still running:\n$sock"
            else
    echo -e "Server has stopped"
            fi
                    ;;
            stop)
    pid=`ps -x | grep "python runserver.py" | grep -v "color"`
            kill -9 $pid 2>/dev/null
    stat=`netstat -tlpn 2>/dev/null | grep $PORT | grep "python"| cut -d":" -f2 | cut -d" " -f1`
            if [[ $PORT -eq $stat ]]; then
    sock=`netstat -tlpn 2>/dev/null | grep $PORT | grep "python"`
    echo -e "Server is  still running:\n$sock"
            else
    echo -e "Server has stopped"
            fi
                    ;;
            status)
    stat=`netstat -tlpn 2>/dev/null |grep $PORT| grep "python" | cut -d":" -f2 | cut -d" " -f1`
            if [[ $PORT -eq $stat ]]; then
    sock=`netstat -tlpn 2>/dev/null | grep $PORT | grep "python"`
    echo -e "Server is running:\n$sock"
            else
    echo -e "Server is stopped"
            fi
                    ;;
            *)
    echo "Use $0 start|stop|status"
                    ;;
    esac

In case you have changed PORT variable number from runserver.py script, make sure you make the port variable changes on this bash file accordingly.

11. Once you have created the collectd-server script, add executing permissions in order to be able to run it. The only thing remaining now is to manage the Collectd-web server in a similar way as you do with a system service by issuing the following commands.

# chmod +x /usr/local/bin/collectd-server
# collectd-server start 
# collectd-server status
# collectd-server stop

Collectd Server Script

Collectd Server Script

Step 6: Enable a Collectd Daemon Plug-in

12. In order to activate a plug-in on Collectd service, you must go to its main configuration file, which is located at /etc/collectd/collectd.conf file, open this file for editing and uncomment, the first time (remove the # sign in front) the plug-in name you want to activate.

Once the LoadPlugin statement with the name of the plug-in has been uncommented you must deeply search through the file and locate the same plugin name which holds the configurations required to run.

As an example, here’s how you active Collectd Apache plugin. First open Collectd main configuration file for editing:

# nano /etc/collectd/collectd.conf

A. Use Ctrl+w to enable nano editor search and type apache on below terminal the search filed. Once LoadPlugin apache statement has been found, remove the comment special sign # to uncomment it, as illustrated in the below screenshot.

Enable Collectd Apache Plugin

Enable Collectd Apache Plugin

B. Next, type Ctrl+w to search again, apache should already appear on search filed and press Enter key to find the plug-in configurations.

Once apache plug-in configurations are located (they look similar to Apache web server statements) uncomment the following lines, so that the final configuration should resemble to this:

<Plugin apache>
        <Instance "example.lan">
                URL "http://localhost/server-status?auto"
#               User "www-user"
#               Password "secret"
#               VerifyPeer false
#               VerifyHost false
#               CACert "/etc/ssl/ca.crt"
#               Server "apache"
        </Instance>
#
#       <Instance "bar">
#               URL "http://some.domain.tld/status?auto"
#               Host "some.domain.tld"
#               Server "lighttpd"
#       </Instance>
</Plugin>

Enable Apache Configuration for Collectd

Enable Apache Configuration for Collectd

Note: Replace <Instance "example.lan"> statement string according to your server hostname.

C.
 After you finish editing the file, save it (Ctrl+o) and close it (Ctrl+x), then restart Collectd daemon to apply changes. Clear your browser cache and reload the page to view the statistics collected by Collectd daemon so far for Apache Web Server.

# /usr/local/bin/collectd-server start

Apache Monitoring

Apache Monitoring

To enable other plug-ins please visit Collectd Wiki page.

Step 7: Enable Collectd Daemon and Collectd-web Server System-Wide

13. In order to automatically start Collectd-web server from the Bash script at boot time, open /etc/rc.localfile for editing and add the following line before the exit 0 statement:

/usr/local/bin/collectd-server start

Enable Collectd Systemwide

Enable Collectd Systemwide

If you’re not using the collectd-server Bash script which manages the Python server script, replace the above line on rc.conf with the following line:

# cd /usr/local/collectd-web/ && python runserver.py 2> /tmp/collectd.log &

Then, enable both system services by issuing the following commands:

------------------ On Debian / Ubuntu ------------------
# update-rc.d collectd enable
# update-rc.d rc.local enable

Optionally, an alternate method to enable this services at boot time would be with the help on sysv-rc-confpackage:

------------------ On Debian / Ubuntu ------------------
# sysv-rc-conf collectd on
# sysv-rc-conf rc.local on
------------------ On RHEL/CentOS 6..x/5.x and Fedora 12-19 ------------------
# chkconfig collectd on
# chkconfig --level 5 collectd on
------------------ On RHEL/CentOS 7.x and Fedora 20 onwards ------------------
# systemctl enable collectd

That’s all! Collectd daemon and Collectd-web server prove to be excellent monitoring tools for Linux servers, with minimal impact concerning system resources, which can generate and display some interesting graphical statistics about machines workload, the only drawback so far being the fact the statistics are not displaying in real time without refreshing the browser.

Source

SARG – Squid Analysis Report Generator and Internet Bandwidth Monitoring Tool

SARG is an open source tool that allows you to analyse the squid log files and generates beautiful reports in HTML format with informations about users, IP addresses, top accessed sites, total bandwidth usage, elapsed time, downloads, access denied websites, daily reports, weekly reports and monthly reports.

The SARG is very handy tool to view how much internet bandwidth is utilized by individual machines on the network and can watch on which websites the network’s users are accessing.

Install Sarg Squid Log Analyzer

Install Sarg Squid Log Analyzer in Linux

In this article I will guide you on how to install and configure SARG – Squid Analysis Report Generator on RHEL/CentOS/Fedora and Debian/Ubuntu/Linux Mint systems.

Installing Sarg – Squid Log Analyzer in Linux

I assume that you already installed, configured and tested Squid server as a transparent proxy and DNS for the name resolution in caching mode. If not, please install and configure them first before moving further installation of Sarg.

Important: Please remember without the Squid and DNS setup, no use of installing sarg on the system it will won’t work at all. So, it’s a request to install them first before proceeding further to Sarg installation.

Follow these guides to install DNS and Squid in your Linux systems:

Install Cache-Only DNS Server
  1. Install Cache Only DSN Server in RHEL/CentOS 7
  2. Install Cache Only DSN Server in RHEL/CentOS 6
  3. Install Cache Only DSN Server in Ubuntu and Debian
Install Squid as Transparent Proxy
  1. Setting Up Squid Transparent Proxy in Ubuntu and Debian
  2. Install Squid Cache Server on RHEL and CentOS

Step 1: Installing Sarg from Source

The ‘sarg‘ package by default not included in RedHat based distributions, so we need to manually compile and install it from source tarball. For this, we need some additional pre-requisites packages to be installed on the system before compiling it from source.

On RedHat/CentOS/Fedora
# yum install –y gcc gd gd-devel make perl-GD wget httpd

Once you’ve installed all the required packages, download the latest sarg source tarball or you may use the following wget command to download and install it as shown below.

# wget http://liquidtelecom.dl.sourceforge.net/project/sarg/sarg/sarg-2.3.10/sarg-2.3.10.tar.gz
# tar -xvzf sarg-2.3.10.tar.gz
# cd sarg-2.3.10
# ./configure
# make
# make install
On Debian/Ubuntu/Linux Mint

On Debian based distributions, sarg package can be easily install from the default repositories using apt-getpackage manager.

$ sudo apt-get install sarg

Step 2: Configuring Sarg

Now it’s time to edit some parameters in SARG main configuration file. The file contains lots of options to edit, but we will only edit required parameters like:

  1. Access logs path
  2. Output directory
  3. Date Format
  4. Overwrite report for the same date.

Open sarg.conf file with your choice of editor and make changes as shown below.

# vi /usr/local/etc/sarg.conf        [On RedHat based systems]
$ sudo nano /etc/sarg/sarg.conf        [On Debian based systems]

Now Uncomment and add the original path to your squid access log file.

# sarg.conf
#
# TAG:  access_log file
#       Where is the access.log file
#       sarg -l file
#
access_log /var/log/squid/access.log

Next, add the correct Output directory path to save the generate squid reports in that directory. Please note, under Debian based distributions the Apache web root directory is ‘/var/www‘. So, please be careful while adding correct web root paths under your Linux distributions.

# TAG:  output_dir
#       The reports will be saved in that directory
#       sarg -o dir
#
output_dir /var/www/html/squid-reports

Set the correct date format for reports. For example, ‘date_format e‘ will display reports in ‘dd/mm/yy‘ format.

# TAG:  date_format
#       Date format in reports: e (European=dd/mm/yy), u (American=mm/dd/yy), w (Weekly=yy.ww)
#
date_format e

Next, uncomment and set Overwrite report to ‘Yes’.

# TAG: overwrite_report yes|no
#      yes - if report date already exist then will be overwritten.
#       no - if report date already exist then will be renamed to filename.n, filename.n+1
#
overwrite_report yes

That’s it! Save and close the file.

Step 3: Generating Sarg Report

Once, you’ve done with the configuration part, it’s time to generate the squid log report using the following command.

# sarg -x        [On RedHat based systems]
# sudo sarg -x        [On Debian based systems]
Sample Output
[root@localhost squid]# sarg -x

SARG: Init
SARG: Loading configuration from /usr/local/etc/sarg.conf
SARG: Deleting temporary directory "/tmp/sarg"
SARG: Parameters:
SARG:           Hostname or IP address (-a) =
SARG:                    Useragent log (-b) =
SARG:                     Exclude file (-c) =
SARG:                  Date from-until (-d) =
SARG:    Email address to send reports (-e) =
SARG:                      Config file (-f) = /usr/local/etc/sarg.conf
SARG:                      Date format (-g) = USA (mm/dd/yyyy)
SARG:                        IP report (-i) = No
SARG:             Keep temporary files (-k) = No
SARG:                        Input log (-l) = /var/log/squid/access.log
SARG:               Resolve IP Address (-n) = No
SARG:                       Output dir (-o) = /var/www/html/squid-reports/
SARG: Use Ip Address instead of userid (-p) = No
SARG:                    Accessed site (-s) =
SARG:                             Time (-t) =
SARG:                             User (-u) =
SARG:                    Temporary dir (-w) = /tmp/sarg
SARG:                   Debug messages (-x) = Yes
SARG:                 Process messages (-z) = No
SARG:  Previous reports to keep (--lastlog) = 0
SARG:
SARG: sarg version: 2.3.7 May-30-2013
SARG: Reading access log file: /var/log/squid/access.log
SARG: Records in file: 355859, reading: 100.00%
SARG:    Records read: 355859, written: 355859, excluded: 0
SARG: Squid log format
SARG: Period: 2014 Jan 21
SARG: Sorting log /tmp/sarg/172_16_16_55.user_unsort
......

Note: The ‘sarg -x’ command will read the ‘sarg.conf‘ configuration file and takes the squid ‘access.log‘ path and generates a report in html format.

Step 4: Assessing Sarg Report

The generated reports placed under ‘/var/www/html/squid-reports/‘ or ‘/var/www/squid-reports/‘ which can be accessed from the web browser using the address.

http://localhost/squid-reports
OR
http://ip-address/squid-reports
Sarg Main Window

Squid Log Analyzer

Sarg Main Window

Specific Date

Date Wise Report

Date Wise Report

User Report

User Bandwidth Report

User Bandwidth Report

Top Accessed Sites

Squid Top Accessed Sites

Top Accessed Sites

Top Sites and Users

Squid Top Accessed Sites and Users

Top Accessed Sites and Users

Top Downloads

Squid Top Downloads

Top Downloads

Denied Access

Squid Denied Access

Denied Access Sites

Authentication Failures

Squid Authentication Failures

Proxy Authentication Failures

Step 5: Automatic Generating Sarg Report

To automate the process of generating sarg report in given span of time via cron jobs. For example, let’s assume you want to generate reports on hourly basis automatically, to do this, you need to configure a Cron job.

# crontab -e

Next, add the following line at the bottom of the file. Save and close it.

* */1 * * * /usr/local/bin/sarg -x

The above Cron rule will generate SARG report every 1 hour.

Reference Links

Sarg Homepage

That’s it with SARG! I will be coming up with few more interesting articles on Linux, till then stay tuned to TecMint.com and don’t forget to add your valuable comments.

Source

CBM – Shows Network Bandwidth in Ubuntu

CBM (Color Bandwidth Meter) is a simple tool that shows the current network traffic on all connected devices in colors in Ubuntu Linux. It is used to monitor network bandwidth. It shows the network interface, bytes received, bytes transmitted and total bytes.

Read Alsoiftop – A Real Time Linux Network Bandwidth Monitoring Tool

In this article, we will show you how to install and use cbm network bandwidth monitoring tool in Ubuntu and its derivative such as Linux Mint.

How to Install CBM Network Monitoring Tool in Ubuntu

This cbm network bandwidth monitoring tool is available to install from the default Ubuntu repositories using the APT package manager as shown.

$ sudo apt install cbm

Once you have installed cbm, you can start the program using the following command.

$ cbm 

Ubuntu Network Bandwidth Monitoring

Ubuntu Network Bandwidth Monitoring

While cbm is running, you can control its behavior with the following keys:

  • Up/Down – arrows keys to select an interface to show details about.
  • b – Switch between bits per second and bytes per second.
  • + – increase the update delay by 100ms.
  • -- – decrease the update delay by 100ms.
  • q – exit from the program.

If you are having any network connection issues, check out MTR – a network diagnostic tool for Linux. It combines the functionality of commonly used traceroute and ping programs into a single diagnostics tool.

However, to monitor multiple hosts on a network, you need robust network monitoring tools such as the ones listed below:

    1. How to Install Nagios 4 in Ubuntu
    2. LibreNMS – A Fully Featured Network Monitoring Tool for Linux
    3. Monitorix – A Lightweight System and Network Monitoring Tool for Linux
    4. Install Cacti (Network Monitoring) on RHEL/CentOS 7.x/6.x/5.x and Fedora 24-12
    5. Install Munin (Network Monitoring) in RHEL, CentOS and Fedora

That’s it. In this article, we have explained how to install and use cbm network bandwidth monitoring tool in Ubuntu and its derivative such as Linux Mint. Share your thoughts about cbm via the command form below.

Source

Cpustat – Monitors CPU Utilization by Running Processes in Linux

Cpustat is a powerful system performance measure program for Linux, written using Go programming language. It attempts to reveal CPU utilization and saturation in an effective way, using The Utilization Saturation and Errors (USE) Method (a methodology for analyzing the performance of any system).

It extracts higher frequency samples of every process being executed on the system and then summarizes these samples at a lower frequency. For instance, it can measure every process every 200ms and summarize these samples every 5 seconds, including min/average/max values for certain metrics.

Suggested Read: 20 Command Line Tools to Monitor Linux Performance

Cpustat outputs data in two possible ways: a pure text list of the summary interval and a colorful scrolling dashboard of each sample.

How to Install Cpustat in Linux

You must have Go (GoLang) installed on your Linux system in order to use cpustat, click on the link below to follow the GoLang installation steps that is if you do not have it installed:

  1. Install GoLang (Go Programming Language) in Linux

Smem – Reports Memory Consumption Per-Process and Per-User Basis in Linux

Memory management in terms of monitoring memory usage is one important thing to do on your Linux system, there are many tools available for monitoring your memory usage that you can find on different Linux distributions. But they work in different ways, in this how to guide, we shall take a look at how to install and use one such tool called smem.

Don’t Miss: 20 Command Line Tools to Monitor Linux Performance

Smem is a command-line memory reporting tool thats gives a user diverse reports on memory usage on a Linux system. There is one unique thing about smem, unlike other traditional memory reporting tools, it reports PSS(Proportional Set Size), a more meaningful representation of memory usage by applications and libraries in a virtual memory setup.

Smem - Linux Memory Reporting Tool

Smem – Linux Memory Reporting Tool

Existing traditional tools focus mainly on reading RSS (Resident Set Size) which is a standard measure to monitor memory usage in a physical memory scheme, but tends to overestimate memory usage by applications.

PSS on the other hand, gives a reasonable measure by determining the “fair-share” of memory used by applications and libraries in a virtual memory scheme.

You can read this guide (about memory RSS and PSS) to understand memory consumption in a Linux system, but let us proceed to looking at some of the features of smem.

Features of Smem Tool

  1. System overview listing
  2. Listings and also filtering by process, mappings or user
  3. Using data from /proc filesystem
  4. Configurable listing columns from several data sources
  5. Configurable output units and percentages
  6. Easy to configure headers and totals in listings
  7. Using data snapshots from directory mirrors or compressed tar files
  8. Built-in chart generation mechanism
  9. Lightweight capture tool used in embedded systems

How to Install Smem – Memory Reporting Tool in Linux

Before you proceed with installation of smem, your system must meet the following requirements:

  1. modern kernel (> 2.6.27 or so)
  2. a recent version of Python (2.4 or so)
  3. optional matplotlib library for generation of charts

Most of the today’s Linux distributions comes with latest Kernel version with Python 2 or 3 support, so the only requirement is to install matplotlib library which is used to generate nice charts.

On RHEL, CentOS and Fedora

First enable EPEL (Extra Packages for Enterprise Linux) repository and then install as follows:

# yum install smem python-matplotlib python-tk

On Debian and Ubuntu

$ sudo apt-get install smem

On Linux Mint

$ sudo apt-get install smem python-matplotlib python-tk

on Arch Linux

Use this AUR repository.

How to Use Smem – Memory Reporting Tool in Linux

To view a report of memory usage across the whole system, by all system users, run the following command:

$ sudo smem 
Monitor Memory Usage of Linux System
 PID User     Command                         Swap      USS      PSS      RSS 
 6367 tecmint  cat                                0      100      145     1784 
 6368 tecmint  cat                                0      100      147     1676 
 2864 tecmint  /usr/bin/ck-launch-session         0      144      165     1780 
 7656 tecmint  gnome-pty-helper                   0      156      178     1832 
 5758 tecmint  gnome-pty-helper                   0      156      179     1916 
 1441 root     /sbin/getty -8 38400 tty2          0      152      184     2052 
 1434 root     /sbin/getty -8 38400 tty5          0      156      187     2060 
 1444 root     /sbin/getty -8 38400 tty3          0      156      187     2060 
 1432 root     /sbin/getty -8 38400 tty4          0      156      188     2124 
 1452 root     /sbin/getty -8 38400 tty6          0      164      196     2064 
 2619 root     /sbin/getty -8 38400 tty1          0      164      196     2136 
 3544 tecmint  sh -c /usr/lib/linuxmint/mi        0      212      224     1540 
 1504 root     acpid -c /etc/acpi/events -        0      220      236     1604 
 3311 tecmint  syndaemon -i 0.5 -K -R             0      252      292     2556 
 3143 rtkit    /usr/lib/rtkit/rtkit-daemon        0      300      326     2548 
 1588 root     cron                               0      292      333     2344 
 1589 avahi    avahi-daemon: chroot helpe         0      124      334     1632 
 1523 root     /usr/sbin/irqbalance               0      316      343     2096 
  585 root     upstart-socket-bridge --dae        0      328      351     1820 
 3033 tecmint  /usr/bin/dbus-launch --exit        0      328      360     2160 
 1346 root     upstart-file-bridge --daemo        0      348      371     1776 
 2607 root     /usr/bin/xdm                       0      188      378     2368 
 1635 kernoops /usr/sbin/kerneloops               0      352      386     2684 
  344 root     upstart-udev-bridge --daemo        0      400      427     2132 
 2960 tecmint  /usr/bin/ssh-agent /usr/bin        0      480      485      992 
 3468 tecmint  /bin/dbus-daemon --config-f        0      344      515     3284 
 1559 avahi    avahi-daemon: running [tecm        0      284      517     3108 
 7289 postfix  pickup -l -t unix -u -c            0      288      534     2808 
 2135 root     /usr/lib/postfix/master            0      352      576     2872 
 2436 postfix  qmgr -l -t unix -u                 0      360      606     2884 
 1521 root     /lib/systemd/systemd-logind        0      600      650     3276 
 2222 nobody   /usr/sbin/dnsmasq --no-reso        0      604      669     3288 
....

When a normal user runs smem, it displays memory usage by process that the user has started, the processes are arranged in order of increasing PSS.

Take a look at the output below on my system for memory usage by processes started by user aaronkilik:

$ smem
Monitor User Memory Usage in Linux
 PID User     Command                         Swap      USS      PSS      RSS 
 6367 tecmint  cat                                0      100      145     1784 
 6368 tecmint  cat                                0      100      147     1676 
 2864 tecmint  /usr/bin/ck-launch-session         0      144      166     1780 
 3544 tecmint  sh -c /usr/lib/linuxmint/mi        0      212      224     1540 
 3311 tecmint  syndaemon -i 0.5 -K -R             0      252      292     2556 
 3033 tecmint  /usr/bin/dbus-launch --exit        0      328      360     2160 
 3468 tecmint  /bin/dbus-daemon --config-f        0      344      515     3284 
 3122 tecmint  /usr/lib/gvfs/gvfsd                0      656      801     5552 
 3471 tecmint  /usr/lib/at-spi2-core/at-sp        0      708      864     5992 
 3396 tecmint  /usr/lib/gvfs/gvfs-mtp-volu        0      804      914     6204 
 3208 tecmint  /usr/lib/x86_64-linux-gnu/i        0      892     1012     6188 
 3380 tecmint  /usr/lib/gvfs/gvfs-afc-volu        0      820     1024     6396 
 3034 tecmint  //bin/dbus-daemon --fork --        0      920     1081     3040 
 3365 tecmint  /usr/lib/gvfs/gvfs-gphoto2-        0      972     1099     6052 
 3228 tecmint  /usr/lib/gvfs/gvfsd-trash -        0      980     1153     6648 
 3107 tecmint  /usr/lib/dconf/dconf-servic        0     1212     1283     5376 
 6399 tecmint  /opt/google/chrome/chrome -        0      144     1409    10732 
 3478 tecmint  /usr/lib/x86_64-linux-gnu/g        0     1724     1820     6320 
 7365 tecmint  /usr/lib/gvfs/gvfsd-http --        0     1352     1884     8704 
 6937 tecmint  /opt/libreoffice5.0/program        0     1140     2328     5040 
 3194 tecmint  /usr/lib/x86_64-linux-gnu/p        0     1956     2405    14228 
 6373 tecmint  /opt/google/chrome/nacl_hel        0     2324     2541     8908 
 3313 tecmint  /usr/lib/gvfs/gvfs-udisks2-        0     2460     2754     8736 
 3464 tecmint  /usr/lib/at-spi2-core/at-sp        0     2684     2823     7920 
 5771 tecmint  ssh -p 4521 tecmnt765@212.7        0     2544     2864     6540 
 5759 tecmint  /bin/bash                          0     2416     2923     5640 
 3541 tecmint  /usr/bin/python /usr/bin/mi        0     2584     3008     7248 
 7657 tecmint  bash                               0     2516     3055     6028 
 3127 tecmint  /usr/lib/gvfs/gvfsd-fuse /r        0     3024     3126     8032 
 3205 tecmint  mate-screensaver                   0     2520     3331    18072 
 3171 tecmint  /usr/lib/mate-panel/notific        0     2860     3495    17140 
 3030 tecmint  x-session-manager                  0     4400     4879    17500 
 3197 tecmint  mate-volume-control-applet         0     3860     5226    23736 
...

There are many options to invoke while using smem, for example, to view system wide memory consumption, run the following command:

$ sudo smem -w
Monitor System Wide Memory User Consumption
Area                           Used      Cache   Noncache 
firmware/hardware                 0          0          0 
kernel image                      0          0          0 
kernel dynamic memory       1425320    1291412     133908 
userspace memory            2215368     451608    1763760 
free memory                 4424936    4424936          0 

To view memory usage on a per-user basis, run the command below:

$ sudo smem -u
Monitor Memory Consumption Per-User Basis in Linux
User     Count     Swap      USS      PSS      RSS 
rtkit        1        0      300      326     2548 
kernoops     1        0      352      385     2684 
avahi        2        0      408      851     4740 
postfix      2        0      648     1140     5692 
messagebus     1        0     1012     1173     3320 
syslog       1        0     1396     1419     3232 
www-data     2        0     5100     6572    13580 
mpd          1        0     7416     8302    12896 
nobody       2        0     4024    11305    24728 
root        39        0   323876   353418   496520 
tecmint     64        0  1652888  1815699  2763112 

You can also report memory usage by mappings as follows:

$ sudo smem -m
Monitor Memory Usage by Mappings in Linux
Map                                       PIDs   AVGPSS      PSS 
/dev/fb0                                     1        0        0 
/home/tecmint/.cache/fontconfig/7ef2298f    18        0        0 
/home/tecmint/.cache/fontconfig/c57959a1    18        0        0 
/home/tecmint/.local/share/mime/mime.cac    15        0        0 
/opt/google/chrome/chrome_material_100_p     9        0        0 
/opt/google/chrome/chrome_material_200_p     9        0        0 
/usr/lib/x86_64-linux-gnu/gconv/gconv-mo    41        0        0 
/usr/share/icons/Mint-X-Teal/icon-theme.    15        0        0 
/var/cache/fontconfig/0c9eb80ebd1c36541e    20        0        0 
/var/cache/fontconfig/0d8c3b2ac0904cb8a5    20        0        0 
/var/cache/fontconfig/1ac9eb803944fde146    20        0        0 
/var/cache/fontconfig/3830d5c3ddfd5cd38a    20        0        0 
/var/cache/fontconfig/385c0604a188198f04    20        0        0 
/var/cache/fontconfig/4794a0821666d79190    20        0        0 
/var/cache/fontconfig/56cf4f4769d0f4abc8    20        0        0 
/var/cache/fontconfig/767a8244fc0220cfb5    20        0        0 
/var/cache/fontconfig/8801497958630a81b7    20        0        0 
/var/cache/fontconfig/99e8ed0e538f840c56    20        0        0 
/var/cache/fontconfig/b9d506c9ac06c20b43    20        0        0 
/var/cache/fontconfig/c05880de57d1f5e948    20        0        0 
/var/cache/fontconfig/dc05db6664285cc2f1    20        0        0 
/var/cache/fontconfig/e13b20fdb08344e0e6    20        0        0 
/var/cache/fontconfig/e7071f4a29fa870f43    20        0        0 
....

There are also options for filtering smem output and we shall look at two examples here.

To filter output by username, invoke the -u or --userfilter="regex" option as below:

$ sudo smem -u
Report Memory Usage by User
User     Count     Swap      USS      PSS      RSS 
rtkit        1        0      300      326     2548 
kernoops     1        0      352      385     2684 
avahi        2        0      408      851     4740 
postfix      2        0      648     1140     5692 
messagebus     1        0     1012     1173     3320 
syslog       1        0     1400     1423     3236 
www-data     2        0     5100     6572    13580 
mpd          1        0     7416     8302    12896 
nobody       2        0     4024    11305    24728 
root        39        0   323804   353374   496552 
tecmint     64        0  1708900  1871766  2819212 

To filter output by process name, invoke the -P or --processfilter="regex" option as follows:

$ sudo smem --processfilter="firefox"
Report Memory Usage by Process Name
PID User     Command                         Swap      USS      PSS      RSS 
 9212 root     sudo smem --processfilter=f        0     1172     1434     4856 
 9213 root     /usr/bin/python /usr/bin/sm        0     7368     7793    11984 
 4424 tecmint  /usr/lib/firefox/firefox           0   931732   937590   961504 

Output formatting can be very important, and there are options to help you format memory reports and we shall take a look at few examples below.

To show desired columns in the report, use -c or --columns option as follows:

$ sudo smem -c "name user pss rss"
Report Memory Usage by Columns
Name                     User          PSS      RSS 
cat                      tecmint       145     1784 
cat                      tecmint       147     1676 
ck-launch-sessi          tecmint       165     1780 
gnome-pty-helpe          tecmint       178     1832 
gnome-pty-helpe          tecmint       179     1916 
getty                    root          184     2052 
getty                    root          187     2060 
getty                    root          188     2124 
getty                    root          196     2064 
getty                    root          196     2136 
sh                       tecmint       224     1540 
acpid                    root          236     1604 
syndaemon                tecmint       296     2560 
rtkit-daemon             rtkit         326     2548 
cron                     root          333     2344 
avahi-daemon             avahi         334     1632 
irqbalance               root          343     2096 
upstart-socket-          root          351     1820 
dbus-launch              tecmint       360     2160 
upstart-file-br          root          371     1776 
xdm                      root          378     2368 
kerneloops               kernoops      386     2684 
upstart-udev-br          root          427     2132 
ssh-agent                tecmint       485      992 
...

You can invoke the -p option to report memory usage in percentages, as in the command below:

$ sudo smem -p
Report Memory Usage by Percentages
 PID User     Command                         Swap      USS      PSS      RSS 
 6367 tecmint  cat                            0.00%    0.00%    0.00%    0.02% 
 6368 tecmint  cat                            0.00%    0.00%    0.00%    0.02% 
 9307 tecmint  sh -c { sudo /usr/lib/linux    0.00%    0.00%    0.00%    0.02% 
 2864 tecmint  /usr/bin/ck-launch-session     0.00%    0.00%    0.00%    0.02% 
 3544 tecmint  sh -c /usr/lib/linuxmint/mi    0.00%    0.00%    0.00%    0.02% 
 5758 tecmint  gnome-pty-helper               0.00%    0.00%    0.00%    0.02% 
 7656 tecmint  gnome-pty-helper               0.00%    0.00%    0.00%    0.02% 
 1441 root     /sbin/getty -8 38400 tty2      0.00%    0.00%    0.00%    0.03% 
 1434 root     /sbin/getty -8 38400 tty5      0.00%    0.00%    0.00%    0.03% 
 1444 root     /sbin/getty -8 38400 tty3      0.00%    0.00%    0.00%    0.03% 
 1432 root     /sbin/getty -8 38400 tty4      0.00%    0.00%    0.00%    0.03% 
 1452 root     /sbin/getty -8 38400 tty6      0.00%    0.00%    0.00%    0.03% 
 2619 root     /sbin/getty -8 38400 tty1      0.00%    0.00%    0.00%    0.03% 
 1504 root     acpid -c /etc/acpi/events -    0.00%    0.00%    0.00%    0.02% 
 3311 tecmint  syndaemon -i 0.5 -K -R         0.00%    0.00%    0.00%    0.03% 
 3143 rtkit    /usr/lib/rtkit/rtkit-daemon    0.00%    0.00%    0.00%    0.03% 
 1588 root     cron                           0.00%    0.00%    0.00%    0.03% 
 1589 avahi    avahi-daemon: chroot helpe     0.00%    0.00%    0.00%    0.02% 
 1523 root     /usr/sbin/irqbalance           0.00%    0.00%    0.00%    0.03% 
  585 root     upstart-socket-bridge --dae    0.00%    0.00%    0.00%    0.02% 
 3033 tecmint  /usr/bin/dbus-launch --exit    0.00%    0.00%    0.00%    0.03% 
....

The command below will show totals at the end of each column of the output:

$ sudo smem -t
Report Total Memory Usage Count
PID User     Command                         Swap      USS      PSS      RSS 
 6367 tecmint  cat                                0      100      139     1784 
 6368 tecmint  cat                                0      100      141     1676 
 9307 tecmint  sh -c { sudo /usr/lib/linux        0       96      158     1508 
 2864 tecmint  /usr/bin/ck-launch-session         0      144      163     1780 
 3544 tecmint  sh -c /usr/lib/linuxmint/mi        0      108      170     1540 
 5758 tecmint  gnome-pty-helper                   0      156      176     1916 
 7656 tecmint  gnome-pty-helper                   0      156      176     1832 
 1441 root     /sbin/getty -8 38400 tty2          0      152      181     2052 
 1434 root     /sbin/getty -8 38400 tty5          0      156      184     2060 
 1444 root     /sbin/getty -8 38400 tty3          0      156      184     2060 
 1432 root     /sbin/getty -8 38400 tty4          0      156      185     2124 
 1452 root     /sbin/getty -8 38400 tty6          0      164      193     2064 
 2619 root     /sbin/getty -8 38400 tty1          0      164      193     2136 
 1504 root     acpid -c /etc/acpi/events -        0      220      232     1604 
 3311 tecmint  syndaemon -i 0.5 -K -R             0      260      298     2564 
 3143 rtkit    /usr/lib/rtkit/rtkit-daemon        0      300      324     2548 
 1588 root     cron                               0      292      326     2344 
 1589 avahi    avahi-daemon: chroot helpe         0      124      332     1632 
 1523 root     /usr/sbin/irqbalance               0      316      340     2096 
  585 root     upstart-socket-bridge --dae        0      328      349     1820 
 3033 tecmint  /usr/bin/dbus-launch --exit        0      328      359     2160 
 1346 root     upstart-file-bridge --daemo        0      348      370     1776 
 2607 root     /usr/bin/xdm                       0      188      375     2368 
 1635 kernoops /usr/sbin/kerneloops               0      352      384     2684 
  344 root     upstart-udev-bridge --daemo        0      400      426     2132 
.....
-------------------------------------------------------------------------------
  134 11                                          0  2171428  2376266  3587972 

Further more, there are options for graphical reports that you can also use and we shall dive into them in this sub section.

You can produce a bar graph of processes and their PSS and RSS values, in the example below, we produce a bar graph of processes owned by the root user.

The vertical plane shows the PSS and RSS measure of processes and the horizontal plane represents each root user process:

$ sudo smem --userfilter="root" --bar pid -c"pss rss"

Linux Memory Usage in PSS and RSS Values

Linux Memory Usage in PSS and RSS Values

You can also produce a pie chart showing processes and their memory consumption based on PSS or RSSvalues. The command below outputs a pie chart for processes owned by root user measuring values.

The --pie name means label by name and -s option helps to sort by PSS value.

$ sudo smem --userfilter="root" --pie name -s pss

Linux Memory Consumption by Processes

Linux Memory Consumption by Processes

There are many other known fields apart from PSS and RSS used for labeling charts:

To get help, simply type, smem -h or visit the manual entry page.

We shall stop here with smem, but to understand it better, use it with many other options that you can find in the man page. As usual you can use the comment section below to express any thoughts or concerns.

Reference Linkshttps://www.selenic.com/smem/

Source

Observium: A Complete Network Management and Monitoring System for RHEL/CentOS

Observium is a PHP/MySQL driven Network Observation and Monitoring application, that supports a wide range of operating systems/hardware platforms including, Linux, Windows, FreeBSD, Cisco, HP, Dell, NetApp and many more. It seeks to present a robust and simple web interface to monitor health and performance of your network.

Install Observium in CentOS

Install Observium in CentOS/RHEL

Observium gathers data from devices with the help of SNMP and display those data in graphical pattern via a web interface. It makes hefty use of the RRDtool package. It has a number of thin core design goals, which includes collecting as much historical information about devices, being totally auto-discovered with slight or no manual interruption, and having a very simple yet powerful interface.

Observium Demo

Please have a quick online demo of the Observium deployed by the developer at the following location.

  1. http://demo.observium.org/

This article will guide you on how to install Observium on RHELCentOS and Scientific Linux, the supported version is EL (Enterprise Linux) 6.x. Currently, Observium unsupported for EL release 4 and 5 respectively. So, please don’t use following instructions on these releases.

RPMForge and EPEL is a repository that provides many add-on rpm software packages for RHEL, CentOS and Scientific Linux. Let’s install and enable these two community based repositories using the following serious of commands.

On i386 Systems
# yum install wget
# wget http://pkgs.repoforge.org/rpmforge-release/rpmforge-release-0.5.3-1.el5.rf.i386.rpm
# wget http://download.fedoraproject.org/pub/epel/6/i386/epel-release-6-8.noarch.rpm
# wget http://apt.sw.be/RPM-GPG-KEY.dag.txt
# rpm --import RPM-GPG-KEY.dag.txt
# rpm -Uvh rpmforge-release-0.5.3-1.el5.rf.i386.rpm
# rpm -Uvh epel-release-6-8.noarch.rpm
On x86_64 Systems
# yum install wget
# wget http://packages.sw.be/rpmforge-release/rpmforge-release-0.5.2-2.el6.rf.rpm
# wget http://epel.mirror.net.in/epel/6/x86_64/epel-release-6-8.noarch.rpm
# wget http://apt.sw.be/RPM-GPG-KEY.dag.txt
# rpm --import RPM-GPG-KEY.dag.txt
# rpm -Uvh rpmforge-release-0.5.2-2.el6.rf.rpm
# rpm -Uvh epel-release-6-8.noarch.rpm

Install RPMForge Repository

Install RPMForge Repository

Install EPEL Repository

Install EPEL Repository

Installing Repositories

Installing Repositories

Step 2: Install Needed Software Packages

Now let’s install the required software packages needed for Observium.

# yum install httpd php php-mysql php-gd php-snmp vixie-cron php-mcrypt \
php-pear net-snmp net-snmp-utils graphviz subversion mysql-server mysql rrdtool \
fping ImageMagick jwhois nmap ipmitool php-pear.noarch MySQL-python

Install Needed Packages

Install Needed Packages

If you wish to monitor virtual machines, please install ‘libvirt‘ package.

# yum install libvirt

Step 3: Downloading Observium

For your information, Observium has two following editions

  1. Community/Open Source Edition: This edition is freely available for download with less features and few security fixes.
  2. Subscription Edition: This edition is comes with additional features, rapid feature/fixes, hardware support and easy to use SVN-based release mechanism.

Firstly navigate to the /opt directly, here we will going to install Observium as default. If you wish to install somewhere else, please modify commands and configuration accordingly. We strongly suggest you to first deploy under /opt directory. Once you verify that everything works perfectly, you can install at your desired location.

If you have a active Observium subscription, you can use SVN repositories to download most recent version. A valid subscription account only valid for a single installation and two testing or development installations with daily security patches, new features and bug fixes.

To download most recent stable and current version of Observium, you need to have a svn package installed on the system, in order to pull the files from the SVN repository.

# yum install svn
Development Version
# svn co http://svn.observium.org/svn/observium/trunk observium
Stable Version
# svn co http://svn.observium.org/svn/observium/branches/stable observium

We don’t have a valid subscription, So we we are going to try out Observium using the Community/Open Source Edition. Download the latest ‘observium-community-latest.tar.gz’ stable version and unpack it as shown.

# cd /opt
# wget http://www.observium.org/observium-community-latest.tar.gz
# tar zxvf observium-community-latest.tar.gz

Download Observium Community Edition

Download Observium Community Edition

Step 4: Creating Observium MySQL Database

This is a clean installation of MySQL. So, we are going to set a new root password with the help of following command.

# service mysqld start
# /usr/bin/mysqladmin -u root password 'yourmysqlpassword'

Now login into mysql shell and create the new Observium database.

# mysql -u root -p

mysql> CREATE DATABASE observium;
mysql> GRANT ALL PRIVILEGES ON observium.* TO 'observium'@'localhost' IDENTIFIED BY 'dbpassword';

Step 5: Configure Observium

Configuring SELinux to work with Observium is beyond the scope of this article, so we disabled SELinux. If you are familiar with SELinux rules, then you can configure it, but no guarantee that the Observium work with active SELinux. So, better disable it permanently. To do, open ‘/etc/sysconfig/selinux‘ file and change the option from ‘permissive‘ to ‘disabled‘.

# vi /etc/sysconfig/selinux
SELINUX=disabled

Copy the default configuration file ‘config.php.default‘ to ‘config.php‘ and modify the settings as shown.

# /opt/observium
# cp config.php.default config.php

Now open ‘config.php‘ file and enter MySQL details such as database name, username and password.

# vi config.php
// Database config
$config['db_host'] = 'localhost';
$config['db_user'] = 'observium';
$config['db_pass'] = 'dbpassword';
$config['db_name'] = 'observium';

Then add an entry for fping binary location to config.php. In RHEL distribution the location is different.

$config['fping'] = "/usr/sbin/fping";

Enter MySQL Settings

Enter MySQL Settings

Next, run the following command to setup the MySQL database and insert the database default file schema.

# php includes/update/update.php

Insert Observium Database Schema

Insert Observium Database Schema

Step 6: Configure Apache for Observium

Now create a ‘rrd‘ directory under ‘/opt/observium‘ directory for storing RRD’s.

# /opt/observium
# mkdir rrd

Next, grant Apache ownership to ‘rrd‘ directory to write and store RRD’s under this directory.

# chown apache:apache rrd

Create a Apache Virtual Host directive for Obervium in ‘/etc/httpd/conf/httpd.conf‘ file.

# vi /etc/httpd/conf/httpd.conf

Add the following Virtual Host directive at the bottom of the file and enable Virtualhost section as shown in the screenshot below.

<VirtualHost *:80>
  DocumentRoot /opt/observium/html/
  ServerName  observium.domain.com
  CustomLog /opt/observium/logs/access_log combined
  ErrorLog /opt/observium/logs/error_log
  <Directory "/opt/observium/html/">
  AllowOverride All
  Options FollowSymLinks MultiViews
  </Directory>
  </VirtualHost>

Create Observium Virtual Host

Create Observium Virtual Host

To maintain observium logs, create a ‘logs‘ directory for Apache under ‘/op/observium‘ and apply Apache ownership to write logs.

# mkdir /opt/observium/logs
# chown apache:apache /opt/observium/logs

After all settings, restart Apache service.

# service httpd restart

Step 7: Create Observium Admin User

Add a first user, give level of 10 for admin. Make sure to replace username and password with your choice.

# cd /opt/observium
# ./adduser.php tecmint tecmint123 10

User tecmint added successfully.

Next add a New Device and run following commands to populate the data for new device.

# ./add_device.php <hostname> <community> v2c
# ./discovery.php -h all
# ./poller.php -h all

Populate Observium Data

Populate Observium Data

Next set a cron jobs, create a new file ‘/etc/cron.d/observium‘ and add the following contents.

33  */6   * * *   root    /opt/observium/discovery.php -h all >> /dev/null 2>&1
*/5 *      * * *   root    /opt/observium/discovery.php -h new >> /dev/null 2>&1
*/5 *      * * *   root    /opt/observium/poller-wrapper.py 1 >> /dev/null 2>&1

Reload cron process to take new entries.

# /etc/init.d/cron reload

The final step is to add httpd and mysqld services system-wide, to automatically start after system boot.

# chkconfig mysqld on
# chkconfig httpd on

Finally, open your favourite browser and point to http://Your-Ip-Address.

Observium Login Screen

Observium Login Screen

Observium Dashboard

Observium Dashboard

Observium Screenshot Tour

Following are the screen grabs of last mid-2013, taken from the Observium website. For up-to-date view, please check live demo.

Complete System Information

Complete System Information

Load Average Graphs

Load Average Graphs

Historical Usage Overview

Historical Usage Overview

CPU Frequency Monitoring

CPU Frequency Monitoring

Conclusion

Observium doesn’t mean to completely remove other monitoring tools such as Nagios or Cacti, but rather to addition them with terrific understanding of certain devices. For this reason, its important to deploy Observium with Naigos or other monitoring systems to provide alerting and Cacti to produce customized graphing of your network devices.

Reference Links:

  1. Observium Homepage
  2. Observium Documentation

Source

WP2Social Auto Publish Powered By : XYZScripts.com