How to Setup MySQL (Master-Slave) Replication in RHEL, CentOS, Fedora

The following tutorial aims to provide you a simple step-by-step guide for setting up MySQL (Master-SlaveReplication in RHEL 6.3/6.2/6.1/6/5.8CentOS 6.3/6.2/6.1/6/5.8 and Fedora 17,16,15,14,13,12 using latest MySQL version. This guide is specially written for CentOS 6.3 Operating System, but also work with older version of Linux distributions with MySQL 5.x.

UPDATE: If you’re looking for MariaDB Master-Slave Replication under CentOS/RHEL 7 and Debian 8 and it’s derivatives such as Ubuntu, follow this guide Setup MariaDB Master-Slave Replication.

mysql replication in Linux

MySQL Master-Slave Replication in RedHat / CentOS / Fedora

The MySQL Replication is very useful in terms of Data SecurityFail-over SolutionDatabase Backup from SlaveAnalytics etc. We use the following things to carry the replication process. In your scenario it would be different.

  1. Working Linux OS like CentOS 6.3RedHat 6.3 or Fedora 17
  2. Master and Slave are CentOS 6.3 Linux Servers.
  3. Master IP Address is: 192.168.1.1.
  4. Slave IP Address is: 192.168.1.2.
  5. Master and Slave are on the same LAN network.
  6. Master and Slave has MySQL version installed.
  7. Master allow remote MySQL connections on port 3306.

We have two servers, one is Master with IP (192.168.1.1) and other is Slave as (192.168.1.2). We have divided the setup process in two phases to make things easier for you, In Phase I we will configure Master server and in Phase II with Slave server. Let’s start the replication setup process.

Phase I: Configure Master Server (192.168.1.1) for Replication

In Phase I, we will see the installation of MySQL, setting up Replication and then verifying replication.

Install a MySQL in Master Server

First, proceed with MySQL installation using YUM command. If you already have MySQL installation, you can skip this step.

# yum install mysql-server mysql
Configure a MySQL in Master Server

Open my.cnf configuration file with VI editor.

# vi /etc/my.cnf

Add the following entries under [mysqld] section and don’t forget to replace tecmint with database name that you would like to replicate on Slave.

server-id = 1
binlog-do-db=tecmint
relay-log = /var/lib/mysql/mysql-relay-bin
relay-log-index = /var/lib/mysql/mysql-relay-bin.index
log-error = /var/lib/mysql/mysql.err
master-info-file = /var/lib/mysql/mysql-master.info
relay-log-info-file = /var/lib/mysql/mysql-relay-log.info
log-bin = /var/lib/mysql/mysql-bin

Restart the MySQL service.

# /etc/init.d/mysqld restart

Login into MySQL as root user and create the slave user and grant privileges for replication. Replace slave_userwith user and your_password with password.

# mysql -u root -p
mysql> GRANT REPLICATION SLAVE ON *.* TO 'slave_user'@'%' IDENTIFIED BY 'your_password';
mysql> FLUSH PRIVILEGES;
mysql> FLUSH TABLES WITH READ LOCK;
mysql> SHOW MASTER STATUS;

+------------------+----------+--------------+------------------+
| File             | Position | Binlog_Do_DB | Binlog_Ignore_DB |
+------------------+----------+--------------+------------------+
| mysql-bin.000003 | 11128001 | tecmint		 |                  |
+------------------+----------+--------------+------------------+
1 row in set (0.00 sec)

mysql> quit;

Please write down the File (mysql-bin.000003) and Position (11128001) numbers, we required these numbers later on Slave server. Next apply READ LOCK to databases to export all the database and master database information with mysqldump command.

#  mysqldump -u root -p --all-databases --master-data > /root/dbdump.db

Once you’ve dump all the databases, now again connect to mysql as root user and unlcok tables.

mysql> UNLOCK TABLES;
mysql> quit;

Upload the database dump file on Slave Server (192.168.1.2) using SCP command.

scp /root/dbdump.db root@192.168.1.2:/root/

That’s it we have successfully configured Master server, let’s proceed to Phase II section.

Phase II: Configure Slave Server (192.168.1.2) for Replication

In Phase II, we do the installation of MySQL, setting up Replication and then verifying replication.

Install a MySQL in Slave Server

If you don’t have MySQL installed, then install it using YUM command.

# yum install mysql-server mysql
Configure a MySQL in Slave Server

Open my.cnf configuration file with VI editor.

# vi /etc/my.cnf

Add the following entries under [mysqld] section and don’t forget to replace IP address of Master server, tecmint with database name etc, that you would like to replicate with Master.

server-id = 2
master-host=192.168.1.1
master-connect-retry=60
master-user=slave_user
master-password=yourpassword
replicate-do-db=tecmint
relay-log = /var/lib/mysql/mysql-relay-bin
relay-log-index = /var/lib/mysql/mysql-relay-bin.index
log-error = /var/lib/mysql/mysql.err
master-info-file = /var/lib/mysql/mysql-master.info
relay-log-info-file = /var/lib/mysql/mysql-relay-log.info
log-bin = /var/lib/mysql/mysql-bin

Now import the dump file that we exported in earlier command and restart the MySQL service.

# mysql -u root -p < /root/dbdump.db
# /etc/init.d/mysqld restart

Login into MySQL as root user and stop the slave. Then tell the slave to where to look for Master log file, that we have write down on master with SHOW MASTER STATUS; command as File (mysql-bin.000003) and Position (11128001) numbers. You must change 192.168.1.1 to the IP address of the Master Server, and change the user and password accordingly.

# mysql -u root -p
mysql> slave stop;
mysql> CHANGE MASTER TO MASTER_HOST='192.168.1.1', MASTER_USER='slave_user', MASTER_PASSWORD='yourpassword', MASTER_LOG_FILE='mysql-bin.000003', MASTER_LOG_POS=11128001;
mysql> slave start;
mysql> show slave status\G
*************************** 1. row ***************************
               Slave_IO_State: Waiting for master to send event
                  Master_Host: 192.168.1.1
                  Master_User: slave_user
                  Master_Port: 3306
                Connect_Retry: 60
              Master_Log_File: mysql-bin.000003
          Read_Master_Log_Pos: 12345100
               Relay_Log_File: mysql-relay-bin.000002
                Relay_Log_Pos: 11381900
        Relay_Master_Log_File: mysql-bin.000003
             Slave_IO_Running: Yes
            Slave_SQL_Running: Yes
              Replicate_Do_DB: tecmint
          Replicate_Ignore_DB:
           Replicate_Do_Table:
       Replicate_Ignore_Table:
      Replicate_Wild_Do_Table:
  Replicate_Wild_Ignore_Table:
                   Last_Errno: 0
                   Last_Error:
                 Skip_Counter: 0
          Exec_Master_Log_Pos: 12345100
              Relay_Log_Space: 11382055
              Until_Condition: None
               Until_Log_File:
                Until_Log_Pos: 0
           Master_SSL_Allowed: No
           Master_SSL_CA_File:
           Master_SSL_CA_Path:
              Master_SSL_Cert:
            Master_SSL_Cipher:
               Master_SSL_Key:
        Seconds_Behind_Master: 0
Master_SSL_Verify_Server_Cert: No
                Last_IO_Errno: 0
                Last_IO_Error:
               Last_SQL_Errno: 0
               Last_SQL_Error:
1 row in set (0.00 sec)

Verifying MySQL Replication on Master and Slave Server

It’s really very important to know that the replication is working perfectly. On Master server create table and insert some values in it.

On Master Server
mysql> create database tecmint;
mysql> use tecmint;
mysql> CREATE TABLE employee (c int);
mysql> INSERT INTO employee (c) VALUES (1);
mysql> SELECT * FROM employee;
+------+
|  c  |
+------+
|  1  |
+------+
1 row in set (0.00 sec)
On Slave Server

Verifying the SLAVE, by running the same command, it will return the same values in the slave too.

mysql> use tecmint;
mysql> SELECT * FROM employee;
+------+
|  c  |
+------+
|  1  |
+------+
1 row in set (0.00 sec)

That’s it, finally you’ve configured MySQL Replication in a few simple steps. More information can be found at MySQL Replication Guide.

Source

Mytop – A Useful Tool for Monitoring MySQL/MariaDB Performance in Linux

Mytop is an open source and free monitoring program for MySQL and MariaDB databases was written by Jeremy Zawodny using Perl language. It is much similar in look and feel of the most famous Linux system monitoring tool called top.

Mytop program provides a command-line shell interface to monitor real time MySQL/MariaDB threadsqueries per secondprocess list and performance of databases and gives a idea for the database administrator to better optimize the server to handle heavy load.

By default Mytop tool is included in the Fedora and Debian/Ubuntu repositories, so you just have to install it using your default package manager.

If you are using RHEL/CentOS distributions, then you need to enable third party EPEL repository to install it.

For other Linux distributions you can get mytop source package and compile it from source as shown.

# tar -zxvf mytop-<version>.tar.gz
# cd mytop-
# perl Makefile.PL
# make
# make test
# make install

In this MySQL monitoring tutorial, we will show you how to install, configure and use mytop on various Linux distributions.

Please note you must have running MySQL/MariaDB Server on the system to install and use Mytop.

Install Mytop in Linux Systems

To install Mytop, run the appropriate command below for your Linux distribution to install it.

$ sudo apt install mytop	#Debian/Ubuntu
# yum install mytop	        #RHEL/CentOS
# dnf install mytop	        #Fedora 22+
# pacman -S mytop	        #Arch Linux 
# zypper in mytop	        #openSUSE
Sample Output :
Loaded plugins: changelog, fastestmirror
Loading mirror speeds from cached hostfile
 * base: mirrors.linode.com
 * epel: mirror.freethought-internet.co.uk
 * extras: mirrors.linode.com
 * updates: mirrors.linode.com
Resolving Dependencies
--> Running transaction check
---> Package mytop.noarch 0:1.7-10.b737f60.el7 will be installed
--> Finished Dependency Resolution

Dependencies Resolved

==============================================================================================================================================================================
 Package                               Arch                                   Version                                              Repository                            Size
==============================================================================================================================================================================
Installing:
 mytop                                 noarch                                 1.7-10.b737f60.el7                                   epel                                  33 k

Transaction Summary
==============================================================================================================================================================================
Install  1 Package

Total download size: 33 k
Installed size: 68 k
Is this ok [y/d/N]: y

How to use Mytop to Monitor MySQL/MariaDB

Mytop needs MySQL/MariaDB login credentials to monitor databases and connects to the server with the root username by default. You can specify the necessary options for connecting to the database server on the command-line as you run it or in the file ~/.mytop (for convenience as explained later on).

Just run the following command to start the mytop and provide your MySQL/MariaDB root user password, when prompted. This will connect to the test database by default.

# mytop --prompt
Password:

Once you entered the MySQL root password you will see Mytop monitoring shell, similar to below.

MySQL Database Monitoring

MySQL Database Monitoring

If you would like to monitor specific database, then use the -d option as shown below. For example the below command will monitor database tecmint.

# mytop --prompt -d tecmint
Password:

Monitor MySQL Database

Monitor MySQL Database

If each of your databases has a specific admin (for example tecmint database admin), then connect using the database username and password like so.

# mytop -u tecmint -p password_here -d tecmintdb

However, this has certain security implications since the user’s password is typed on the command-line and can be stored in the shell command history file. This file can be viewed later on by an unauthorized person who might land on the username and password.

To avoid the risk of such a scenario, use the ~/.mytop config file to specify options for connecting to the database. Another advantage of this method is that you also do away with typing numerous command-line arguments each time you want to run mytop.

# vi ~/.mytop

Then add the necessary options below in it.

user=root
pass=password_here
host=localhost
db=test
delay=4
port=3306
socket=

Save and close the file. Then run mytop without any command-line arguments.

# mytop

It has a capability to show large amount of information on the screen and has many keyboard shortcut options too, check out “man mytop” for more information.

# man mytop

Read Also :

  1. Mtop (MySQL Database Monitoring) in RHEL/CentOS/Fedora
  2. Innotop to Monitor MySQL Performance

In this article, we have explained how to install, configure and use mytop in Linux. If you have any questions, use the feedback form below to reach us.

Source

Install Mtop (MySQL Database Server Monitoring) in RHEL/CentOS 7/6/5/4, Fedora 17-12

mtop (MySQL top) is an open source real time MYSQL Server monitoring program written in Perl language that shows queries which are taking longer time to process and kills those longer queries after certain number of specified time. Mtop program enable us to monitor and identify performance and related issues of MySQL Server from the command line interface similar to Linux Top Command.

Mtop MySQL Monitoring

Install Mtop MySQL Monitoring

Mtop includes zooming feature that display query optimizer information of a running queries and killing queries, it also shows statistics of server, configuration information and some useful tuning tips to optimize and improve MySQL performance.

Please check some of the following features offered by Mtop program.

  1. Display real time MySQL server queries.
  2. Provides MySQL configuration information.
  3. Zooming feature to display process query.
  4. Provides query Optimizer information for a query and ‘killing’ queries.
  5. Provides MySQL tuning tips.
  6. Ability to save output in a .mtoprc configuration file.
  7. Provides Sysadmin recommendation page (‘T‘).
  8. Added queries/second to main header.
  9. Added per second info to stats screen.

In this article we’re going to show how to install Mtop (MySQL Top) program under RHEL 7/6.3/6.2/6.1/6/5.8/5.6/4.0CentOS 7/6.3/6.2/6.1/6/5.8/5.6/4.0 and Fedora 17,16,15,14,13,12 using RPMForgerepository via YUM Command.

Enable RPMForge Repository in RHEL/CentOS 6/5/4 and Fedora 17-12

First, you need to enable RPMForge repository under your Linux machine to download and install latest version of MTOP program.

Install RPMForge on RHEL/CentOS 6

Select the following links based on your Linux architecture to enable RPMforge repository under your Linux box. (Note : Fedora user’s don’t need to enable any repository under Fedora box).

For RHEL/CentOS 6 32-Bit OS
# wget http://packages.sw.be/rpmforge-release/rpmforge-release-0.5.2-2.el6.rf.i686.rpm
# rpm -Uvh rpmforge-release-0.5.2-2.el6.rf.i686.rpm
For RHEL/CentOS 6 64-Bit OS
# wget http://packages.sw.be/rpmforge-release/rpmforge-release-0.5.2-2.el6.rf.x86_64.rpm
# rpm -Uvh rpmforge-release-0.5.2-2.el6.rf.x86_64.rpm

Install RPMForge on RHEL/CentOS 5

For RHEL/CentOS 5 32-Bit OS
# wget http://packages.sw.be/rpmforge-release/rpmforge-release-0.5.2-2.el5.rf.i386.rpm
# rpm -Uvh rpmforge-release-0.5.2-2.el5.rf.i386.rpm
For RHEL/CentOS 5 64-Bit OS
# wget http://packages.sw.be/rpmforge-release/rpmforge-release-0.5.2-2.el5.rf.x86_64.rpm
# rpm -Uvh rpmforge-release-0.5.2-2.el5.rf.x86_64.rpm

Install RPMForge on RHEL/CentOS 4

For RHEL/CentOS 4 32-Bit OS
# wget http://packages.sw.be/rpmforge-release/rpmforge-release-0.5.2-2.el4.rf.i386.rpm
# rpm -Uvh rpmforge-release-0.5.2-2.el4.rf.i386.rpm
For RHEL/CentOS 4 64-Bit OS
# wget http://packages.sw.be/rpmforge-release/rpmforge-release-0.5.2-2.el4.rf.x86_64.rpm
# rpm -Uvh rpmforge-release-0.5.2-2.el4.rf.x86_64.rpm

Import RPMForge Repository Key in RHEL/CentOS 6/5/4

# wget http://dag.wieers.com/rpm/packages/RPM-GPG-KEY.dag.txt
# rpm --import RPM-GPG-KEY.dag.txt

Install Mtop in RHEL/CentOS 6/5/4 and Fedora 17-12

Once you’ve installed and enabled RPMForge repository, let’s install MTOP using following YUM command.

# yum install mtop
Sample Output :
Loaded plugins: fastestmirror
Loading mirror speeds from cached hostfile
rpmforge                                                                          | 1.9 kB     00:00
rpmforge/primary_db                                                                 2.6 MB     00:19
Setting up Install Process
Dependencies Resolved

================================================================================================================
 Package                       Arch				Version					Repository				Size
================================================================================================================
Installing:
 mtop                          noarch           0.6.6-1.2.el6.rf        rpmforge                52 k
Installing for dependencies:
 perl-Curses                   i686             1.28-1.el6.rf           rpmforge                156 k

Transaction Summary
================================================================================================================
Install       2 Package(s)

Total download size: 208 k
Installed size: 674 k
Is this ok [y/N]: y
Downloading Packages:
(1/2): mtop-0.6.6-1.2.el6.rf.noarch.rpm                                           |  52 kB     00:00
(2/2): perl-Curses-1.28-1.el6.rf.i686.rpm                                         | 156 kB     00:01
-----------------------------------------------------------------------------------------------------------------
Total                                                                     46 kB/s | 208 kB     00:04
Running rpm_check_debug
Running Transaction Test
Transaction Test Succeeded
Running Transaction
Warning: RPMDB altered outside of yum.
  Installing : perl-Curses-1.28-1.el6.rf.i686													1/2
  Installing : mtop-0.6.6-1.2.el6.rf.noarch                                                     2/2
  Verifying  : perl-Curses-1.28-1.el6.rf.i686                                                   1/2
  Verifying  : mtop-0.6.6-1.2.el6.rf.noarch                                                     2/2

Installed:
  mtop.noarch 0:0.6.6-1.2.el6.rf

Dependency Installed:
  perl-Curses.i686 0:1.28-1.el6.rf

Complete!

Starting Mtop in RHEL/CentOS 6/5/4

To start Mtop program, you need to connect to your MySQL Server, using following command.

# mysql -u root -p

Then you need to create separate user called mysqltop and grant privileges to him under your MySQL server. To do, this just run the following commands in mysql shell.

mysql> grant super, reload, process on *.* to mysqltop;
Query OK, 0 rows affected (0.00 sec)

mysql> grant super, reload, process on *.* to mysqltop@localhost;
Query OK, 0 rows affected (0.00 sec)

mysql> flush privileges;
Query OK, 0 rows affected (0.00 sec)

mysql> quit;
Bye

Running Mtop in RHEL/CentOS 6/5/4

Let’s start the Mtop program by executing below command. You will see sample output similar to below.

# mtop
Sample Outpit :
load average: 0.01, 0.00, 0.00 mysqld 5.1.61 up 5 day(s), 19:21 hrs
2 threads: 1 running, 0 cached. Queries/slow: 5/0 Cache Hit: 71.43%
Opened tables: 0  RRN: 277  TLW: 0  SFJ: 0  SMP: 0  QPS: 0

ID       USER     HOST         DB       TIME   COMMAND STATE        INFO
322081   mysqltop localhost						Query				show full processlist

Monitor Remote MySQL Server using Mtop

Simply, type the following command to monitor any remote MySQL Server.

# mtop  –host=remotehost –dbuser=username –password=password –seconds=1

Mtop Usage and Functions

Please use the following keys while mtop is running.

Filtering/display

  1. s – change the number of seconds to delay between updates
  2. m – toggle manual refresh mode on/off
  3. d – filter display with regular expression (user/host/db/command/state/info)
  4. F – fold/unfold column names in select statement display
  5. h – display process for only one host
  6. u – display process for only one user
  7. i – toggle all/non-Sleeping process display
  8. o – reverse the sort order
  9. q – quit
  10. ? – help

For more options and usage please see the man pages of mtop command by running “man mtop” on terminal.

Read Also :

  1. Mytop Database Monitoring
  2. Innotop to Monitor MySQL Performance

Source

Install Innotop to Monitor MySQL Server Performance

Innotop is an excellent command line program, similar to ‘top command‘ to monitor local and remote MySQL servers running under InnoDB engine. Innotop comes with many features and different types of modes/options, which helps to monitor different aspects of MySQL performance and also helps database administrator to find out what’s wrong going with MySQL server.

For example, Innotop helps in monitoring mysql replication statususer statisticsquery listInnoDB buffersInnoDB I/O informationopen tableslock tables, etc, it refreshes its data regularly, so you could see updated results.

Install Innotop in Centos

Innotop MySQL Server Monitoring

Innotop comes with great features and flexibility and doesn’t needs any extra configuration and it can be executed by just running ‘innotop‘ command from the terminal.

Installing Innotop (MySQL Monitoring)

By default innotop package is not included in Linux distributions such as RHELCentOSFedora and Scientific Linux. You need to install it by enabling third party epel repository and using yum command as shown below.

# yum install innotop
Sample Output
Loaded plugins: fastestmirror
Loading mirror speeds from cached hostfile
 * base: centos.mirror.net.in
 * epel: epel.mirror.net.in
 * epel-source: epel.mirror.net.in
 * extras: centos.mirror.net.in
 * updates: centos.mirror.net.in
Setting up Install Process
Resolving Dependencies
--> Running transaction check
---> Package innotop.noarch 0:1.9.0-3.el6 will be installed
--> Finished Dependency Resolution

Dependencies Resolved

==========================================================================================================
 Package			Arch		Version			Repository		Size
==========================================================================================================
Installing:
 innotop                        noarch          1.9.0-3.el6             epel                    149 k

Transaction Summary
==========================================================================================================
Install       1 Package(s)

Total download size: 149 k
Installed size: 489 k
Is this ok [y/N]: y
Downloading Packages:
innotop-1.9.0-3.el6.noarch.rpm                                                      | 149 kB    00:00     
Running rpm_check_debug
Running Transaction Test
Transaction Test Succeeded
Running Transaction
  Installing : innotop-1.9.0-3.el6.noarch							1/1 
  Verifying  : innotop-1.9.0-3.el6.noarch                                                       1/1 

Installed:
  innotop.noarch 0:1.9.0-3.el6                                                                                                                                 

Complete!

To start innotop, simply type “innotop” and specify options -u (username) and -p (password) respectively, from the command line and press Enter.

# innotop -u root -p 'tecm1nt'

Once you’ve connected to MySQL server, you should see something similar to the following screen.

[RO] Dashboard (? for help)                                                                    localhost, 61d, 254.70 QPS, 5/2/200 con/run/cac thds, 5.1.61-log
Uptime  MaxSQL  ReplLag  Cxns  Lock  QPS     QPS  Run  Run  Tbls  Repl   SQL
   61d                      4     0  254.70  _         _     462  Off 1
Innotop Help

Press “?” to get the summary of command line options and usage.

Switch to a different mode:
   A  Dashboard         I  InnoDB I/O Info     Q  Query List
   B  InnoDB Buffers    K  InnoDB Lock Waits   R  InnoDB Row Ops
   C  Command Summary   L  Locks               S  Variables & Status
   D  InnoDB Deadlocks  M  Replication Status  T  InnoDB Txns
   F  InnoDB FK Err     O  Open Tables         U  User Statistics

Actions:
   d  Change refresh interval        p  Pause innotop
   k  Kill a query's connection      q  Quit innotop
   n  Switch to the next connection  x  Kill a query

Other:
 TAB  Switch to the next server group   /  Quickly filter what you see
   !  Show license and warranty         =  Toggle aggregation
   #  Select/create server groups       @  Select/create server connections
   $  Edit configuration settings       \  Clear quick-filters
Press any key to continue

This section contains screen shots of innotop usage. Use Upper-case keys to switch between modes.

User Statistics

This mode displays user statistics and index statistics sorted by reads.

CXN        When   Load  QPS    Slow  QCacheHit  KCacheHit  BpsIn    BpsOut 
localhost  Total  0.00  1.07k   697      0.00%     98.17%  476.83k  242.83k
Query List

This mode displays the output from SHOW FULL PROCESSLIST, similar to mytop’s query list mode. This feature doesn’t display InnoDB information and it’s most useful for general usage.

When   Load  Cxns  QPS   Slow  Se/In/Up/De%             QCacheHit  KCacheHit  BpsIn    BpsOut
Now    0.05     1  0.20     0   0/200/450/100               0.00%    100.00%  882.54   803.24
Total  0.00   151  0.00     0  31/231470/813290/188205      0.00%     99.97%    1.40k    0.22

Cmd      ID      State               User      Host           DB      Time      Query
Connect      25  Has read all relay  system u                         05:26:04
InnoDB I/O Info

This mode displays InnoDB’s I/O statisticspending I/OI/O threadsfile I/O and log statistics tables by default.

____________________ I/O Threads ____________________
Thread  Purpose               Thread Status          
     0  insert buffer thread  waiting for i/o request
     1  log thread            waiting for i/o request
     2  read thread           waiting for i/o request
     3  write thread          waiting for i/o request

____________________________ Pending I/O _____________________________
Async Rds  Async Wrt  IBuf Async Rds  Sync I/Os  Log Flushes  Log I/Os
        0          0               0          0            0         0

________________________ File I/O Misc _________________________
OS Reads  OS Writes  OS fsyncs  Reads/Sec  Writes/Sec  Bytes/Sec
      26          3          3       0.00        0.00          0

_____________________ Log Statistics _____________________
Sequence No.  Flushed To  Last Checkpoint  IO Done  IO/Sec
0 5543709     0 5543709   0 5543709              8    0.00
InnoDB Buffers

This section, you will see information about the InnoDB buffer poolpage statisticsinsert buffer, and adaptive hash index. The data fetches from SHOW INNODB STATUS.

__________________________ Buffer Pool __________________________
Size  Free Bufs  Pages  Dirty Pages  Hit Rate  Memory  Add'l Pool
 512        492     20            0  --        16.51M     841.38k

____________________ Page Statistics _____________________
Reads  Writes  Created  Reads/Sec  Writes/Sec  Creates/Sec
   20       0        0       0.00        0.00         0.00

______________________ Insert Buffers ______________________
Inserts  Merged Recs  Merges  Size  Free List Len  Seg. Size
      0            0       0     1              0          2

__________________ Adaptive Hash Index ___________________
Size    Cells Used  Node Heap Bufs  Hash/Sec  Non-Hash/Sec
33.87k                           0      0.00          0.00
InnoDB Row Ops

Here, you will see the output of InnoDB row operationsrow operation miscsemaphores, and wait array tables by default.

________________ InnoDB Row Operations _________________
Ins  Upd  Read  Del  Ins/Sec  Upd/Sec  Read/Sec  Del/Sec
  0    0     0    0     0.00     0.00      0.00     0.00

________________________ Row Operation Misc _________________________
Queries Queued  Queries Inside  Rd Views  Main Thread State          
             0               0         1  waiting for server activity

_____________________________ InnoDB Semaphores _____________________________
Waits  Spins  Rounds  RW Waits  RW Spins  Sh Waits  Sh Spins  Signals  ResCnt
    2      0      41         1         1         2         4        5       5

____________________________ InnoDB Wait Array _____________________________
Thread  Time  File  Line  Type  Readers  Lck Var  Waiters  Waiting?  Ending?
Command Summary

The command summary mode displays all the cmd_summary table, which looks similar to the below.

_____________________ Command Summary _____________________
Name                    Value     Pct     Last Incr  Pct   
Com_update              11980303  65.95%          2  33.33%
Com_insert               3409849  18.77%          1  16.67%
Com_delete               2772489  15.26%          0   0.00%
Com_select                   507   0.00%          0   0.00%
Com_admin_commands           411   0.00%          1  16.67%
Com_show_table_status        392   0.00%          0   0.00%
Com_show_status              339   0.00%          2  33.33%
Com_show_engine_status       164   0.00%          0   0.00%
Com_set_option               162   0.00%          0   0.00%
Com_show_tables               92   0.00%          0   0.00%
Com_show_variables            84   0.00%          0   0.00%
Com_show_slave_status         72   0.00%          0   0.00%
Com_show_master_status        47   0.00%          0   0.00%
Com_show_processlist          43   0.00%          0   0.00%
Com_change_db                 27   0.00%          0   0.00%
Com_show_databases            26   0.00%          0   0.00%
Com_show_charsets             24   0.00%          0   0.00%
Com_show_collations           24   0.00%          0   0.00%
Com_alter_table               12   0.00%          0   0.00%
Com_show_fields               12   0.00%          0   0.00%
Com_show_grants               10   0.00%          0   0.00%
Variables & Status

This section calculates statistics, like queries per second, and displays them out in number of different modes.

QPS     Commit_PS     Rlbck_Cmt  Write_Commit     R_W_Ratio      Opens_PS   Tbl_Cch_Usd    Threads_PS  Thrd_Cch_Usd CXN_Used_Ever  CXN_Used_Now
  0             0             0      18163174             0             0             0             0             0          1.99          1.32
  0             0             0      18163180             0             0             0             0             0          1.99          1.32
  0             0             0      18163188             0             0             0             0             0          1.99          1.32
  0             0             0      18163192             0             0             0             0             0          1.99          1.32
  0             0             0      18163217             0             0             0             0             0          1.99          1.32
  0             0             0      18163265             0             0             0             0             0          1.99          1.32
  0             0             0      18163300             0             0             0             0             0          1.99          1.32
  0             0             0      18163309             0             0             0             0             0          1.99          1.32
  0             0             0      18163321             0             0             0             0             0          1.99          1.32
  0             0             0      18163331             0             0             0             0             0          1.99          1.32
Replication Status

In this mode, you will see the output of Slave SQL StatusSlave I/O Status and Master Status. The first two section shows the slave status and slave I/O thread status and the last section shows Master status.

_______________________ Slave SQL Status _______________________
Master        On?  TimeLag  Catchup  Temp  Relay Pos  Last Error
172.16.25.125  Yes    00:00     0.00     0   41295853            

____________________________________ Slave I/O Status _____________________________________
Master        On?  File              Relay Size  Pos       State                           
172.16.25.125  Yes  mysql-bin.000025      39.38M  41295708  Waiting for master to send event

____________ Master Status _____________
File              Position  Binlog Cache
mysql-bin.000010  10887846         0.00%
Non-Interactively

You can run “innotop” in non-interactively.

# innotop --count 5 -d 1 -n
uptime	max_query_time	time_behind_master	connections	locked_count	qps	spark_qps	run	spark_run	open	slave_running	longest_sql
61d			2	0	0.000363908088893752				64	Yes 	
61d			2	0	4.96871146980749	_		_	64	Yes 	
61d			2	0	3.9633543857494	^_		__	64	Yes 	
61d			2	0	3.96701862656428	^__		___	64	Yes 	
61d			2	0	3.96574802684297	^___		____	64	Yes
Monitor Remote Database

To monitor a remote database on a remote system, use the following command using a particular usernamepassword and hostname.

# innotop -u username -p password -h hostname

For more information about ‘innotop‘ usage and options, see the man pages by hitting “man innotop” on a terminal.

Reference Links

Innotop Homepage

Read Also :

  1. Mtop (MySQL Database Monitoring) in RHEL/CentOS/Fedora

Source

How to Create and Use Alias Command in Linux

Linux users often need to use one command over and over again. Typing or copying the same command again and again reduces your productivity and distracts you from what you are actually doing.

You can save yourself some time by creating aliases for your most used commands. Aliases are like custom shortcuts used to represent a command (or set of commands) executed with or without custom options. Chances are you are already using aliases on your Linux system.

List Currently Defined Aliases in Linux

You can see a list of defined aliases on your profile by simply executing alias command.

$ alias

Here you can see the default aliases defined for your user in Ubuntu 18.04.

List Aliases in Linux

List Aliases in Linux

As you can see, executing.

$ ll

Is equivalent to running:

$ ls -alF

You can create an alias with a single character that will be equivalent to a command of your choice.

How to Create Aliases in Linux

Creating aliases is relatively easy and quick process. You can create two types of aliases – temporary ones and permanent. We will review both types.

Creating Temporary Aliases

What you need to do is type the word alias then use the name you wish to use to execute a command followed by "=" sign and quote the command you wish to alias.

The syntax is as follows:

$ alias shortName="your custom command here"

Here is an actual example:

$ alias wr=”cd /var/www/html”

You can then use "wr" shortcut to go to the webroot directory. The problem with that alias is that it will only be available for your current terminal session.

If you open new terminal session, the alias will no longer be available. If you wish to save your aliases across sessions you will need a permanent alias.

Creating Permanent Aliases

To keep aliases between sessions, you can save them in your user’s shell configuration profile file. This can be:

  • Bash – ~/.bashrc
  • ZSH – ~/.zshrc
  • Fish – ~/.config/fish/config.fish

The syntax you should use is practically the same as creating a temporary alias. The only difference comes from the fact that you will be saving it in a file this time. So for example, in bash, you can open .bashrc file with your favorite editor like this:

$ vim ~/.bashrc

Find a place in the file, where you want to keep the aliases. For example, you can add them in the end of the file. For organizations purposes you can leave a comment before your aliases something like this:

#My custom aliases
alias home=”ssh -i ~/.ssh/mykep.pem tecmint@192.168.0.100”
alias ll="ls -alF"

Save the file. The file will be automatically loaded in your next session. If you want to use the newly defined alias in the current session, issue the following command:

$ source ~/.bashrc

To remove an alias added via the command line can be unaliased using unalias command.

$ unalias alias_name
$ unalias -a [remove all alias]
Conclusion

This was a short example on how to create your own alias and execute frequently used commands without having to type each command again and again. Now you can think about the commands you use the most and create shortcuts for them in your shell.

Source

Display Command Output or File Contents in Column Format

Are you fed up of viewing congested command output or file content on the terminal. This short article will demonstrate how to display command output or a file content in a much clear “columnated” format.

We can use the column utility to transform standard input or a file content into tabular form of multiple columns, for a much clear output.

Read Also12 Useful Commands For Filtering Text for Effective File Operations in Linux

To understand more clearly, we have created a following file “tecmint-authors.txt” which contains a list of top 10 authors names, number of articles written and number of comments they received on the article till now.

To demonstrate this, run the cat command below to view the tecmint-authors.txt file.

$ cat tecmint-authors.txt
Sample Output
pos|author|articles|comments
1|ravisaive|431|9785
2|aaronkili|369|7894
3|avishek|194|2349
4|cezarmatei|172|3256
5|gacanepa|165|2378
6|marintodorov|44|144
7|babin lonston|40|457
8|hannyhelal|30|367
9|gunjit kher|20|156
10|jesseafolabi|12|89

Using the column command, we can display a much clear output as follows, where the -t helps to determine the number of columns the input contains and creates a table and the -s specifies a delimiter character.

$ cat tecmint-authors.txt  | column -t -s "|"
Sample Output
pos  author         articles  comments
1    ravisaive      431       9785
2    aaronkili      369       7894
3    avishek        194       2349
4    cezarmatei     172       3256
5    gacanepa       165       2378
6    marintodorov   44        144
7    babin lonston  40        457
8    hannyhelal     30        367
9    gunjit kher    20        156
10   jesseafolabi   12        89

By default, rows are filled before columns, to fill columns before filling rows use the -x switch and to instruct column command consider empty lines (which are ignored by default), include the -e flag.

Here is another practical example, run the two commands below and see difference to further understand the magic column can do

$ mount
$ mount | column -t
Sample Output
sysfs        on  /sys                             type  sysfs            (rw,nosuid,nodev,noexec,relatime)
proc         on  /proc                            type  proc             (rw,nosuid,nodev,noexec,relatime)
udev         on  /dev                             type  devtmpfs         (rw,nosuid,relatime,size=4013172k,nr_inodes=1003293,mode=755)
devpts       on  /dev/pts                         type  devpts           (rw,nosuid,noexec,relatime,gid=5,mode=620,ptmxmode=000)
tmpfs        on  /run                             type  tmpfs            (rw,nosuid,noexec,relatime,size=806904k,mode=755)
/dev/sda10   on  /                                type  ext4             (rw,relatime,errors=remount-ro,data=ordered)
securityfs   on  /sys/kernel/security             type  securityfs       (rw,nosuid,nodev,noexec,relatime)
tmpfs        on  /dev/shm                         type  tmpfs            (rw,nosuid,nodev)
tmpfs        on  /run/lock                        type  tmpfs            (rw,nosuid,nodev,noexec,relatime,size=5120k)
tmpfs        on  /sys/fs/cgroup                   type  tmpfs            (rw,mode=755)
cgroup       on  /sys/fs/cgroup/systemd           type  cgroup           (rw,nosuid,nodev,noexec,relatime,xattr,release_agent=/
....

To save the nicely formatted output in a file, use the output redirection as shown.

$ mount | column -t >mount.out

For more information, see the columns man page:

$ man column 

You might also like to read these following related articles.

  1. How to Use Awk and Regular Expressions to Filter Text or String in Files
  2. How to Find and Sort Files Based on Modification Date and Time in Linux
  3. 11 Advanced Linux ‘Grep’ Commands on Character Classes and Bracket Expressions

If you have any question, use the comment form below to write to us. You can as well share with us any useful command line tips and tricks in Linux.

Source

Pscp – Transfer/Copy Files to Multiple Linux Servers Using Single Shell

Pscp utility allows you to transfer/copy files to multiple remote Linux servers using single terminal with one single command, this tool is a part of Pssh (Parallel SSH Tools), which provides parallel versions of OpenSSH and other similar tools such as:

  1. pscp – is utility for copying files in parallel to a number of hosts.
  2. prsync – is a utility for efficiently copying files to multiple hosts in parallel.
  3. pnuke – it helps to kills processes on multiple remote hosts in parallel.
  4. pslurp – it helps to copy files from multiple remote hosts to a central host in parallel.

When working in a network environment where there are multiple hosts on the network, a System Administrator may find these tools listed above very useful.

Copy Files and Directories to Multiple Linux Servers

Pscp – Copy Files to Multiple Linux Servers

In this article, we shall look at some useful examples of Pscp utility to transfer/copy files to multiple Linux hosts on a network.

To use the pscp tool, you need to install the PSSH utility on your Linux system, for installation of PSSH you can read this article.

  1. How to Install Pssh Tool to Execute Commands on Multiple Linux Servers

Almost all the different options used with these tools are the same except for few that are related to the specific functionality of a given utility.

How to Use Pscp to Transfer/Copy Files to Multiple Linux Servers

While using pscp you need to create a separate file that includes the number of Linux server IP address and SSH port number that you need to connect to the server.

Copy Files to Multiple Linux Servers

Let’s create a new file called “myscphosts.txt” and add the list of Linux hosts IP address and SSH port (default 22) number as shown.

192.168.0.3:22
192.168.0.9:22

Once you’ve added hosts to the file, it’s time to copy files from local machine to multiple Linux hosts under /tmpdirectory with the help of following command.

# pscp -h myscphosts.txt -l tecmint -Av wine-1.7.55.tar.bz2 /tmp/
OR
# pscp.pssh -h myscphosts.txt -l tecmint -Av wine-1.7.55.tar.bz2 /tmp/
Sample Output
Warning: do not enter your password if anyone else has superuser
privileges or access to your account.
Password: 
[1] 17:48:25 [SUCCESS] 192.168.0.3:22
[2] 17:48:35 [SUCCESS] 192.168.0.9:22

Explanation about the options used in the above command.

  1. -h switch used to read a hosts from a given file and location.
  2. -l switch reads a default username on all hosts that do not define a specific user.
  3. -A switch tells pscp ask for a password and send to ssh.
  4. -v switch is used to run pscp in verbose mode.

Copy Directories to Multiple Linux Servers

If you want to copy entire directory use -r option, which will recursively copy entire directories as shown.

# pscp -h myscphosts.txt -l tecmint -Av -r Android\ Games/ /tmp/
OR
# pscp.pssh -h myscphosts.txt -l tecmint -Av -r Android\ Games/ /tmp/
Sample Output
Warning: do not enter your password if anyone else has superuser
privileges or access to your account.
Password: 
[1] 17:48:25 [SUCCESS] 192.168.0.3:22
[2] 17:48:35 [SUCCESS] 192.168.0.9:22

You can view the manual entry page for the pscp or use pscp --help command to seek for help.

Conclusion

This tool is worth trying as if you control multiple Linux systems and already have SSH key-based passwordless login setup.

Source

Learn The Basics of How Linux I/O (Input/Output) Redirection Works

One of the most important and interesting topics under Linux administration is I/O redirection. This feature of the command line enables you to redirect the input and/or output of commands from and/or to files, or join multiple commands together using pipes to form what is known as a “command pipeline”.

All the commands that we run fundamentally produce two kinds of output:

  1. the command result – data the program is designed to produce, and
  2. the program status and error messages that informs a user of the program execution details.

In Linux and other Unix-like systems, there are three default files named below which are also identified by the shell using file descriptor numbers:

  1. stdin or 0 – it’s connected to the keyboard, most programs read input from this file.
  2. stdout or 1 – it’s attached to the screen, and all programs send their results to this file and
  3. stderr or 2 – programs send status/error messages to this file which is also attached to the screen.

Therefore, I/O redirection allows you to alter the input source of a command as well as where its output and error messages are sent to. And this is made possible by the “<” and “>” redirection operators.

How To Redirect Standard Output to File in Linux

You can redirect standard output as in the example below, here, we want to store the output of the top command for later inspection:

$ top -bn 5 >top.log

Where the flags:

  1. -b – enables top to run in batch mode, so that you can redirect its output to a file or another command.
  2. -n – specifies the number of iterations before the command terminates.

You can view the contents of top.log file using cat command as follows:

$ cat top.log

To append the output of a command, use the “>>” operator.

For instance to append the output of top command above in the top.log file especially within a script (or on the command line), enter the line below:

$ top -bn 5 >>top.log

Note: Using the file descriptor number, the output redirect command above is the same as:

$ top -bn 5 1>top.log

How To Redirect Standard Error to File in Linux

To redirect standard error of a command, you need to explicitly specify the file descriptor number, 2 for the shell to understand what you are trying to do.

For example the ls command below will produce an error when executed by a normal system user without root privileges:

$ ls -l /root/

You can redirect the standard error to a file as below:

$ ls -l /root/ 2>ls-error.log
$ cat ls-error.log 

Redirect Standard Error to File

Redirect Standard Error to File

In order to append the standard error, use the command below:

$ ls -l /root/ 2>>ls-error.log

How To Redirect Standard Output/ Error To One File

It is also possible to capture all the output of a command (both standard output and standard error) into a single file. This can be done in two possible ways by specifying the file descriptor numbers:

1. The first is a relatively old method which works as follows:

$ ls -l /root/ >ls-error.log 2>&1

The command above means the shell will first send the output of the ls command to the file ls-error.log (using >ls-error.log), and then writes all error messages to the file descriptor 2 (standard output) which has been redirected to the file ls-error.log (using 2>&1). Implying that standard error is also sent to the same file as standard output.

2. The second and direct method is:

$ ls -l /root/ &>ls-error.log

You can as well append standard output and standard error to a single file like so:

$ ls -l /root/ &>>ls-error.log

How To Redirect Standard Input to File

Most if not all commands get their input from standard input, and by default standard input is attached to the keyboard.

To redirect standard input from a file other than the keyboard, use the “<” operator as below:

$ cat <domains.list 

Redirect Standard Input to File

Redirect Standard Input to File

How To Redirect Standard Input/Output to File

You can perform standard input, standard output redirection at the same time using sort command as below:

$ sort <domains.list >sort.output

How to Use I/O Redirection Using Pipes

To redirect the output of one command as input of another, you can use pipes, this is a powerful means of building useful command lines for complex operations.

For example, the command below will list the top five recently modified files.

$ ls -lt | head -n 5 

Here, the options:

  1. -l – enables long listing format
  2. -t – sort by modification time with the newest files are shown first
  3. -n – specifies the number of header lines to show

Important Commands for Building Pipelines

Here, we will briefly review two important commands for building command pipelines and they are:

xargs which is used to build and execute command lines from standard input. Below is an example of a pipeline which uses xargs, this command is used to copy a file into multiple directories in Linux:

$ echo /home/aaronkilik/test/ /home/aaronkilik/tmp | xargs -n 1 cp -v /home/aaronkilik/bin/sys_info.sh

Copy Files to Multiple Directories

Copy Files to Multiple Directories

And the options:

  1. -n 1 – instructs xargs to use at most one argument per command line and send to the cp command
  2. cp – copies the file
  3. -v – displays progress of copy command.

For more usage options and info, read through the xargs man page:

$ man xargs 

tee command reads from standard input and writes to standard output and files. We can demonstrate how teeworks as follows:

$ echo "Testing how tee command works" | tee file1 

tee Command Example

tee Command Example

File or text filters are commonly used with pipes for effective Linux file operations, to process information in powerful ways such as restructuring output of commands (this can be vital for generation of useful Linux reports), modifying text in files plus several other Linux system administration tasks.

To learn more about Linux filters and pipes, read this article Find Top 10 IP Addresses Accessing Apache Server, shows a useful example of using filters and pipes.

In this article, we explained the fundamentals of I/O redirection in Linux. Remember to share your thoughts via the feedback section below.

Source

How to Split Large ‘tar’ Archive into Multiple Files of Certain Size

Are you worried of transferring or uploading large files over a network, then worry no more, because you can move your files in bits to deal with slow network speeds by splitting them into blocks of a given size.

In this how-to guide, we shall briefly explore the creation of archive files and splitting them into blocks of a selected size. We shall use tar, one of the most popular archiving utilities on Linux and also take advantage of the split utility to help us break our archive files into small bits.

Create and Split tar into Multiple Files or Parts in Linux

Create and Split tar into Multiple Files or Parts in Linux

Before we move further, let us take note of, how these utilities can be used, the general syntax of a tar and split command is as follows:

# tar options archive-name files 
# split options file "prefix”

Let us now delve into a few examples to illustrate the main concept of this article.

Example 1: We can first of all create an archive file as follows:

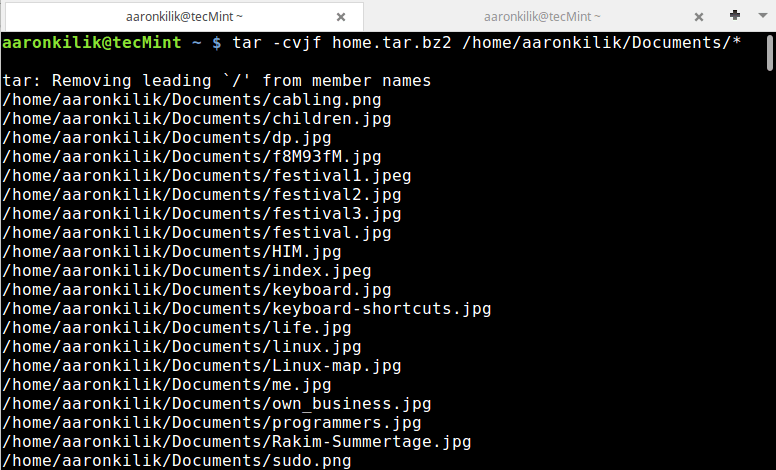
$ tar -cvjf home.tar.bz2 /home/aaronkilik/Documents/* 

Create Tar Archive File

Create Tar Archive File

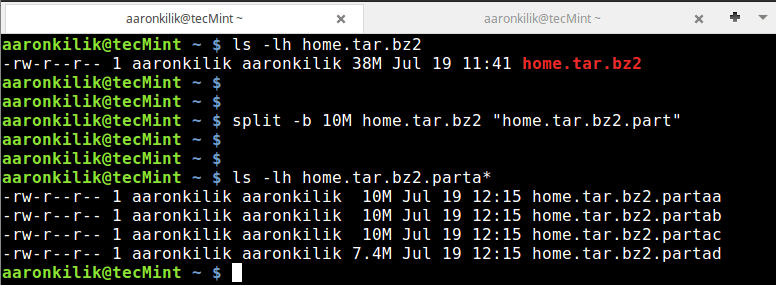
To confirm that out archive file has been created and also check its size, we can use ls command:

$ ls -lh home.tar.bz2

Then using the split utility, we can break the home.tar.bz2 archive file into small blocks each of size 10MB as follows:

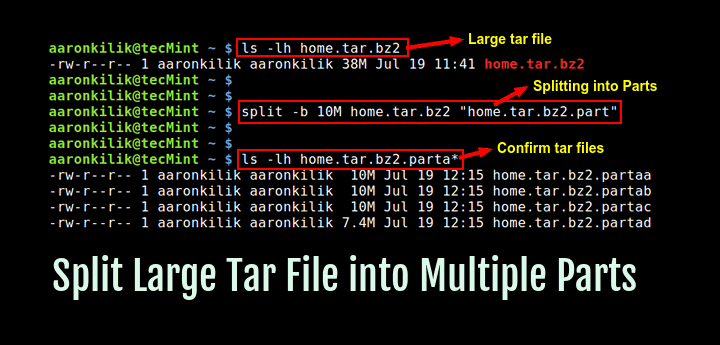
$ split -b 10M home.tar.bz2 "home.tar.bz2.part"
$ ls -lh home.tar.bz2.parta*

Split Tar File into Parts in Linux

Split Tar File into Parts in Linux

As you can see from the output of the commands above, the tar archive file has been split to four parts.

Note: In the split command above, the option -b is used to specify the size of each block and the "home.tar.bz2.part" is the prefix in the name of each block file created after splitting.

Example 2: Similar to the case above, here, we can create an archive file of a Linux Mint ISO image file.

$ tar -cvzf linux-mint-18.tar.gz linuxmint-18-cinnamon-64bit.iso 

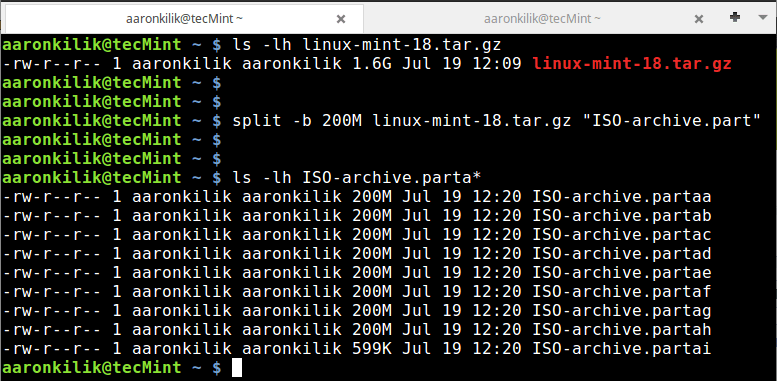
Then follow the same steps in example 1 above to split the archive file into small bits of size 200MB.

$ ls -lh linux-mint-18.tar.gz 
$ split -b 200M linux-mint-18.tar.gz "ISO-archive.part"
$ ls -lh ISO-archive.parta*

Split Tar Archive File to Fixed Sizes

Split Tar Archive File to Fixed Sizes

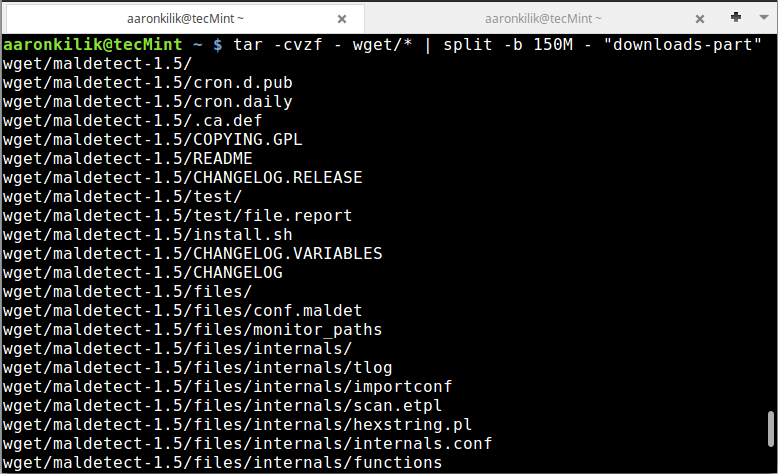
Example 3: In this instance, we can use a pipe to connect the output of the tar command to split as follows:

$ tar -cvzf - wget/* | split -b 150M - "downloads-part"

Create and Split Tar Archive File into Parts

Create and Split Tar Archive File into Parts

Confirm the files:

$ ls -lh downloads-parta*

Check Parts of Tar Files

Check Parts of Tar Files

In this last example, we do not have to specify an archive name as you have noticed, simply use a - sign.

How to Join Tar Files After Splitting

After successfully splitting tar files or any large file in Linux, you can join the files using the cat command. Employing cat is the most efficient and reliable method of performing a joining operation.

To join back all the blocks or tar files, we issue the command below:

# cat home.tar.bz2.parta* >backup.tar.gz.joined

We can see that after running the cat command, it combines all the small blocks we had earlier on created to the original tar archive file of the same size.

Conclusion

The whole idea is simple, as we have illustrated above, you simply need to know and understand how to use the various options of tar and split utilities.

You can refer to their manual entry pages of to learn more other options and perform some complex operations or you can go through the following article to learn more about tar command.

Don’t Miss: 18 Useful ‘tar’ Command Examples

For any questions or further tips, you can share your thoughts via the comment section below.

Source

dutree – A CLI Tool to Analyze Disk Usage in Coloured Output

dutree is a free open-source, fast command-line tool for analyzing disk usage, written in Rust programming language. It is developed from durep (disk usage reporter) and tree (list directory content in tree-like format) command line tools. dutree therefore reports disk usage in a tree-like format.

Read AlsoAgedu – A Useful Tool for Tracking Down Wasted Disk Space in Linux

It displays coloured output, depending on values configured in the GNU LS_COLORS environment variable. This env variable enables for setting the colours of files based on extension, permissions as well as file type.

dutree Features:

  • Show the file system tree.
  • Supports aggregating of small files.
  • Allows for comparing different directories.
  • Supports excluding of files or directories.

How to Install dutree in Linux Systems

To install dutree in Linux distributions, you must have rust programming language installed on your system as shown.

$ sudo curl https://sh.rustup.rs -sSf | sh

Once rust installed, you can run the following command to install strong>dutree in Linux distributions as shown.

$ cargo install --git https://github.com/nachoparker/dutree.git

After installing dutree, it uses environment colors according to the variable LS_COLORS, it has the same colors ls --color command that our distro has configured.

$ ls --color

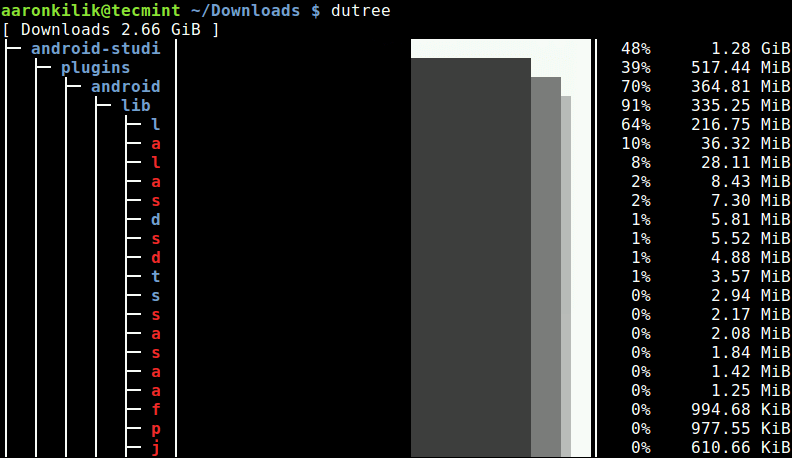
The simplest way of running dutree is without arguments, this way it shows a filesystem tree.

$ dutree

Linux Filesystem Disk Usage

Linux Filesystem Disk Usage

To display real disk usage instead of file size, use the -u flag.

$ dutree -u 

Show Linux Disk Usage

Show Linux Disk Usage

Show Directories in Depth

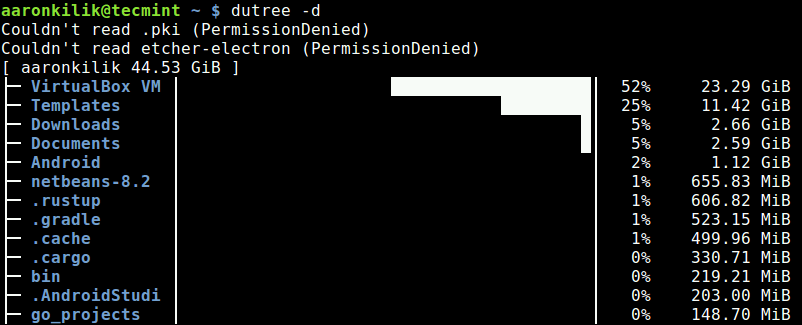
You can show directories up to a given depth (default 1), using the -d flag. The command below will show directories up to a depth of 3, under the current working directory.

For example if the current working directory (~/), then display size of ~/*/*/* as shown in the following sample screenshot.

$ dutree -d 3

Show Directories in Depth Disk Usage

Show Directories in Depth Disk Usage

Exclude Files or Directories in Output

To exclude matching a file or directory name, use the -x flag.

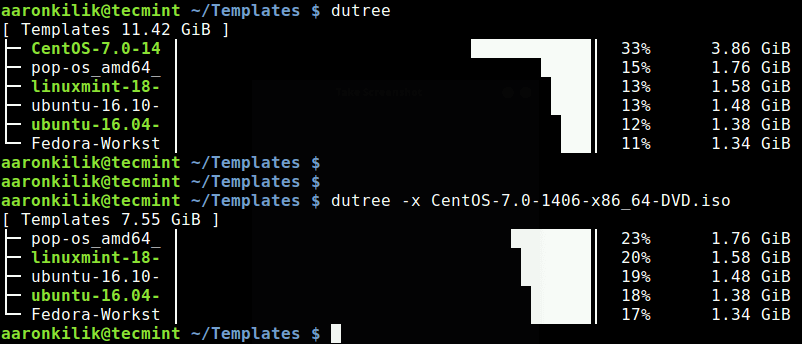
$ dutree -x CentOS-7.0-1406-x86_64-DVD.iso 

Show Disk Usage with Exclude Filename

Show Disk Usage with Exclude Filename

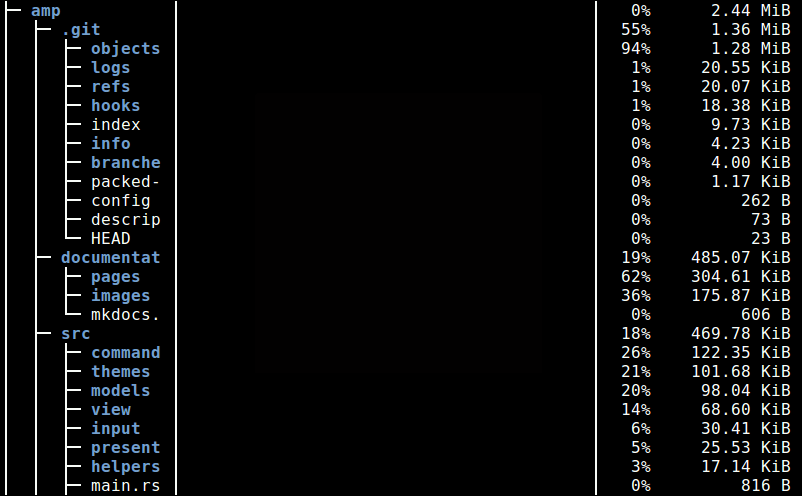
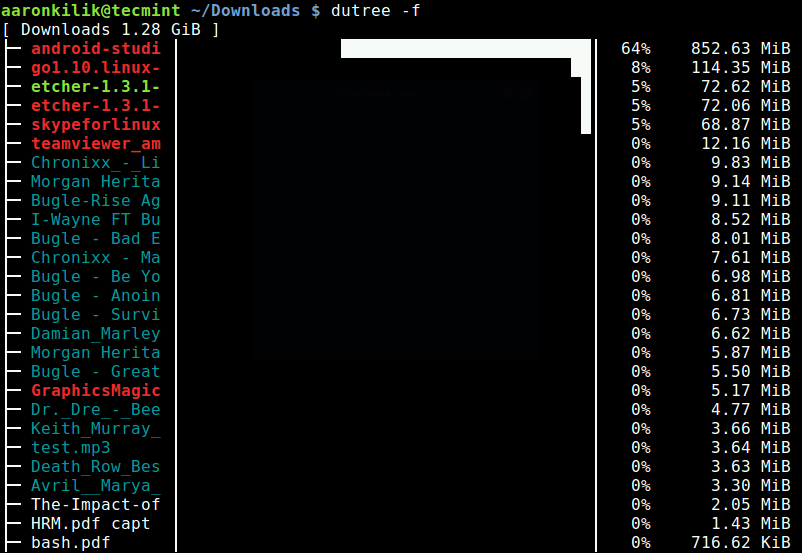
You can also get a quick local overview by skipping directories, using the -f option, like so.

$ dutree -f

Quick Overview by Skipping Directories

Quick Overview by Skipping Directories

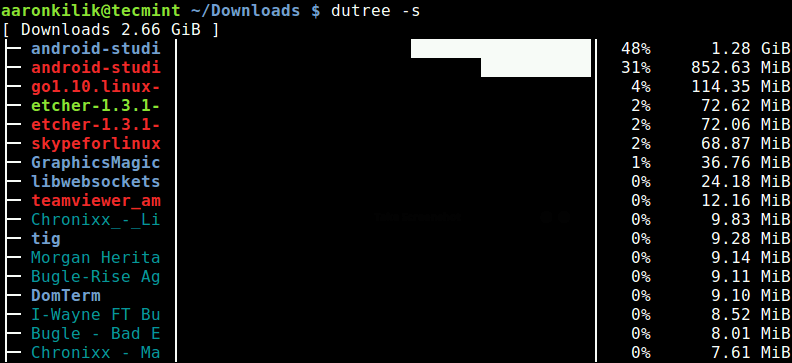
A full summary/overview can be generated using the -s flag as shown.

$ dutree -s

Linux Disk Usage Summary

Linux Disk Usage Summary

Aggregate Small Files

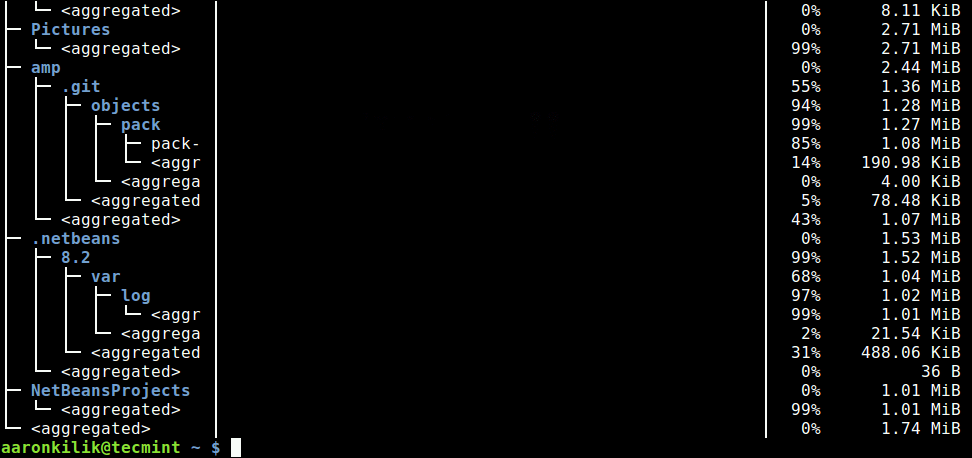
It is possible to aggregate files smaller than a certain size, default is 1M as shown.

$ dutree -a 

Aggregate Small Files

Aggregate Small Files

Exclude Hidden Files

The -H switch allows for excluding hidden files in the output.

$ dutree -H

The -b option is used to print sizes in bytes, instead of kilobytes (default).

$ dutree -b

To turn off colors, and only display ASCII characters, use the -A flag like so.

$ dutree -A

You can view the dutree help message using the -h option.

$ dutree -h

Usage: dutree [options]  [..]
 
Options:
    -d, --depth [DEPTH] show directories up to depth N (def 1)
    -a, --aggr [N[KMG]] aggregate smaller than N B/KiB/MiB/GiB (def 1M)
    -s, --summary       equivalent to -da, or -d1 -a1M
    -u, --usage         report real disk usage instead of file size
    -b, --bytes         print sizes in bytes
    -x, --exclude NAME  exclude matching files or directories
    -H, --no-hidden     exclude hidden files
    -A, --ascii         ASCII characters only, no colors
    -h, --help          show help
    -v, --version       print version number

dutree Github Repositoryhttps://github.com/nachoparker/dutree

dutree is a simple yet powerful command-line tool to show file size and analyze disk usage in tree-like format, on Linux systems. Use the comment form below to share your thoughts or queries about it, with us.

Source

WP2Social Auto Publish Powered By : XYZScripts.com