Back in the mid-1990’s when the Internet was still in its infancy, a Swedish programmer named Daniel Stenbergstarted a project that eventually grew into what we know as curl today.
Initially, he aimed at developing a bot that would download currency exchange rates from a web page periodically and would provide Swedish Kronor equivalents in US dollars to IRC users.
Long story short, the project thrived, adding several protocols and features along the way – and the rest is history. Now let’s dive in with both feet and learn how to use curl to transfer data and more in Linux!
We have put together the following list of 15 curl commands for you.
1. View curl Version
The -V or --version options will not only return the version, but also the supported protocols and features in your current version.
$ curl --version

curl 7.47.0 (x86_64-pc-linux-gnu) libcurl/7.47.0 GnuTLS/3.4.10 zlib/1.2.8 libidn/1.32 librtmp/2.3
Protocols: dict file ftp ftps gopher http https imap imaps ldap ldaps pop3 pop3s rtmp rtsp smb smbs smtp smtps telnet tftp
Features: AsynchDNS IDN IPv6 Largefile GSS-API Kerberos SPNEGO NTLM NTLM_WB SSL libz TLS-SRP UnixSockets
2. Download a File
If you want to download a file, you can use curl with the -O or -o options. The former will save the file in the current working directory with the same name as in the remote location, whereas the latter allows you to specify a different filename and/or location.
$ curl -O http://yourdomain.com/yourfile.tar.gz # Save as yourfile.tar.gz
$ curl -o newfile.tar.gz http://yourdomain.com/yourfile.tar.gz # Save as newfile.tar.gz
3. Resume an Interrupted Download
If a download was interrupted for some reason (for example, using Ctrl + c), you can resume it very easily. The use of -C – (dash C, space dash) tells curl to resume the download beginning where it left off.
$ curl -C - -O http://yourdomain.com/yourfile.tar.gz
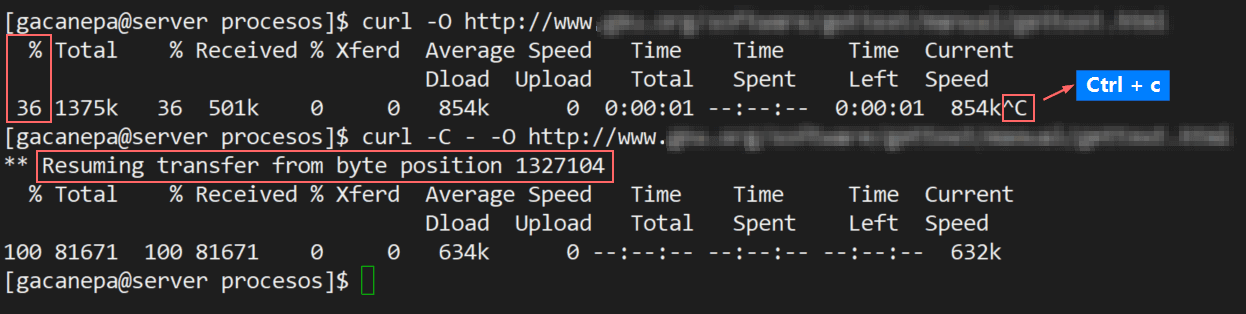
Download File Using Curl Command
4. Download Multiple Files
With the following command you will download info.html and about.html from http://yoursite.com and http://mysite.com, respectively, in one go.
$ curl -O http://yoursite.com/info.html -O http://mysite.com/about.html
5. Download URLs From a File
If you combine curl with xargs, you can download files from a list of URLs in a file.
$ xargs -n 1 curl -O < listurls.txt
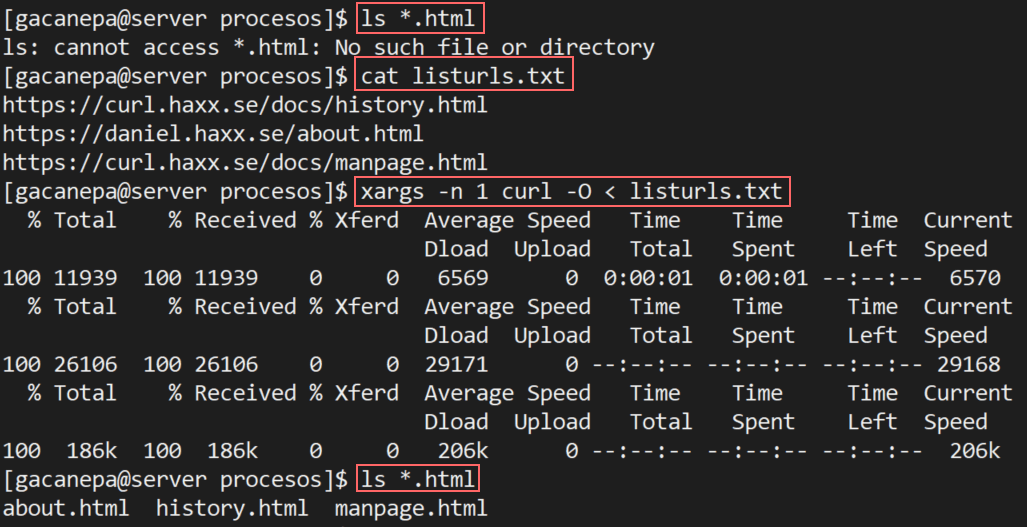
Download Multiple Files with Curl
6. Use a Proxy with or without Authentication
If you are behind a proxy server listening on port 8080 at proxy.yourdomain.com, do.
$ curl -x proxy.yourdomain.com:8080 -U user:password -O http://yourdomain.com/yourfile.tar.gz
where you can skip -U user:password if your proxy does not require authentication.
7. Query HTTP Headers
HTTP headers allow the remote web server to send additional information about itself along with the actual request. This provides the client with details on how the request is being handled.
To query the HTTP headers from a website, do:
$ curl -I www.tecmint.com
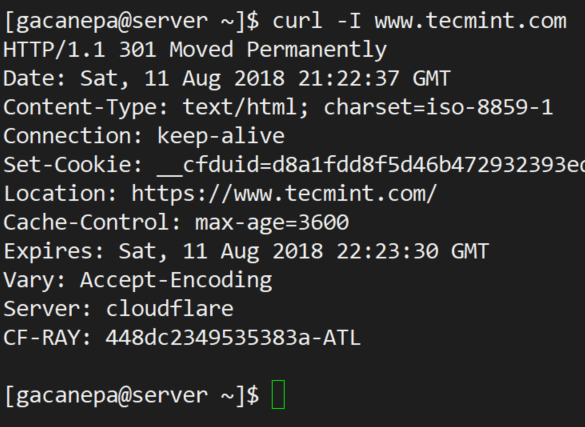
Curl Query HTTP Headers
This information is also available in your browser’s developer tools.
8. Make a POST request with Parameters
The following command will send the firstName and lastName parameters, along with their corresponding values, to https://yourdomain.com/info.php.
$ curl --data "firstName=John&lastName=Doe" https://yourdomain.com/info.php
You can use this tip to simulate the behavior of a regular HTML form.
9. Download Files from an FTP Server with or without Authentication
If a remote FTP server is expecting connections at ftp://yourftpserver, the following command will download yourfile.tar.gz in the current working directory.
$ curl -u username:password -O ftp://yourftpserver/yourfile.tar.gz
where you can skip -u username:password if the FTP server allows anonymous logins.
10. Upload Files to an FTP server with or without Authentication
To upload a local file named mylocalfile.tar.gz to ftp://yourftpserver using curl, do:
$ curl -u username:password -T mylocalfile.tar.gz ftp://yourftpserver
11. Specify User Agent
The user agent is part of the information that is sent along with an HTTP request. This indicates which browser the client used to make the request. Let’s see what our current curl version uses as default, and let’s change it later to “I am a new web browser”:
$ curl -I http://localhost --user-agent "I am a new web browser"
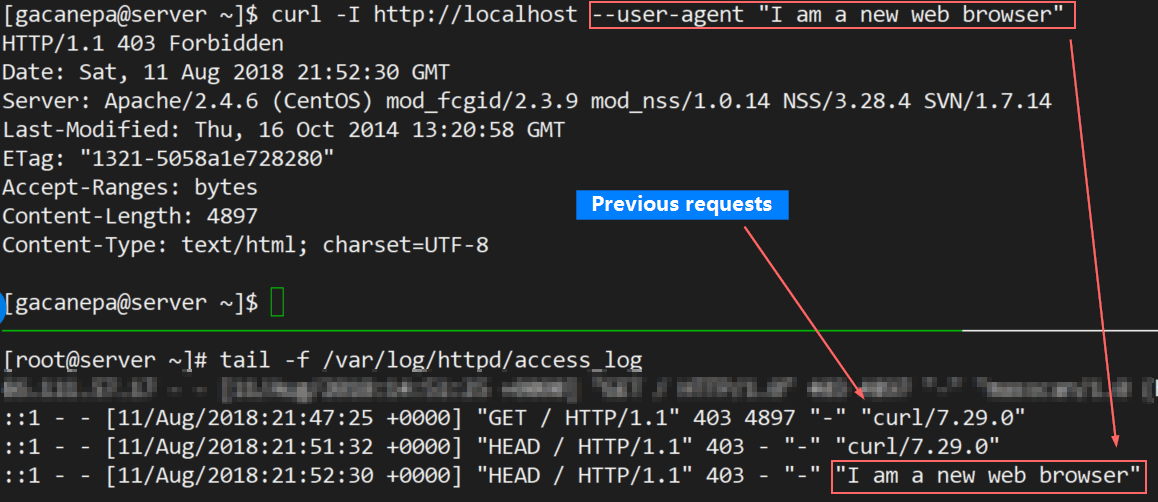
Curl Check User Agent
12. Store Website Cookies
Want to see which cookies are downloaded to your computer when you browse to https://www.cnn.com? Use the following command to save them to cnncookies.txt. You can then use cat command to view the file.
$ curl --cookie-jar cnncookies.txt https://www.cnn.com/index.html -O
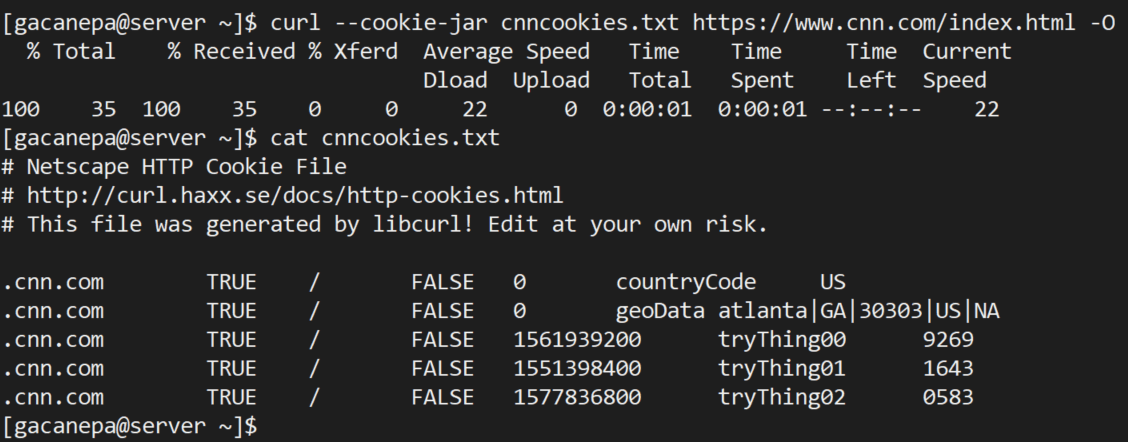
Curl Store Website Cookies
13. Send Website Cookies
You can use the cookies retrieved in the last tip in subsequent requests to the same site.
$ curl --cookie cnncookies.txt https://www.cnn.com
14. Modify Name Resolution
If you’re a web developer and want to test a local version of yourdomain.com before pushing it live, you can make curl resolve http://www.yourdomain.com to your localhost like so:
$ curl --resolve www.yourdomain.com:80:localhost http://www.yourdomain.com/
Thus, the query to http://www.yourdomain.com will tell curl to request the site from localhost instead of using DNS or the /etc/hosts file.
15. Limit Download Rate
To prevent curl from hosing your bandwidth, you can limit the download rate to 100 KB/s as follows.
$ curl --limit-rate 100K http://yourdomain.com/yourfile.tar.gz -O
Summary
In this article we have shared a brief history of the origins of curl and explained how to use it through 15 practical examples.
Do you know of any other curl commands that we may have missed in this article? Feel free to share them with our community in the comments! Also, if you have questions feel free to let us know. We look forward to hearing from you!