SARG is an open source tool that allows you to analyse the squid log files and generates beautiful reports in HTML format with informations about users, IP addresses, top accessed sites, total bandwidth usage, elapsed time, downloads, access denied websites, daily reports, weekly reports and monthly reports.
The SARG is very handy tool to view how much internet bandwidth is utilized by individual machines on the network and can watch on which websites the network’s users are accessing.
Install Sarg Squid Log Analyzer in Linux
In this article I will guide you on how to install and configure SARG – Squid Analysis Report Generator on RHEL/CentOS/Fedora and Debian/Ubuntu/Linux Mint systems.
Installing Sarg – Squid Log Analyzer in Linux
I assume that you already installed, configured and tested Squid server as a transparent proxy and DNS for the name resolution in caching mode. If not, please install and configure them first before moving further installation of Sarg.
Important: Please remember without the Squid and DNS setup, no use of installing sarg on the system it will won’t work at all. So, it’s a request to install them first before proceeding further to Sarg installation.
Follow these guides to install DNS and Squid in your Linux systems:
Install Cache-Only DNS Server
- Install Cache Only DSN Server in RHEL/CentOS 7
- Install Cache Only DSN Server in RHEL/CentOS 6
- Install Cache Only DSN Server in Ubuntu and Debian
Install Squid as Transparent Proxy
- Setting Up Squid Transparent Proxy in Ubuntu and Debian
- Install Squid Cache Server on RHEL and CentOS
Step 1: Installing Sarg from Source
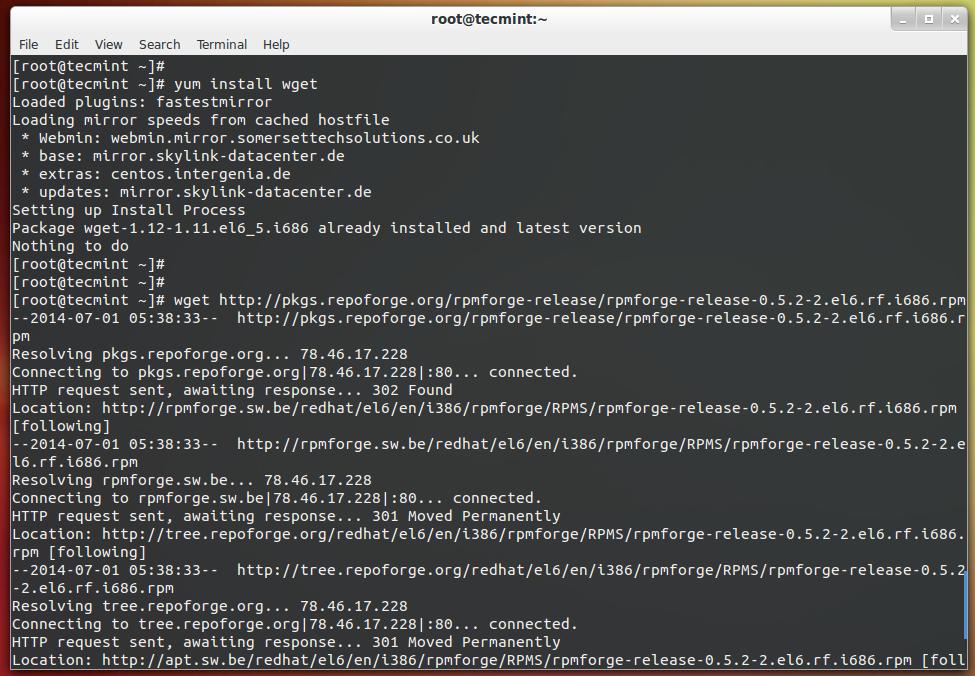
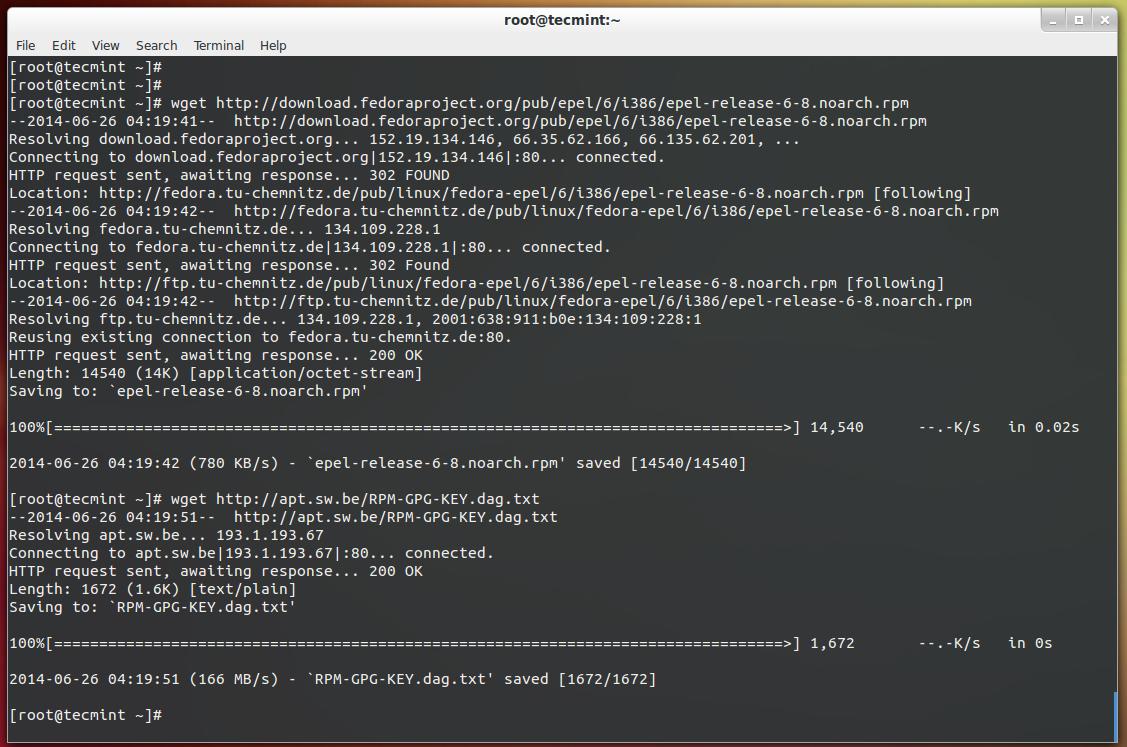
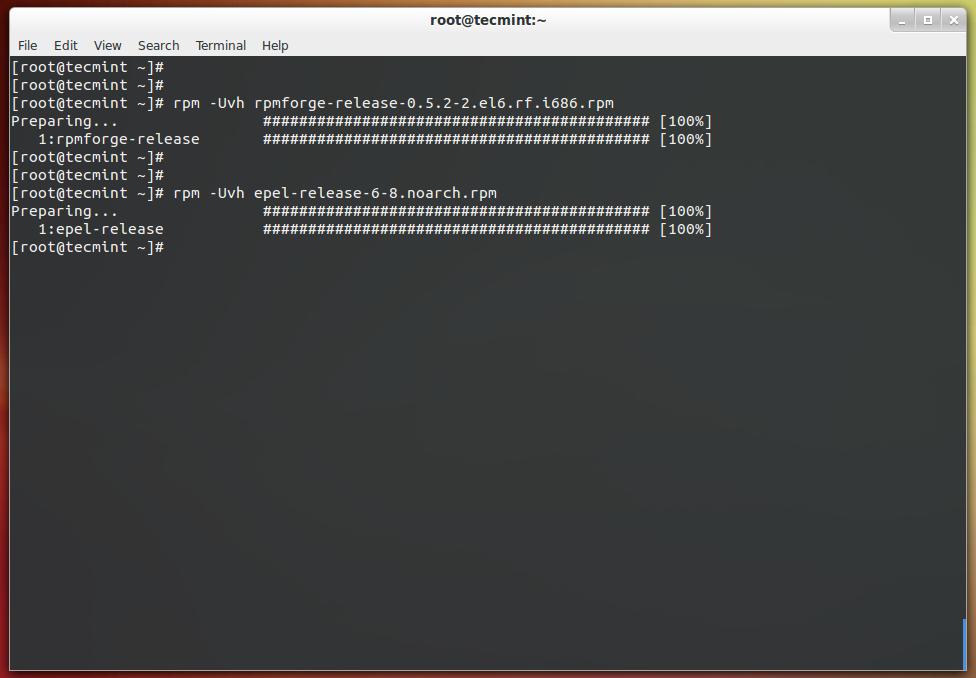
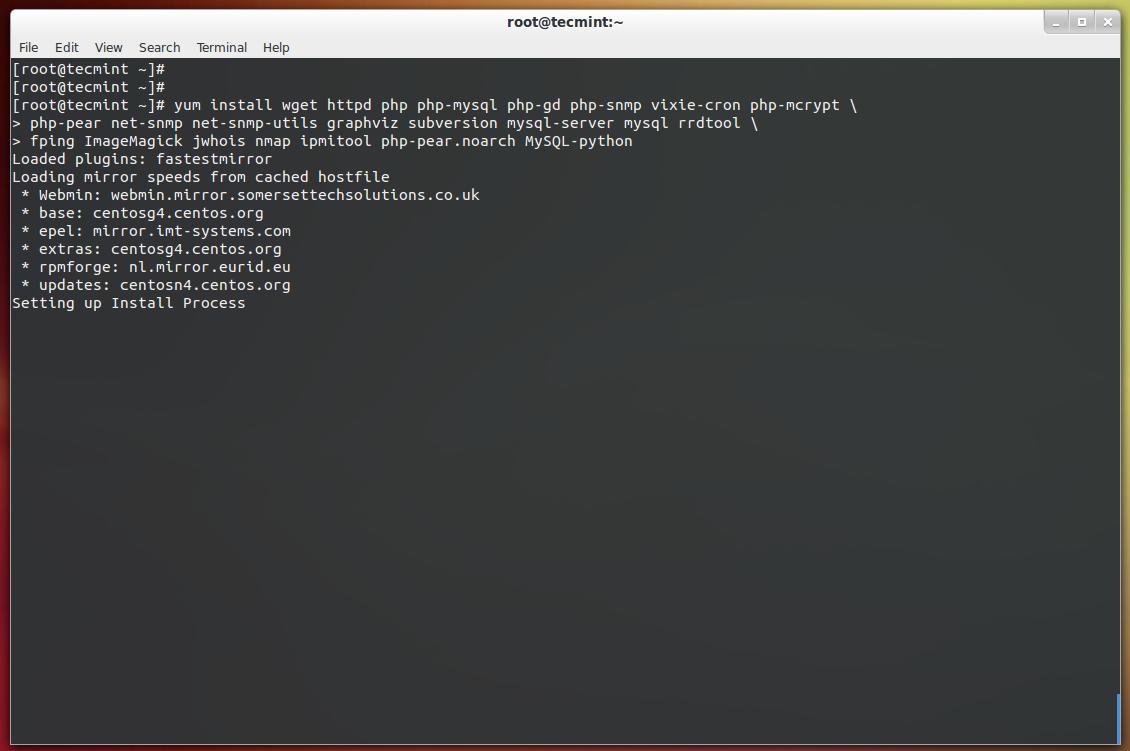
The ‘sarg‘ package by default not included in RedHat based distributions, so we need to manually compile and install it from source tarball. For this, we need some additional pre-requisites packages to be installed on the system before compiling it from source.
On RedHat/CentOS/Fedora
# yum install –y gcc gd gd-devel make perl-GD wget httpd
Once you’ve installed all the required packages, download the latest sarg source tarball or you may use the following wget command to download and install it as shown below.
# wget http://liquidtelecom.dl.sourceforge.net/project/sarg/sarg/sarg-2.3.10/sarg-2.3.10.tar.gz
# tar -xvzf sarg-2.3.10.tar.gz
# cd sarg-2.3.10
# ./configure
# make
# make install
On Debian/Ubuntu/Linux Mint
On Debian based distributions, sarg package can be easily install from the default repositories using apt-getpackage manager.
$ sudo apt-get install sarg
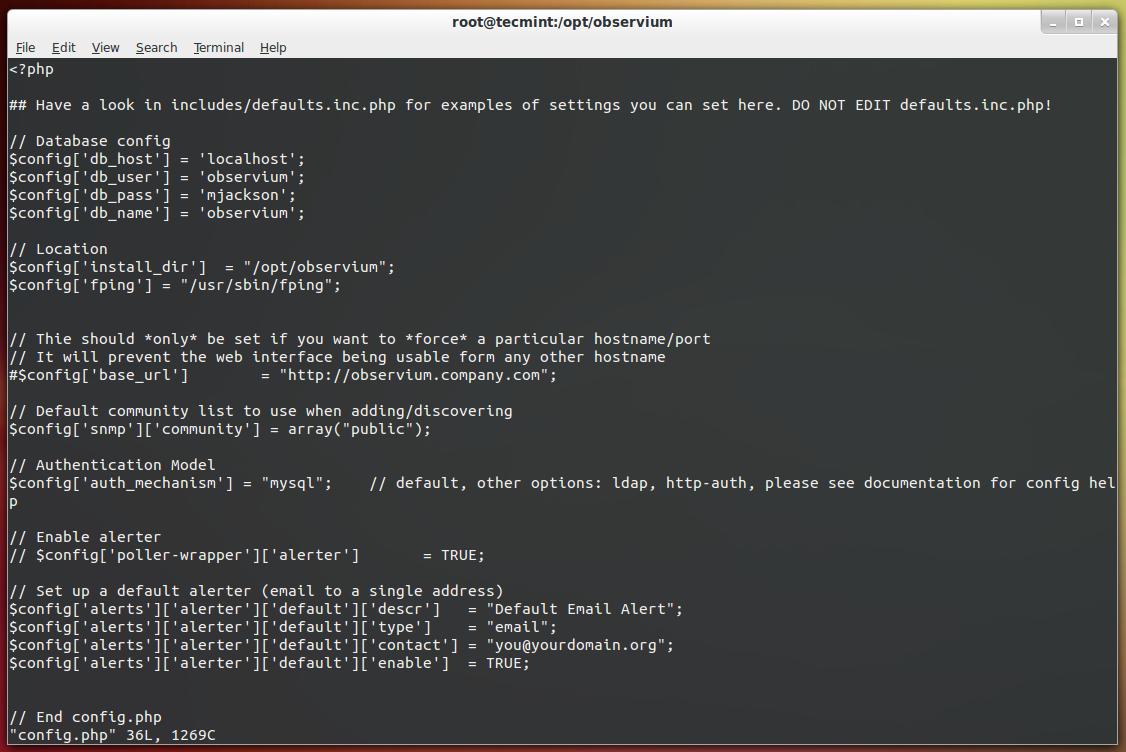
Step 2: Configuring Sarg
Now it’s time to edit some parameters in SARG main configuration file. The file contains lots of options to edit, but we will only edit required parameters like:
- Access logs path
- Output directory
- Date Format
- Overwrite report for the same date.
Open sarg.conf file with your choice of editor and make changes as shown below.
# vi /usr/local/etc/sarg.conf [On RedHat based systems]
$ sudo nano /etc/sarg/sarg.conf [On Debian based systems]
Now Uncomment and add the original path to your squid access log file.
# sarg.conf
#
# TAG:  access_log file
#       Where is the access.log file
#       sarg -l file
#
access_log /var/log/squid/access.log
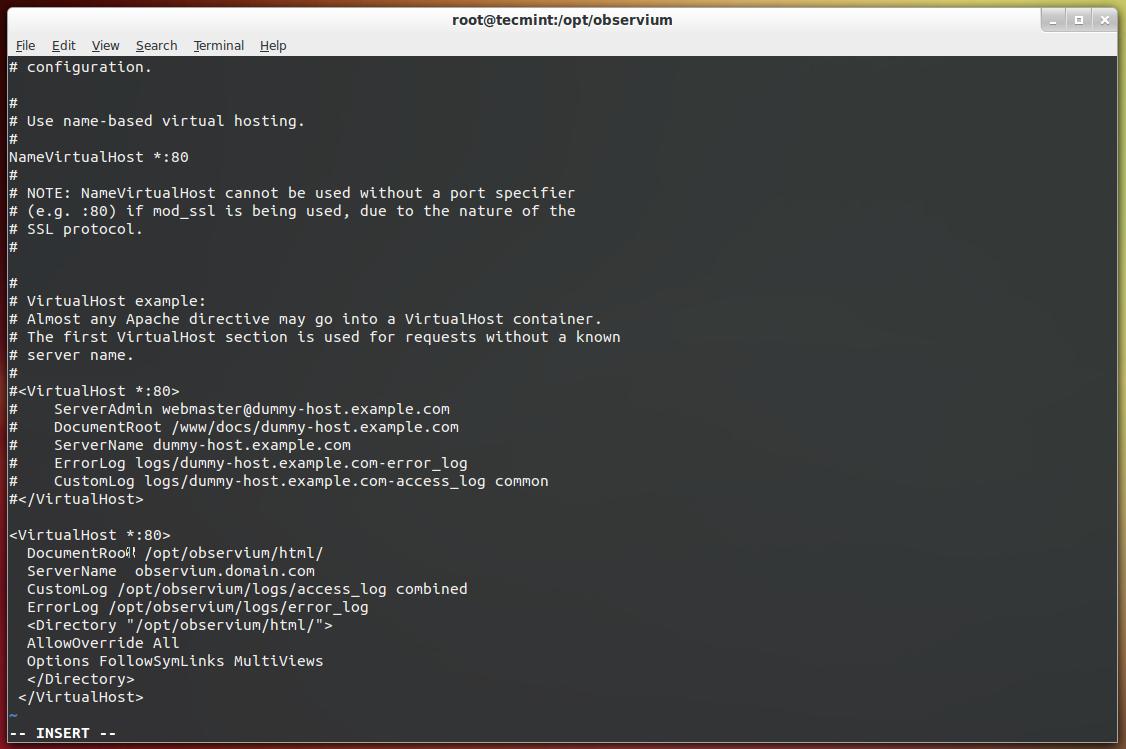
Next, add the correct Output directory path to save the generate squid reports in that directory. Please note, under Debian based distributions the Apache web root directory is ‘/var/www‘. So, please be careful while adding correct web root paths under your Linux distributions.
# TAG:  output_dir
#       The reports will be saved in that directory
#       sarg -o dir
#
output_dir /var/www/html/squid-reports
Set the correct date format for reports. For example, ‘date_format e‘ will display reports in ‘dd/mm/yy‘ format.
# TAG:  date_format
#       Date format in reports: e (European=dd/mm/yy), u (American=mm/dd/yy), w (Weekly=yy.ww)
#
date_format e
Next, uncomment and set Overwrite report to ‘Yes’.
# TAG: overwrite_report yes|no
#      yes - if report date already exist then will be overwritten.
#       no - if report date already exist then will be renamed to filename.n, filename.n+1
#
overwrite_report yes
That’s it! Save and close the file.
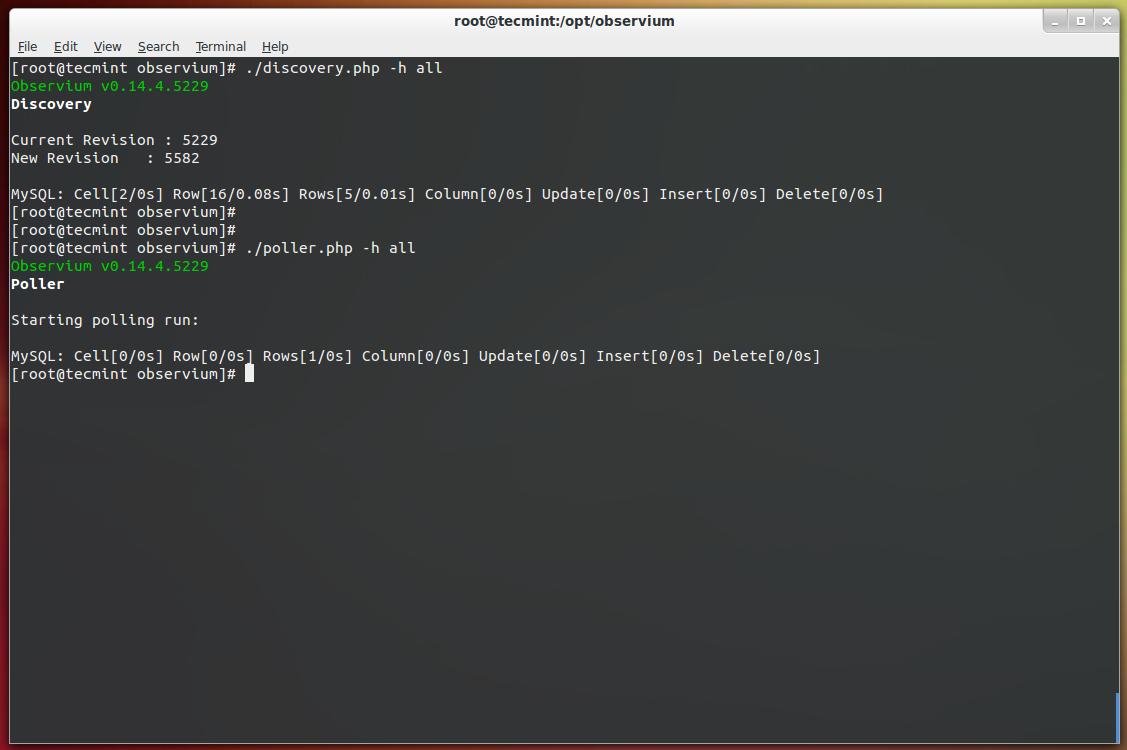
Step 3: Generating Sarg Report
Once, you’ve done with the configuration part, it’s time to generate the squid log report using the following command.
# sarg -x [On RedHat based systems]
# sudo sarg -x [On Debian based systems]
Sample Output
[root@localhost squid]# sarg -x

SARG: Init
SARG: Loading configuration from /usr/local/etc/sarg.conf
SARG: Deleting temporary directory "/tmp/sarg"
SARG: Parameters:
SARG:           Hostname or IP address (-a) =
SARG:                    Useragent log (-b) =
SARG:                     Exclude file (-c) =
SARG:                  Date from-until (-d) =
SARG:    Email address to send reports (-e) =
SARG:                      Config file (-f) = /usr/local/etc/sarg.conf
SARG:                      Date format (-g) = USA (mm/dd/yyyy)
SARG:                        IP report (-i) = No
SARG:             Keep temporary files (-k) = No
SARG:                        Input log (-l) = /var/log/squid/access.log
SARG:               Resolve IP Address (-n) = No
SARG:                       Output dir (-o) = /var/www/html/squid-reports/
SARG: Use Ip Address instead of userid (-p) = No
SARG:                    Accessed site (-s) =
SARG:                             Time (-t) =
SARG:                             User (-u) =
SARG:                    Temporary dir (-w) = /tmp/sarg
SARG:                   Debug messages (-x) = Yes
SARG:                 Process messages (-z) = No
SARG:  Previous reports to keep (--lastlog) = 0
SARG:
SARG: sarg version: 2.3.7 May-30-2013
SARG: Reading access log file: /var/log/squid/access.log
SARG: Records in file: 355859, reading: 100.00%
SARG:    Records read: 355859, written: 355859, excluded: 0
SARG: Squid log format
SARG: Period: 2014 Jan 21
SARG: Sorting log /tmp/sarg/172_16_16_55.user_unsort
......
Note: The ‘sarg -x’ command will read the ‘sarg.conf‘ configuration file and takes the squid ‘access.log‘ path and generates a report in html format.
Step 4: Assessing Sarg Report
The generated reports placed under ‘/var/www/html/squid-reports/‘ or ‘/var/www/squid-reports/‘ which can be accessed from the web browser using the address.
http://localhost/squid-reports
OR
http://ip-address/squid-reports
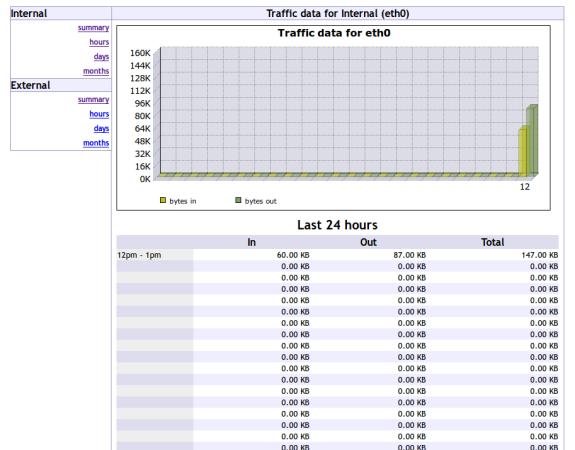
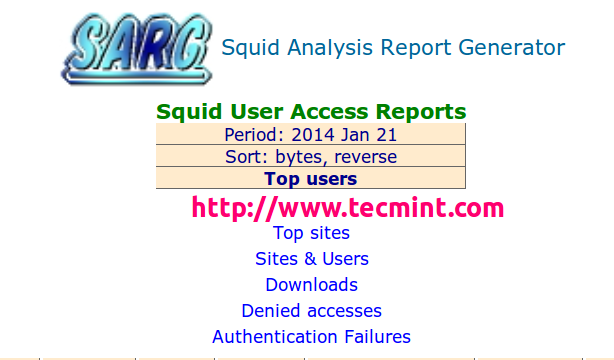
Sarg Main Window
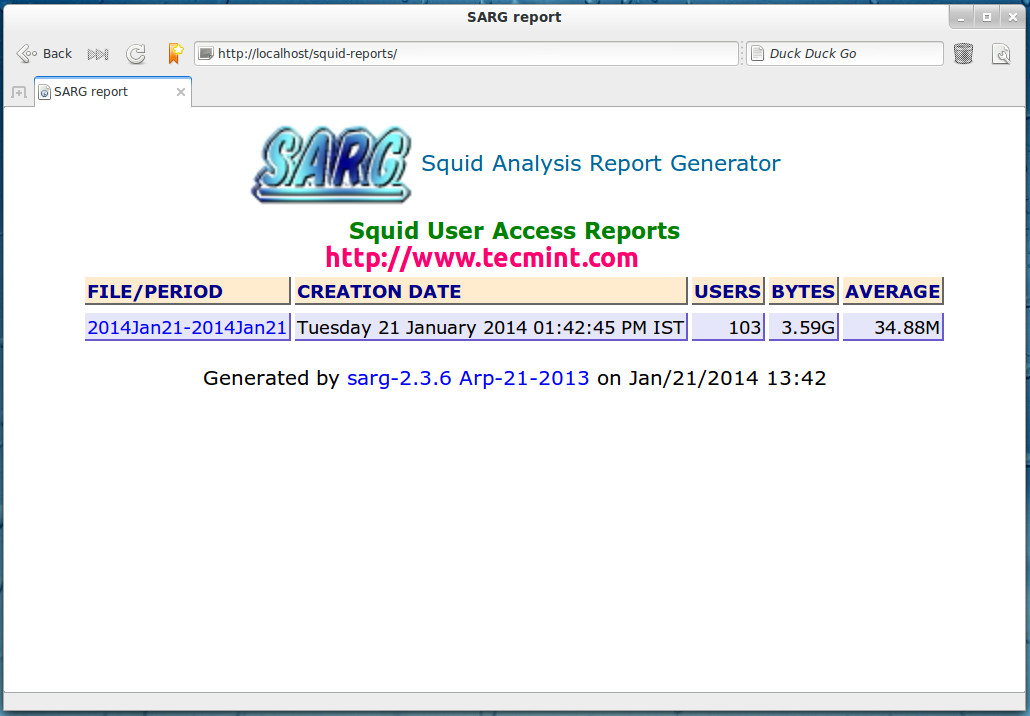
Sarg Main Window
Specific Date
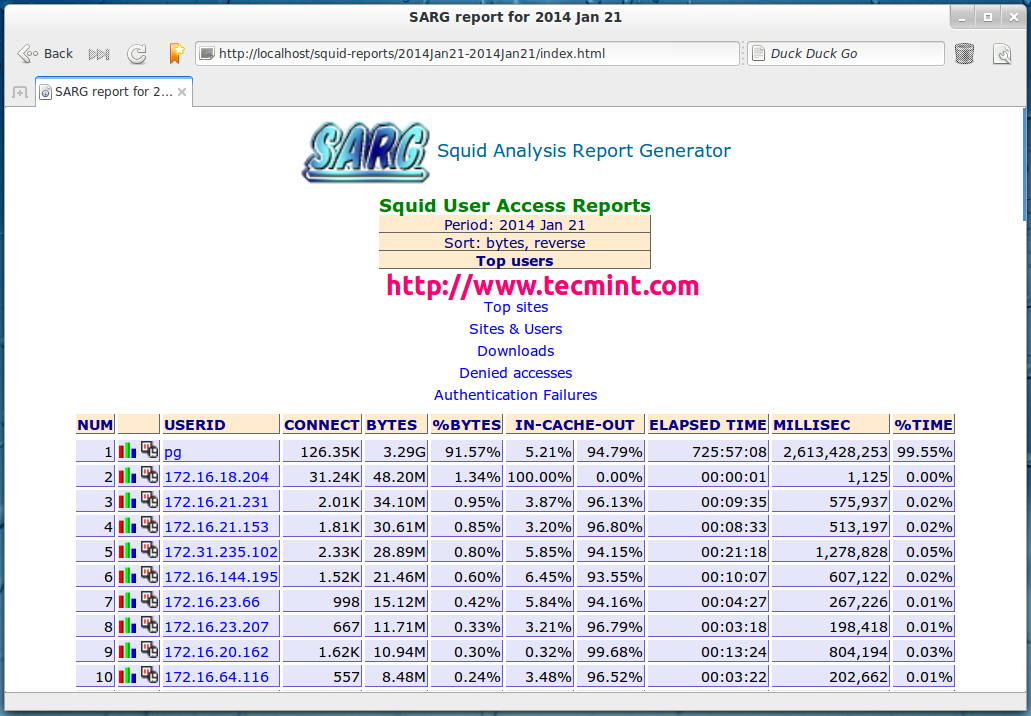
Date Wise Report
User Report
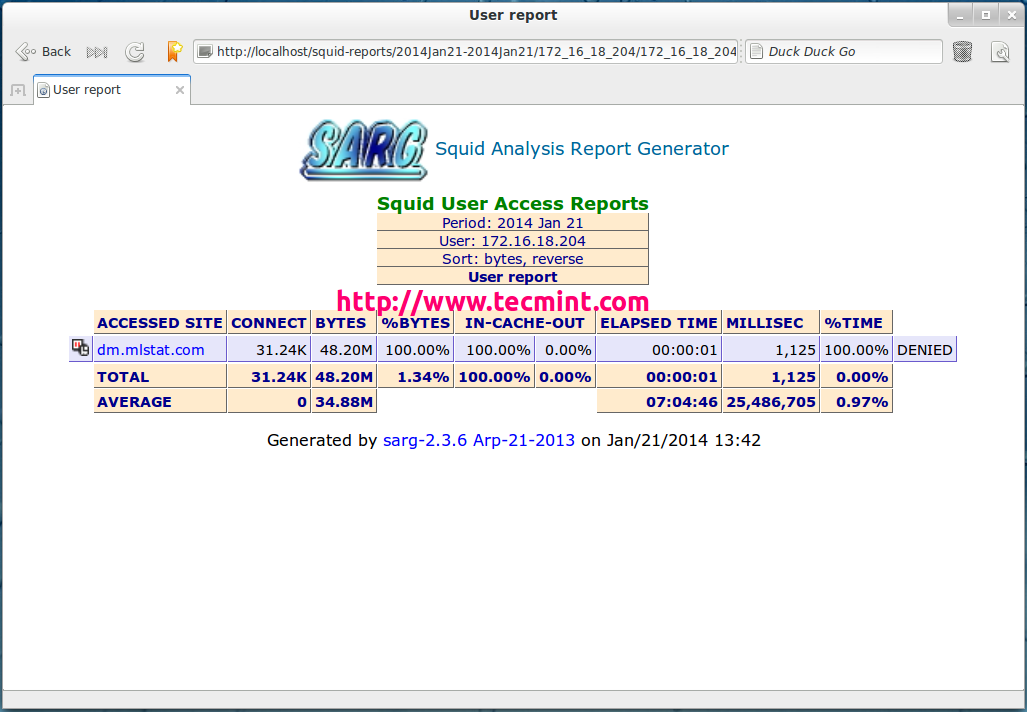
User Bandwidth Report
Top Accessed Sites
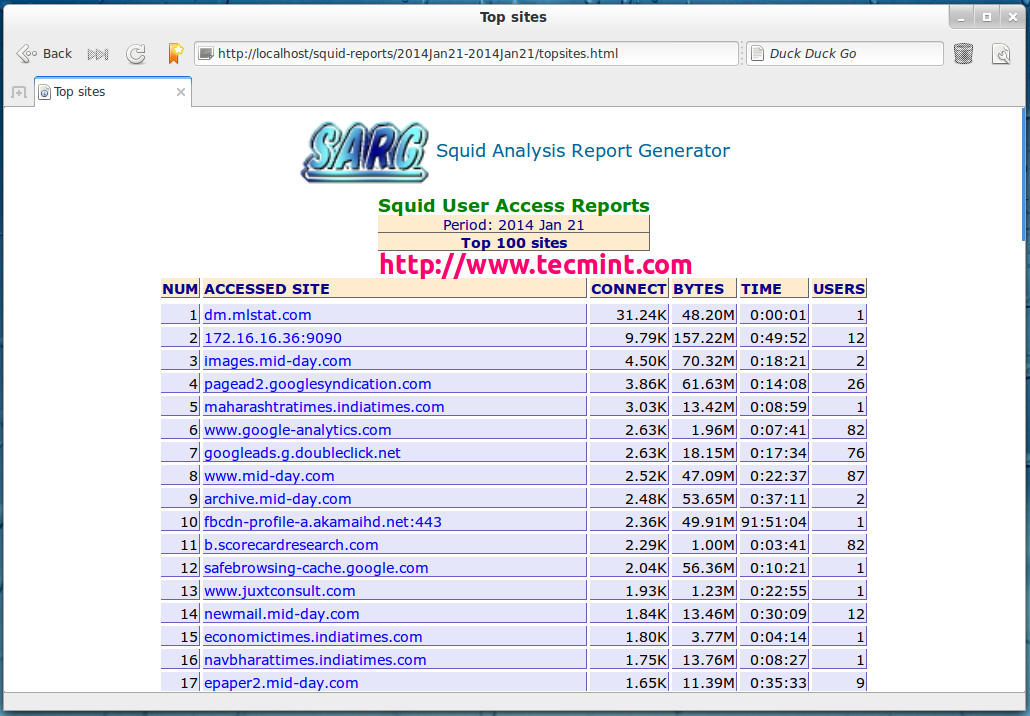
Top Accessed Sites
Top Sites and Users

Top Accessed Sites and Users
Top Downloads
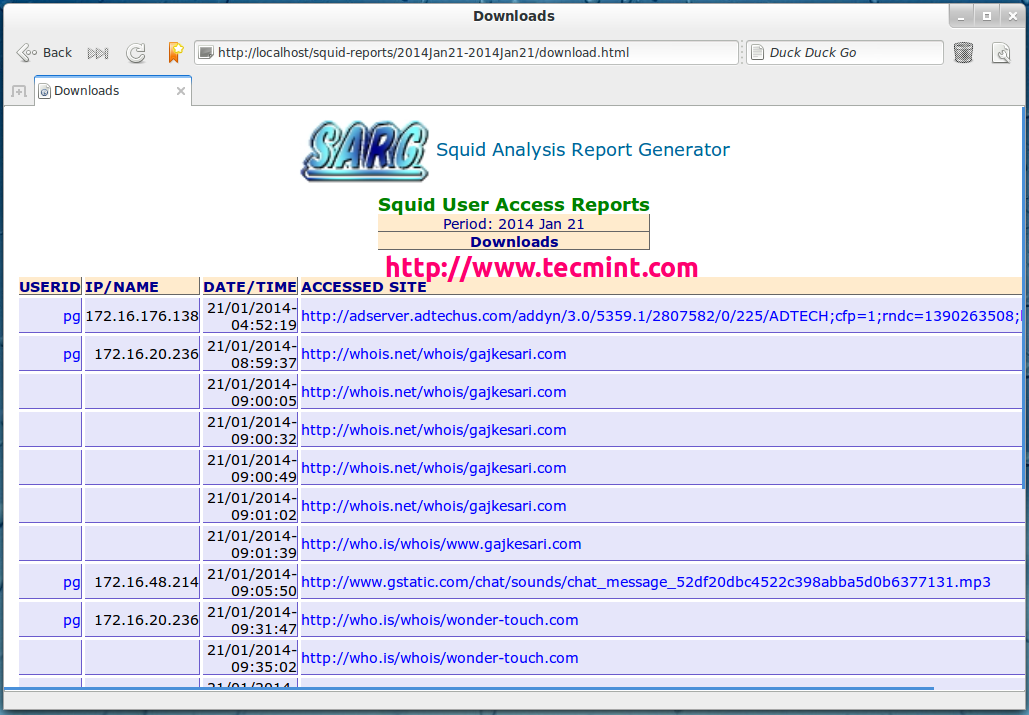
Top Downloads
Denied Access
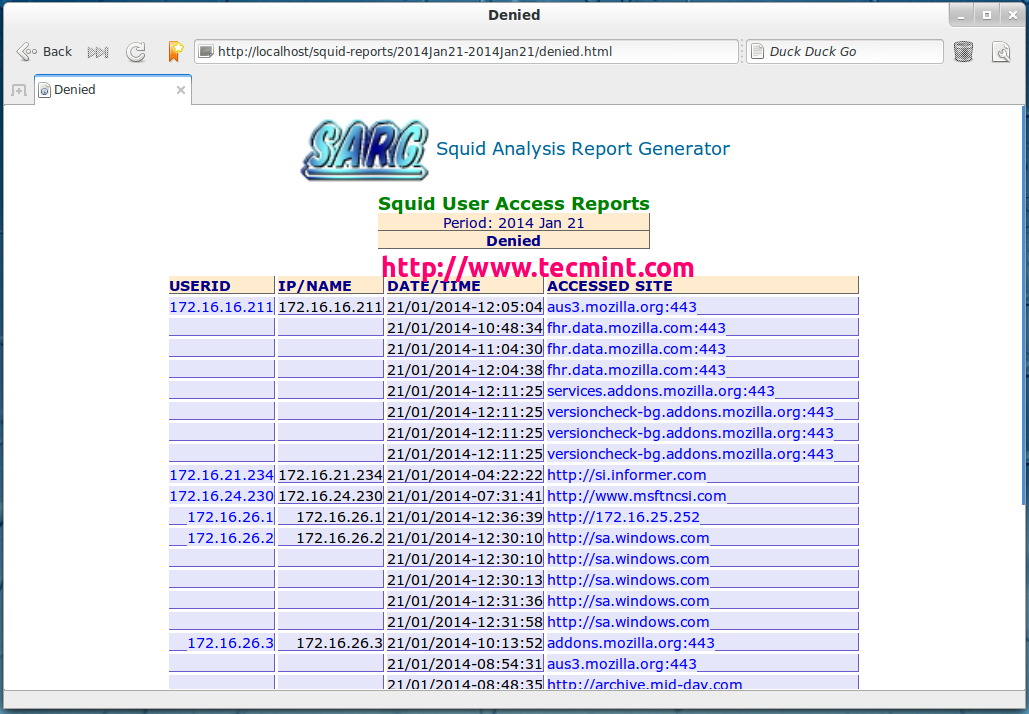
Denied Access Sites
Authentication Failures
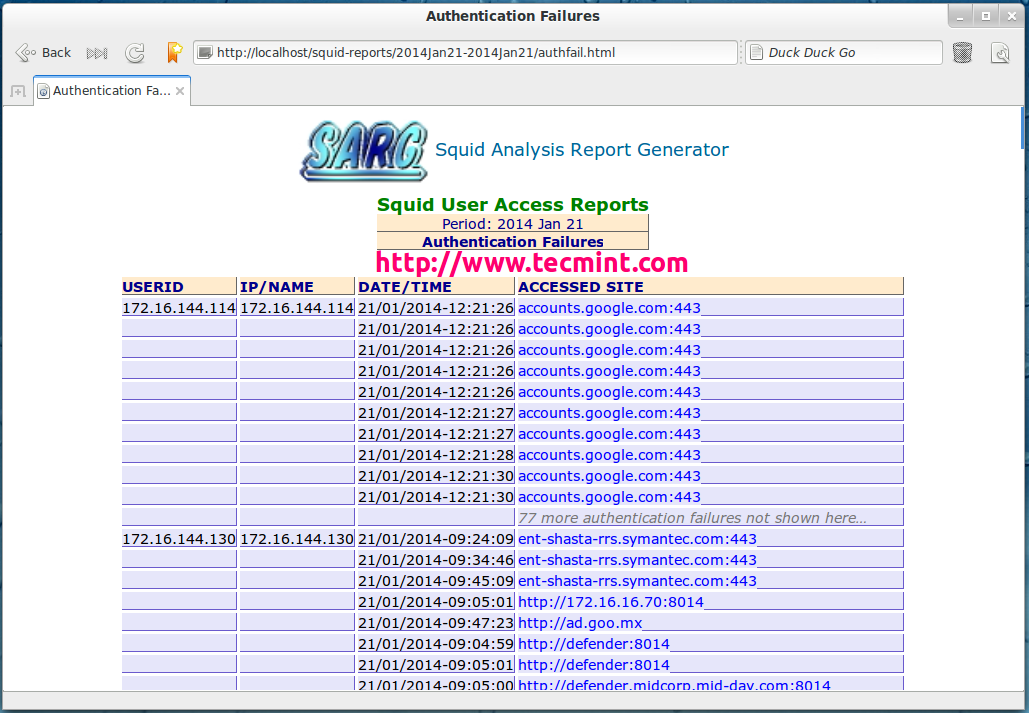
Proxy Authentication Failures
Step 5: Automatic Generating Sarg Report
To automate the process of generating sarg report in given span of time via cron jobs. For example, let’s assume you want to generate reports on hourly basis automatically, to do this, you need to configure a Cron job.
# crontab -e
Next, add the following line at the bottom of the file. Save and close it.
* */1 * * * /usr/local/bin/sarg -x
The above Cron rule will generate SARG report every 1 hour.
Reference Links
That’s it with SARG! I will be coming up with few more interesting articles on Linux, till then stay tuned to TecMint.com and don’t forget to add your valuable comments.