Linux commandline is the best and most powerful thing that fascinates a new user and provides extreme power to experienced users and geeks. For those who work on Server and Production, they are already aware of this fact. It would be interesting to know that Linux console was one of those first features of the kernel that was written by Linus Torvalds way back in the year 1991.
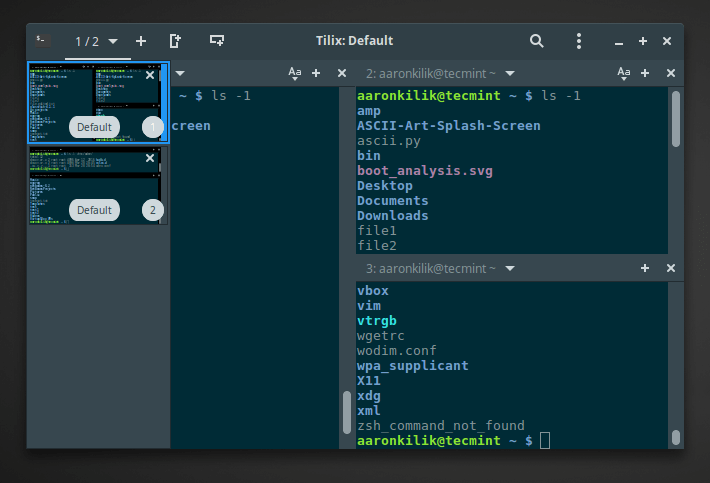
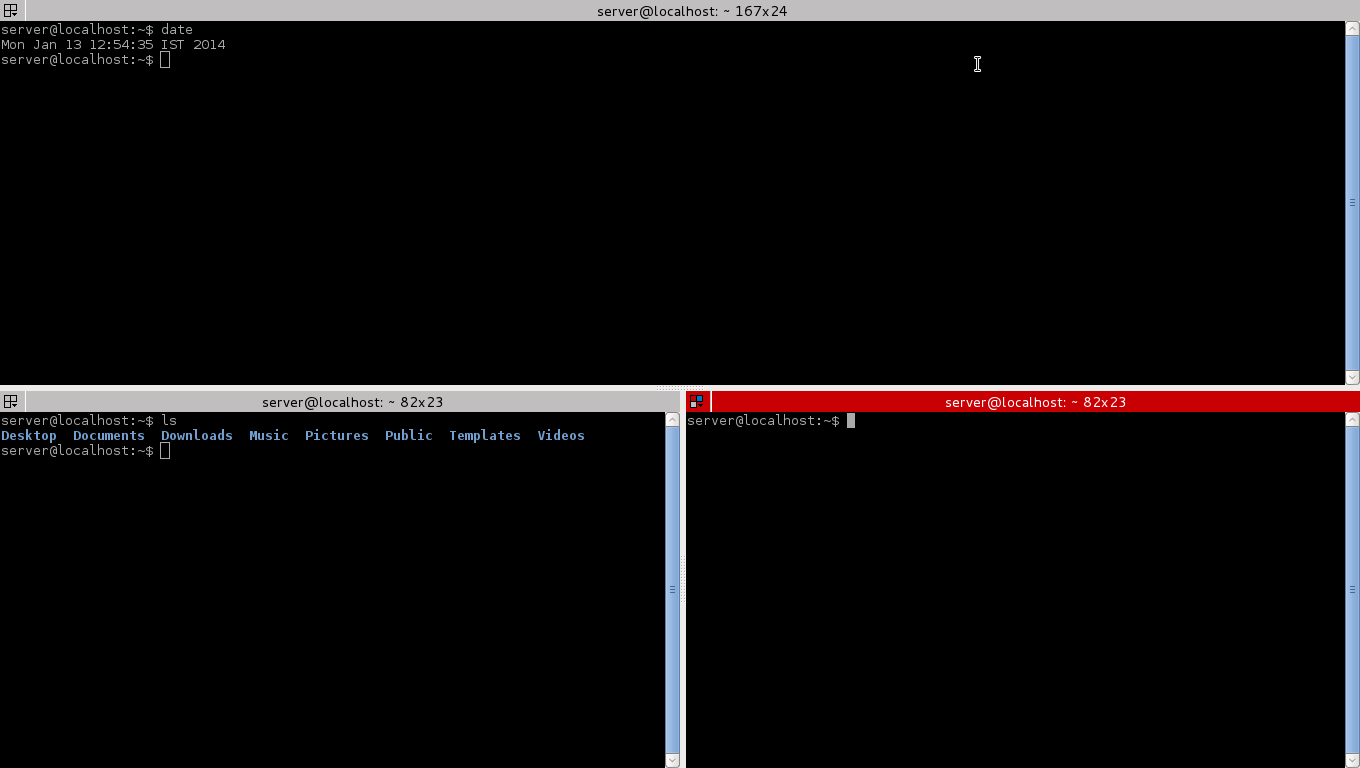
Terminal is a powerful tool that is very reliable as it does not have any movable part. Terminal serves as an intermediate between console and GUI environment. Terminal themselves are GUI application that run on top of a desktop environment. There are a lot of terminal application some of which are Desktop Environment specific and rest are universal. Terminator, Konsole, Gnome-Terminal, Terminology, XFCE terminal, xterm are a few terminal emulators to name.
Last day while surfing web, I came across a terminal namely ‘guake‘ which is a terminal for gnome. Though this is not the first time I have learned about Guake. I’d known this application nearly one year ago but somehow I could not write on this and later it was out of my mind until I heard it again. So finally the article is here. We will be taking you to Guake features, installation on Debian, Ubuntu and Fedora followed by quick testing.
What is Guake?
Guake is a Drop Down Terminal for Gnome Environment. Written from scratch mostly in Python and a little in C this application is released under GPLv2+ and is available for Linux and alike systems. Guake is inspired by a console in computer game Quake which slides down from the top by pressing a specially Key (Default is F12) and then slides-up when the same key is pressed.
Important to mention that Guake is not the first of this kind. Yakuake which stands for Yet Another Kuake, a terminal emulator for KDE Desktop Environment and Tilda which is a GTK+ terminal Emulator are also inspired by the same slide up/down console of computer game Quake.
Features of Guake
- Lightweight
- Simple Easy and Elegant
- Functional
- Powerful
- Good Looking
- Smooth integration of terminal into GUI
- Appears when you call and disappear once you are done by pressing a predefined hot key
- Support for hotkeys, tabs, background transparency makes it a brilliant application, must for every Gnome User.
- Extremely configurable
- Plenty of color palette included, fixed and recognized
- Shortcut for transparency level
- Run a script when Guake starts via Guake Preferences.
- Able to run on more than one monitor
Guake 0.7.0 was released recently, which brings numerous fixes as well as some new features as discussed above. For complete Guake 0.7.0 changelog and source tarball packages can be found Here.
Installing Guake Terminal in Linux
If you are interested in compiling Guake from source you may download the source from the link above, build it yourself before installing.
However Guake is available to be installed on most of the distributions from repository or by adding an additional repository. Here, we will be installing Guake on Debian, Ubuntu, Linux Mint and Fedora systems.
First get the latest software package list from the repository and then install Guake from the default repository as shown below.
---------------- On Debian, Ubuntu and Linux Mint ----------------
$ sudo apt-get update
$ apt-get install guake
---------------- On Fedora 19 Onwards ----------------
# yum update
# yum install guake
After installation, start the Guake from another terminal as:
$ guake
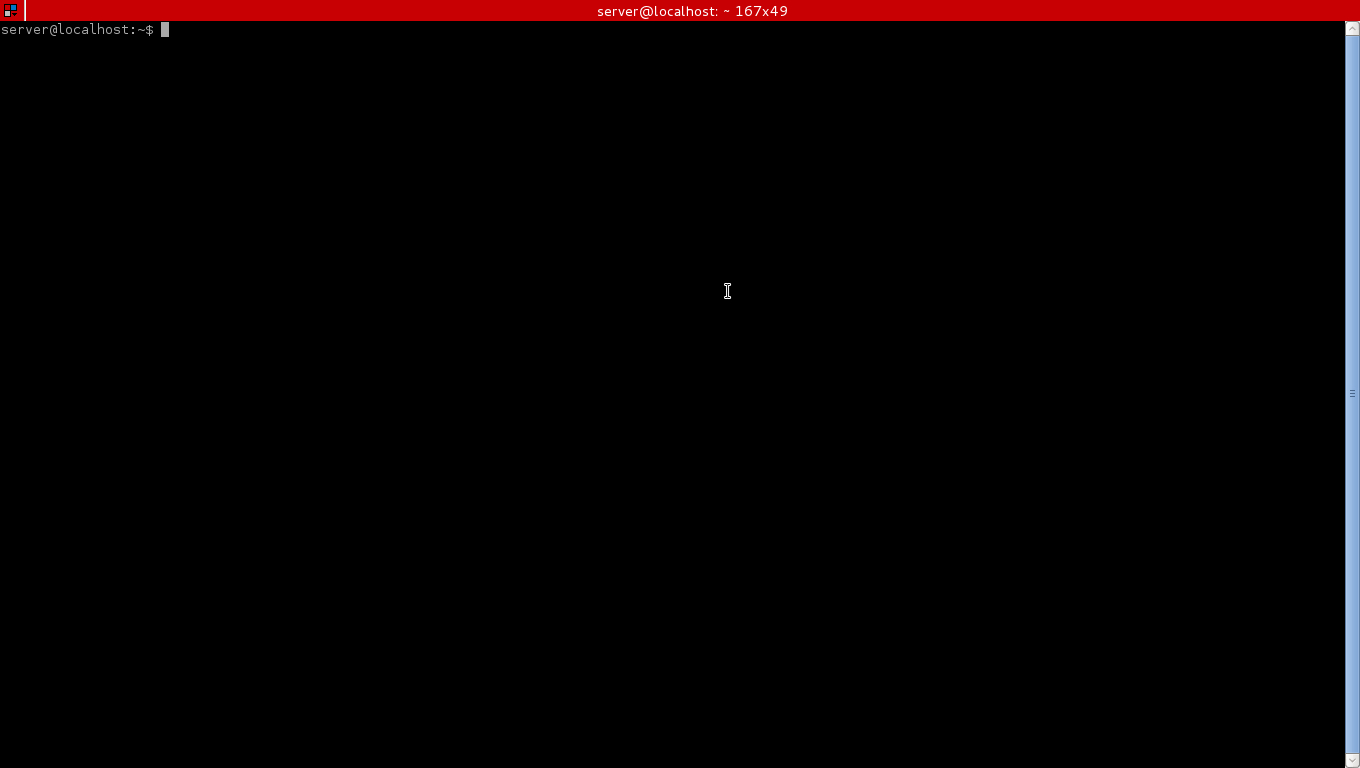
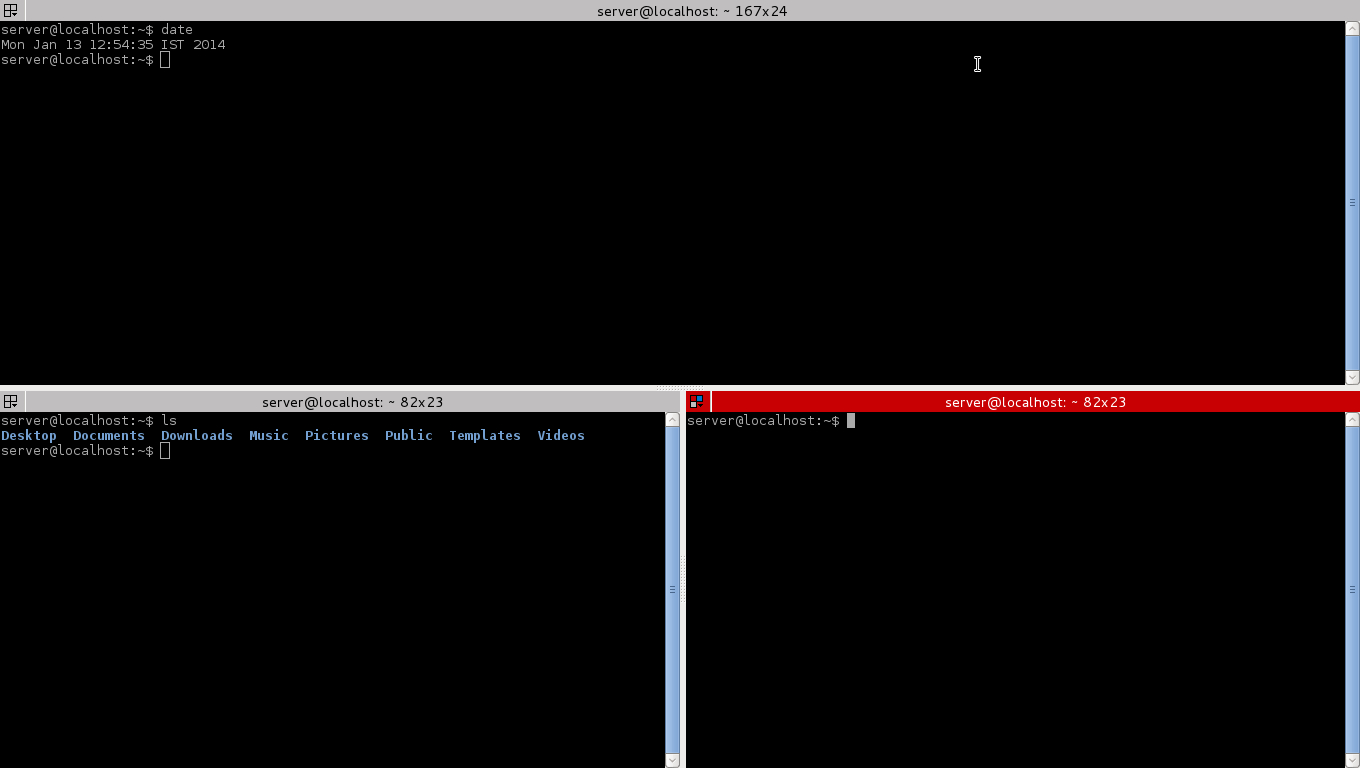
After starting it, use F12 (Default) to roll down and roll up the terminal on your Gnome Desktop.
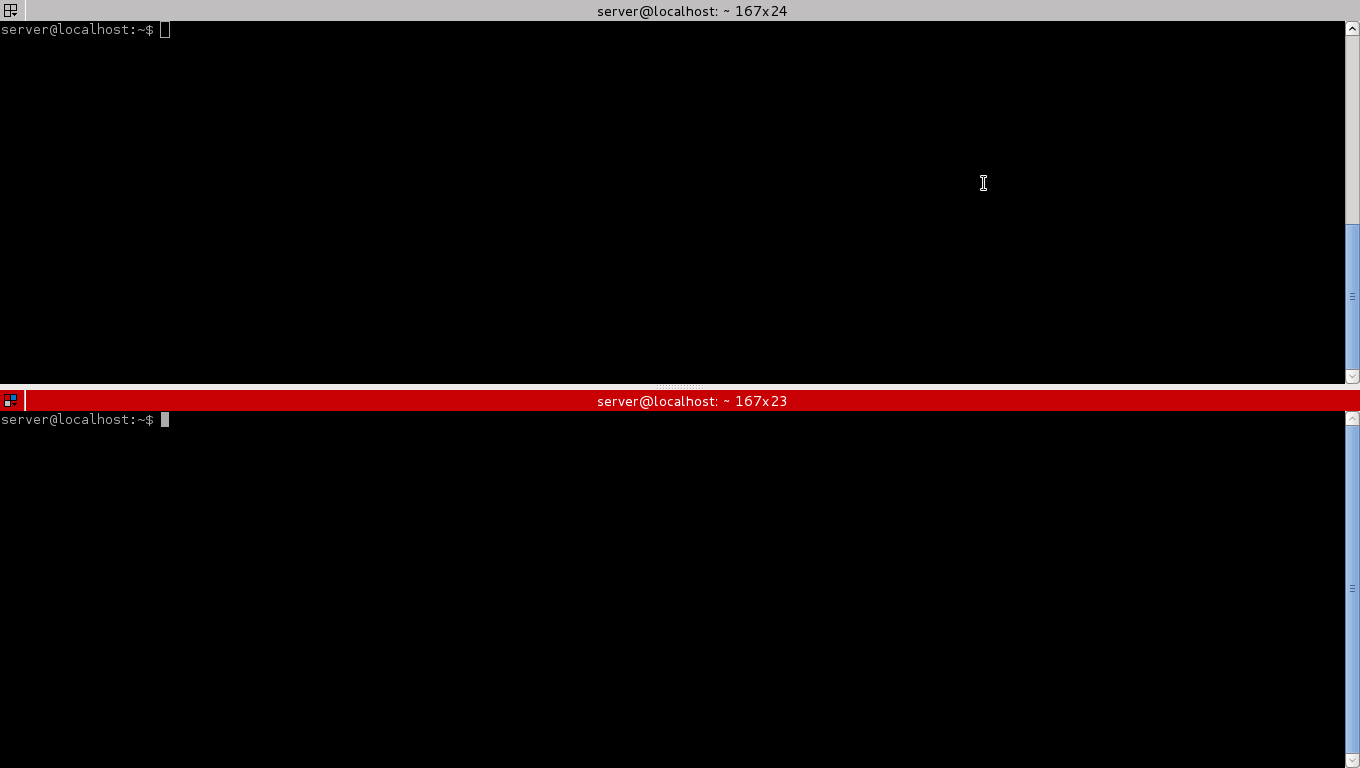
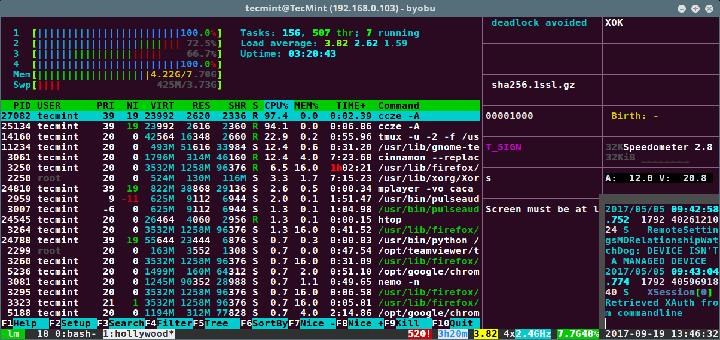
Seems very beautiful specially the transparent background. Roll down… Roll up… Roll down… Roll up…. run command. Open another tab run command… Roll up… Roll down…

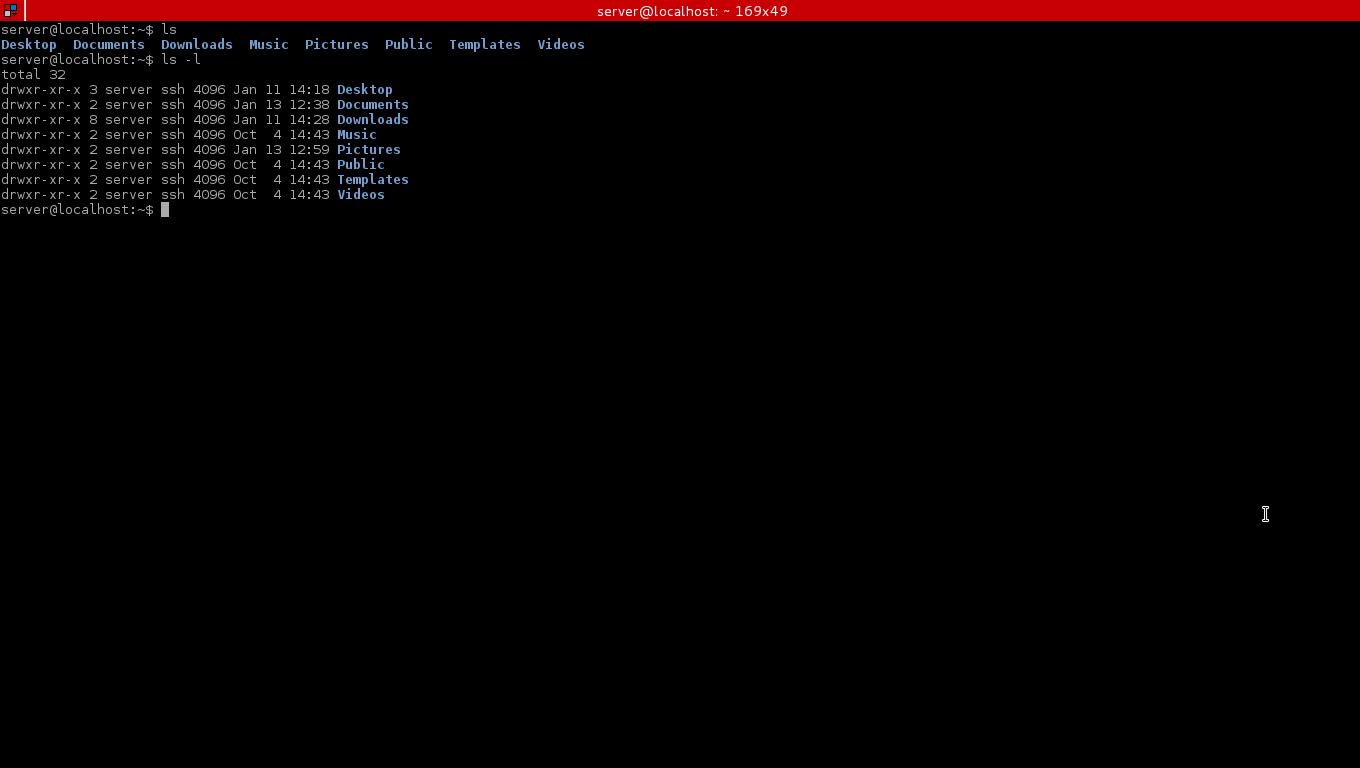
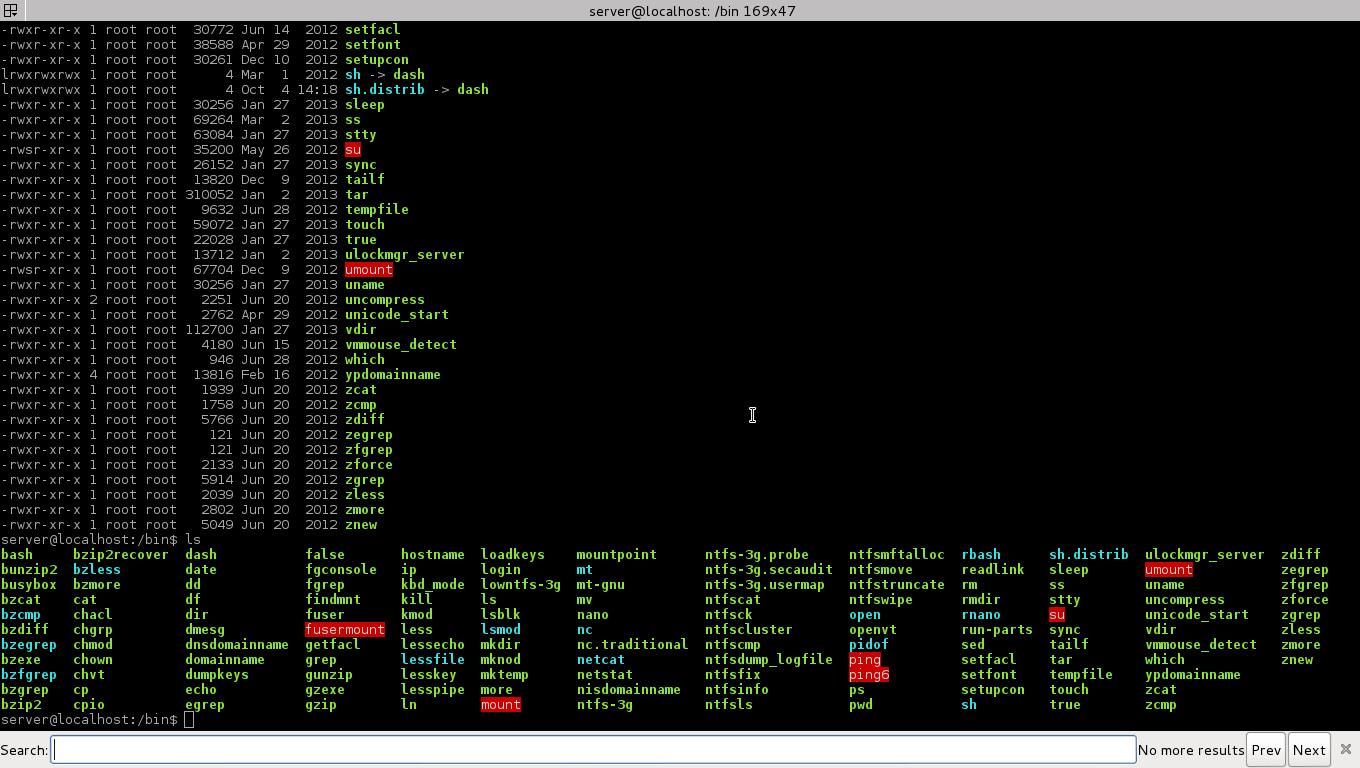
Guake Terminal in Action
If your wallpaper or working windows color don’t match you may like to change your wallpaper or reduce the transparency of the Guake terminal color.
Next is to look into Guake Properties to edit settings as per requirements. Run Guake Preferences either by running it from Application Menu or by running the below command.
$ guake --preferences

Guake Terminal Properties
Scrolling Properties..

Guake Scrolling Settings
Appearance Properties – Here you can modify text and background color as well as tune transparency.

Appearance Properties
Keyboard Shortcuts – Here you may edit and Modify Toggle key for Guage Visibility (default is F12).

Keyboard Shortcuts
Compatibility Setting – Perhaps you won’t need to edit it.

Compatibility Setting
Conclusion
This Project is not too young and not too old, hence has reached certain level of maturity and is quiet solid and works out of the box. For someone like me who need to switch between GUI and Console very often Guake is a boon. I don’t need to manage an extra window, open and close frequently, use tab among a huge pool of opened applications to find terminal or switch to different workspace to manage terminal now all I need is F12.
I think this is a must tool for any Linux user who makes use of GUI and Console at the same time, equally. I am going to recommend it to anyone who want to work on a system where interaction between GUI and Console is smooth and hassle free.
That’s all for now.