gRPC Load Balancing on Kubernetes without Tears

gRPC Load Balancing on Kubernetes without Tears

Many new gRPC users are surprised to find that Kubernetes’s default load
balancing often doesn’t work out of the box with gRPC. For example, here’s what
happens when you take a simple gRPC Node.js microservices
app
and deploy it on Kubernetes:

While the voting service displayed here has several pods, it’s clear from
Kubernetes’s CPU graphs that only one of the pods is actually doing any
work—because only one of the pods is receiving any traffic. Why?

In this blog post, we describe why this happens, and how you can easily fix it
by adding gRPC load balancing to any Kubernetes app with
Linkerd, a CNCF service mesh and service sidecar.

First, let’s understand why we need to do something special for gRPC.

gRPC is an increasingly common choice for application developers. Compared to
alternative protocols such as JSON-over-HTTP, gRPC can provide some significant
benefits, including dramatically lower (de)serialization costs, automatic type
checking, formalized APIs, and less TCP management overhead.

However, gRPC also breaks the standard connection-level load balancing,
including what’s provided by Kubernetes. This is because gRPC is built on
HTTP/2, and HTTP/2 is designed to have a single long-lived TCP connection,
across which all requests are multiplexed—meaning multiple requests can be
active on the same connection at any point in time. Normally, this is great, as
it reduces the overhead of connection management. However, it also means that
(as you might imagine) connection-level balancing isn’t very useful. Once the
connection is established, there’s no more balancing to be done. All requests
will get pinned to a single destination pod, as shown below:

The reason why this problem doesn’t occur in HTTP/1.1, which also has the
concept of long-lived connections, is because HTTP/1.1 has several features
that naturally result in cycling of TCP connections. Because of this,
connection-level balancing is “good enough”, and for most HTTP/1.1 apps we
don’t need to do anything more.

To understand why, let’s take a deeper look at HTTP/1.1. In contrast to HTTP/2,
HTTP/1.1 cannot multiplex requests. Only one HTTP request can be active at a
time per TCP connection. The client makes a request, e.g. GET /foo, and then
waits until the server responds. While that request-response cycle is
happening, no other requests can be issued on that connection.

Usually, we want lots of requests happening in parallel. Therefore, to have
concurrent HTTP/1.1 requests, we need to make multiple HTTP/1.1 connections,
and issue our requests across all of them. Additionally, long-lived HTTP/1.1
connections typically expire after some time, and are torn down by the client
(or server). These two factors combined mean that HTTP/1.1 requests typically
cycle across multiple TCP connections, and so connection-level balancing works.

Now back to gRPC. Since we can’t balance at the connection level, in order to
do gRPC load balancing, we need to shift from connection balancing to request
balancing. In other words, we need to open an HTTP/2 connection to each
destination, and balance requests across these connections, as shown below:

In network terms, this means we need to make decisions at L5/L7 rather than
L3/L4, i.e. we need to understand the protocol sent over the TCP connections.

How do we accomplish this? There are a couple options. First, our application
code could manually maintain its own load balancing pool of destinations, and
we could configure our gRPC client to use this load balancing
pool
. This approach gives
us the most control, but it can be very complex in environments like Kubernetes
where the pool changes over time as Kubernetes reschedules pods. Our
application would have to watch the Kubernetes API and keep itself up to date
with the pods.

Alternatively, in Kubernetes, we could deploy our app as headless
services
.
In this case, Kubernetes will create multiple A
records

in the DNS entry for the service. If our gRPC client is sufficiently advanced,
it can automatically maintain the load balancing pool from those DNS entries.
But this approach restricts us to certain gRPC clients, and it’s rarely
possible to only use headless services.

Finally, we can take a third approach: use a lightweight proxy.

Linkerd is a CNCF-hosted service
mesh
for Kubernetes. Most relevant to our purposes, Linkerd also functions as
a service sidecar, where it can be applied to a single service—even without
cluster-wide permissions. What this means is that when we add Linkerd to our
service, it adds a tiny, ultra-fast proxy to each pod, and these proxies watch
the Kubernetes API and do gRPC load balancing automatically. Our deployment
then looks like this:

Using Linkerd has a couple advantages. First, it works with services written in
any language, with any gRPC client, and any deployment model (headless or not).
Because Linkerd’s proxies are completely transparent, they auto-detect HTTP/2
and HTTP/1.x and do L7 load balancing, and they pass through all other traffic
as pure TCP. This means that everything will just work.

Second, Linkerd’s load balancing is very sophisticated. Not only does Linkerd
maintain a watch on the Kubernetes API and automatically update the load
balancing pool as pods get rescheduled, Linkerd uses an exponentially-weighted
moving average
of response latencies to automatically send requests to the
fastest pods. If one pod is slowing down, even momentarily, Linkerd will shift
traffic away from it. This can reduce end-to-end tail latencies.

Finally, Linkerd’s Rust-based proxies are incredibly fast and small. They
introduce <1ms of p99 latency and require <10mb of RSS per pod, meaning that
the impact on system performance will be negligible.

Linkerd is very easy to try. Just follow the steps in the Linkerd Getting
Started Instructions
—install the
CLI on your laptop, install the control plane on your cluster, and “mesh” your
service (inject the proxies into each pod). You’ll have Linkerd running on your
service in no time, and should see proper gRPC balancing immediately.

Let’s take a look at our sample voting service again, this time after
installing Linkerd:

As we can see, the CPU graphs for all pods are active, indicating that all pods
are now taking traffic—without having to change a line of code. Voila,
gRPC load balancing as if by magic!

Linkerd also gives us built-in traffic-level dashboards, so we don’t even need
to guess what’s happening from CPU charts any more. Here’s a Linkerd graph
that’s showing the success rate, request volume, and latency percentiles of
each pod:

We can see that each pod is getting around 5 RPS. We can also see that, while
we’ve solved our load balancing problem, we still have some work to do on our
success rate for this service. (The demo app is built with an intentional
failure—as an exercise to the reader, see if you can figure it out by
using the Linkerd dashboard!)

If you’re interested in a dead simple way to add gRPC load balancing to your
Kubernetes services, regardless of what language it’s written in, what gRPC
client you’re using, or how it’s deployed, you can use Linkerd to add gRPC load
balancing in a few commands.

There’s a lot more to Linkerd, including security, reliability, and debugging
and diagnostics features, but those are topics for future blog posts.

Want to learn more? We’d love to have you join our rapidly-growing community!
Linkerd is a CNCF project, hosted on GitHub, and has a thriving community
on Slack, Twitter, and the mailing lists. Come and join the fun!

Source

Kubernetes Docs Updates, International Edition

Kubernetes Docs Updates, International Edition

Author: Zach Corleissen (Linux Foundation)

As a co-chair of SIG Docs, I’m excited to share that Kubernetes docs have a fully mature workflow for localization (l10n).

Abbreviations galore

L10n is an abbreviation for localization.

I18n is an abbreviation for internationalization.

I18n is what you do to make l10n easier. L10n is a fuller, more comprehensive process than translation (t9n).

Why localization matters

The goal of SIG Docs is to make Kubernetes easier to use for as many people as possible.

One year ago, we looked at whether it was possible to host the output of a Chinese team working independently to translate the Kubernetes docs. After many conversations (including experts on OpenStack l10n), much transformation, and renewed commitment to easier localization, we realized that open source documentation is, like open source software, an ongoing exercise at the edges of what’s possible.

Consolidating workflows, language labels, and team-level ownership may seem like simple improvements, but these features make l10n scalable for increasing numbers of l10n teams. While SIG Docs continues to iterate improvements, we’ve paid off a significant amount of technical debt and streamlined l10n in a single workflow. That’s great for the future as well as the present.

Consolidated workflow

Localization is now consolidated in the kubernetes/website repository. We’ve configured the Kubernetes CI/CD system, Prow, to handle automatic language label assignment as well as team-level PR review and approval.

Language labels

Prow automatically applies language labels based on file path. Thanks to SIG Docs contributor June Yi, folks can also manually assign language labels in pull request (PR) comments. For example, when left as a comment on an issue or PR, this command assigns the label language/ko (Korean).

/language ko

These repo labels let reviewers filter for PRs and issues by language. For example, you can now filter the k/website dashboard for PRs with Chinese content.

Team review

L10n teams can now review and approve their own PRs. For example, review and approval permissions for English are assigned in an OWNERS file in the top subfolder for English content.

Adding OWNERS files to subdirectories lets localization teams review and approve changes without requiring a rubber stamp approval from reviewers who may lack fluency.

What’s next

We’re looking forward to the doc sprint in Shanghai to serve as a resource for the Chinese l10n team.

We’re excited to continue supporting the Japanese and Korean l10n teams, who are making excellent progress.

If you’re interested in localizing Kubernetes for your own language or region, check out our guide to localizing Kubernetes docs and reach out to a SIG Docs chair for support.

Source

Securing the Base Infrastructure of a Kubernetes Cluster

Securing the Base Infrastructure of a Kubernetes Cluster

The first article in this series Securing Kubernetes for Cloud Native Applications, provided a discussion on why it’s difficult to secure Kubernetes, along with an overview of the various layers that require our attention, when we set about the task of securing that platform.

The very first layer in the stack, is the base infrastructure layer. We could define this in many different ways, but for the purposes of our discussion, it’s the sum of the infrastructure components on top of which Kubernetes is deployed. It’s the physical or abstracted hardware layer for compute, storage, and networking purposes, and the environment in which these resources exist. It also includes the operating system, most probably Linux, and a container runtime environment, such as Docker.

Much of what we’ll discuss, applies equally well to infrastructure components that underpin systems other than Kubernetes, but we’ll pay special attention to those factors that will enhance the security of Kubernetes.

Machines, Data Centers, and the Public Cloud

The adoption of the cloud as the vehicle for workload deployment, whether its public, private, or a hybrid mix, continues apace. And whilst the need for specialist bare-metal server provisioning hasn’t entirely gone away, the infrastructure that underpins the majority of today’s compute resource, is the virtual machine. It doesn’t really matter, however, if the machines we deploy are virtual (cloud-based or otherwise), or physical, the entity is going to reside in a data center, hosted by our own organisation, or a chosen third-party, such as a public cloud provider.

Data centers are complex, and there is a huge amount to think about when it comes to the consideration of security. It’s a general resource for hosting the data processing requirements of an entire organisation, or even, co-tenanted workloads from a multitude of independent organisations from different industries and geographies. For this reason, applying security to the many different facets of infrastructure at this level, tends to be a full-blown corporate or supplier responsibility. It will be governed according to factors such as, national or international regulation (HIPAA, GDPR), industry compliance requirements (PCI DSS), and often results in the pursuit of certified standards accreditation (ISO 27001, FIPS).

In the case of a public cloud environment, a supplier can and will provide the necessary adherence to regulatory and compliance standards at the infrastructure layer, but at some point, it comes down to the service consumer (you and me), to further build on this secure foundation. It’s a shared responsibility. As a public cloud service consumer, this begs the question, “what should I secure, and how should I go about it?” There are a lot of people with a lot of views on the topic, but one credible entity is the Center for Internet Security (CIS), a non-profit organisation dedicated to safeguarding public and private entities from the threat of malign cyber activity.

CIS Benchmarks

The CIS provides a range of tools, techniques, and information for combating the potential threat to the systems and data we rely on. CIS Benchmarks, for example, are per-platform best practice configuration guidelines for security, consensually compiled by security professionals and subject matter experts. In recognition of the ever increasing number of organisations embarking on transformation programmes, which involve migration to public and/or hybrid cloud infrastructure, the CIS have made it their business to provide benchmarks for the major public cloud providers. The CIS Amazon Web Services Foundations Benchmark is an example, and there are similar benchmarks for the other major public cloud providers.

These benchmarks provide foundational security configuration advice, covering identity and access management (IAM), ingress and egress, and logging and monitoring best practice, amongst other things. Implementing these benchmark recommendations is a great start, but it shouldn’t be the end of the journey. Each public cloud provider will have their own set of detailed recommended best practices1,2,3, and a lot of benefit can be taken from other expert voices in the domain, such as the Cloud Security Alliance.

Let’s take a moment to look at a typical cloud-based scenario that requires some careful planning from a security perspective.

Cloud Scenario: Private vs. Public Networks

How can we balance the need to keep a Kubernetes cluster secure by limiting access, whilst enabling the required access for external clients via the Internet, and also from within our own organisation?

  • Use a private network for the machines that host Kubernetes – ensure that the host machines that represent the cluster’s nodes don’t have public IP addresses. Removing the ability to make a direct connection with any of the host machines, significantly reduces the available options for attack. This simple precaution provides significant benefits, and would prevent the kind of compromises that result in the exploitation of compute resource for cryptocurrency mining, for example.
  • Use a bastion host to access the private network – external access to the host’s private network, which will be required to administer the cluster, should be provided via a suitably configured bastion host. The Kubernetes API will often also be exposed in a private network behind the bastion host. It may also be exposed publicly, but it is recommended to at least restrict access by whitelisting IP addresses from an organization’s internal network and/or its VPN server.
  • Use VPC peering with internal load balancers/DNS – where workloads running in a Kubernetes cluster with a private network, need to be accessed by other private, off-cluster clients, the workloads can be exposed with a service that invokes an internal load balancer. For example, to have an internal load balancer created in an AWS environment, the service would need the following annotation: service.beta.kubernetes.io/aws-load-balancer-internal: 0.0.0.0/0. If clients reside in another VPC, then the VPCs will need to be peered.
  • Use an external load balancer with ingress – workloads are often designed to be consumed by anonymous, external clients originating from the Internet; how is it possible to allow traffic to find the workloads in the cluster, when it’s deployed to a private network? We can achieve this in a couple of different ways, depending on the requirement at hand. The first option would be to expose workloads using a Kubernetes service object, which would result in the creation of an external cloud load balancer service (e.g. AWS ELB) on a public subnet. This approach can be quite costly, as each service exposed invokes a dedicated load balancer, but may be the preferred solution for non-HTTP services. For HTTP-based services, a more cost effective approach would be to deploy an ingress controller to the cluster, fronted by a Kubernetes service object, which in turn creates the load balancer. Traffic addressed to the load balancer’s DNS name is routed to the ingress controller endpoint(s), which evaluates the rules associated with any defined ingress objects, before further routing to the endpoints of the services in the matched rules.

This scenario demonstrates the need to carefully consider how to configure the infrastructure to be secure, whilst providing the capabilities required for delivering services to their intended audience. It’s not a unique scenario, and there will be other situations that will require similar treatment.

Locking Down the Operating System and Container Runtime

Assuming we’ve investigated and applied the necessary security configuration to make the machine-level infrastructure and its environment secure, the next task is to lock down the host operating system (OS) of each machine, and the container runtime that’s responsible for managing the lifecycle of containers.

Linux OS

Whilst it’s possible to run Microsoft Windows Server as the OS for Kubernetes worker nodes, more often than not, the control plane and worker nodes will run a variant of the Linux operating system. There might be many factors that govern the choice of Linux distribution to use (commercials, in-house skills, OS maturity), but if its possible, use a minimal distribution that has been designed just for the purpose of running containers. Examples include CoreOS Container Linux, Ubuntu Core, and the Atomic Host variants. These operating systems have been stripped down to the bare minimum to facilitate running containers at scale, and as a consequence, have a significantly reduced attack surface.

Again, the CIS have a number of different benchmarks for different flavours of Linux, providing best practice recommendations for securing the OS. These benchmarks cover what might be considered the mainstream distributions of Linux, such as RHEL, Ubuntu, SLES, Oracle Linux and Debian. If your preferred distribution isn’t covered, there is a distribution independent CIS benchmark, and there are often distribution-specific guidelines, such as the CoreOS Container Linux Hardening Guide.

Docker Engine

The final component in the infrastructure layer is the container runtime. In the early days of Kubernetes, there was no choice available; the container runtime was necessarily the Docker engine. With the advent of the Kubernetes Container Runtime Interface, however, it’s possible to remove the Docker engine dependency in favour of a runtime such as CRI-O, containerd or Frakti.4 In fact, as of Kubernetes version 1.12, an alpha feature (Runtime Class) allows for running multiple container runtimes, side-by-side in a cluster. Whichever container runtimes are deployed, they need securing.

Despite the varied choice, the Docker engine remains the default container runtime for Kubernetes (although this may change to containerd in the near future), and we’ll consider its security implications here. It’s built with a large number of configurable security settings, some of which are turned on by default, but which can be bypassed on a per-container basis. One such example is the whitelist of Linux kernel capabilities applied to each container on creation, which helps to diminish the privileges available inside a running container.

Once again, the CIS maintain a benchmark for the Docker platform, the CIS Docker Benchmark. It provides best practice recommendations for configuring the Docker daemon for optimal security. There’s even a handy open source tool (script) called Docker Bench for Security, that can be run against a Docker engine, which evaluates the system for conformance to the CIS Docker Benchmark. The tool can be run periodically to expose any drift from the desired configuration.

Some care needs to be taken when considering and measuring the security configuration of the Docker engine when it’s used as the container runtime for Kubernetes. Kubernetes ignores much of the available functions of the Docker daemon, in preference of its own security controls. For example, the Docker daemon is configured to apply a default whitelist of available Linux kernel system calls to every created container, using a seccomp profile. Unless specified, Kubernetes will instruct Docker to create pod containers ‘unconfined’ from a seccomp perspective, giving containers access to each and every syscall available. In other words, what may get configured at the lower ‘Docker layer’, may get undone at a higher level in the platform stack. We’ll cover how to mitigate these discrepancies with security contexts, in a future article.

Summary

It might be tempting to focus all our attention on the secure configuration of the Kubernetes components of a platform. But as we’ve seen in this article, the lower layer infrastructure components are equally important, and are ignored at our peril. In fact, providing a secure infrastructure layer can even mitigate problems we might introduce in the cluster layer itself. Keeping our nodes private, for example, will prevent an inadequately secured kubelet from being exploited for nefarious purposes. Infrastructure components deserve the same level of attention, as the Kubernetes components, themselves.

In the next article, we’ll move on to discuss the implications of securing the next layer in the stack, the Kubernetes cluster components.

Source

Heptio will be joining forces with VMware on a shared cloud native mission

Today we are incredibly excited to announce that Heptio will be acquired by VMware. It is a watershed day for our company, and we hope for the industry as a whole. The inevitable question is … why have we decided to join forces (now)?

Life at Heptio has been pretty exceptional since we founded the company two years ago. In a short period, we have made strong contributions in the Kubernetes and cloud native ecosystem, assembled a remarkable team and onboarded some of the most prestigious enterprises as customers. We were incredibly well capitalized and supported by our investors. So what gives?

Shared vision.

Heptio’s mission is to build a platform that accelerates IT in a multi-cloud world. We are on the precipice of a major transformation—the de-coupling of applications from the environments where they are run. And we feel a responsibility to help organizations navigate this transformation to true cloud native architecture. To realize the greatest possible impact, Heptio would need access to an entirely different level of resources and execution capabilities than we have today.

Who is best positioned to lead this transformation? The company that led a parallel transformation—the software defined data center. VMware. They have experience, execution muscle, customer trust and full leadership commitment.

When we first started conversations with VMware, the alignment of our respective visions was uncanny. With virtualization, VMware helped enterprises change the way their infrastructure operates. VMware values our products and services—together we can apply these technologies to change the way business operates, and where they run their applications.

Customer Value.

We live in a really interesting time. Enterprise companies are dealing with waves of disruption in the software space, and increasingly fragmented and complicated hosting environments. Kubernetes has an important role to play as a ubiquitous, uniform framework—to be as available and invisible as a utility, like electricity. We believe that an enterprise should pick their infrastructure hosting environment based solely on pragmatic attributes: cost economics, data locality and sovereignty, and connectivity to the consumers and workloads they support.

The value for enterprises is not the electricity, nor the vehicle through which it is delivered; value is created when applications are plugged in. The missing piece is a control plane that shapes the experience in deploying and accessing cloud native technologies. It must address day 2 challenges, integrating technologies into a practical enterprise environment, and instituting policies and management capabilities. It is going to take a hard push from an engaged, enterprise-friendly company to make it real. We are convinced that VMware possesses the ability and commitment to create a platform that works everywhere and meets the unique needs of enterprises. Together we can change the game.

Community Connection

From the start, Heptio has maintained a healthy relationship with the open source community. We’re tied into the Kubernetes steering committee and a number of SIGs, plus our team has shepherded five open source projects (Sonobuoy, Contour, Gimbal, Ark and ksonnet). We feel like the community trusts us. That trust continues to be well placed. The team at VMware have a parallel appreciation for the community; they fully understand the importance of being closely connected to foster more innovation. They have so much energy and resources already focused on this area; the time is right to join forces and accelerate the value delivered to the open source community.

Culture First.

I’ve left culture to the final topic for this post, but the fact that VMware puts its culture first is central to our decision to join their fold. We think a lot about the culture of a company not only as an expression of its values, but as a blueprint for how it creates value in the world. Even before we started conversations with VMware, we were aware of similarities in our culture and core values. We have some great people working at Heptio that ‘grew up’ at VMware—they enjoyed their work and had tremendous respect for their colleagues. This made us feel good about joining them, and instilled confidence that our teams would gel and we could focus our energy on our shared mission.

In Closing.

At Heptio, we’ve often (internally) lamented that we’re not great at celebrating our achievements. But today, we can’t avoid a proper celebration. I’m so proud of our team and what they’ve built in such a compressed time frame, and so grateful to our community for their incredible support. I’m immensely excited to join forces with an organization that shares our mission and that has proved they know how to deliver transformative technology. We’re fired up to have an even bigger impact.

Source

What is a CaaS? Containers as a Service, Defined

When public clouds first began gaining popularity, it seemed that
providers were quick to append the phrase “as a service” to everything
imaginable, as a way of indicating that a given application, service, or
infrastructure component was designed to run in the cloud. It should
therefore come as no surprise that Container as a Service, or CaaS,
refers to a cloud-based container environment. But there is a bit more
to the CaaS story than this. CaaS is not just a marketing fad. Below, I
explain what CaaS means, and why it’s valuable.

CaaS Differentiators

Container as a Service offerings are often about more than just giving
IT pros a way of running their containerized applications in the cloud.
Each cloud provider is free to create its own flavor of CaaS—and some
CaaS platforms don’t run in a major public cloud. There are two main
areas in which CaaS providers try to differentiate their offerings.
First, there is the user interface. On-premises container environments
tend to be managed through the Docker command line. However, some IT
pros prefer a GUI-based management interface over the command line. As
such, some cloud providers allow subscribers to point-and-click their
way through container creation and management. A second key
differentiator between CaaS providers is orchestration, and the
supplementary services that are attached to the orchestration engine. A
provider may use an orchestration engine, for example, to achieve
automatic scaling for containerized workloads, based on the parameters
that the administrator has established. Similarly, a cloud provider’s
orchestration engine may be used to handle container lifecycle
management tasks, or the creation of container-related reports. It is
worth noting that public cloud container services can be somewhat rigid
with regard to orchestrator selection. Microsoft Azure, for example,
allows you to choose between DC/OS, Kubernetes, and Swarm. No other
selections are available. In contrast, other container management
platforms, such as Rancher, are designed to be modular rather than
limiting you to using a few pre-defined choices.

The Advantages of Using CaaS

Many of the advantages that CaaS brings to the table are similar to the
benefits of general container usage. However, there are at least two
extra benefits that CaaS provides. The first of these benefits is that
CaaS makes it much easier to run applications in the cloud than it might
otherwise be. Applications that were designed for on-premises use do not
always behave as expected when installed on a cloud-based virtual
machine. Because containers allow for true application portability,
however, it is possible to create an application container, test the
newly containerized application on-premises, and then upload the
application to the public cloud. The containerized application should
work in the same way in the cloud as it does on-premises. Another
advantage to using CaaS is that doing so allows organizations to achieve
a greater degree of agility. Agility is one of those overused IT
buzzwords that has kind of lost its meaning. However, I tend to think of
agility as the ability to roll out a new production workload as quickly
as possible. Given this definition, CaaS definitely delivers. Imagine
for a moment that an organization’s development staff is building a new
application, and that there is a pressing need for the application to be
rolled out quickly. The developers could containerize the application,
but what if the organization is not yet using containers in production?
Better still, what happens if the organization’s container environment
lacks the capacity to host the application? This is where CaaS really
shines. Public cloud providers usually let you deploy a container
environment with just a few mouse clicks. This eliminates time-consuming
tasks such as deploying container hosts, building clusters, or testing
the container infrastructure. Cloud providers use automation to
provision for their subscribers’ container environments that have been
proven to be configured correctly. This automation eliminates the
time-consuming setup and testing process, and therefore allows the
organization to begin rolling out containerized applications almost
immediately.

Multi-Cloud Solutions

Although it is tempting to think of CaaS as solely being a service that
a cloud provider offers to its customers, it is becoming increasingly
common for organizations to host containers on multiple clouds. Doing so
can help with resilience to failure, and with load balancing. Yet
hosting containers on multiple clouds also introduces significant
challenges related to cross-cloud container management, and cross-cloud
workload scaling. These challenges can be addressed by using management
tools such as those from Rancher, which can
manage containers both on-premises and in the cloud. Brien Posey is a
Fixate IO contributor, and a 16-time Microsoft MVP with over two decades
of IT experience. Prior to going freelance, Brien was CIO for a national
chain of hospitals and healthcare facilities. He also served as lead
network engineer for the United States Department of Defense at Fort
Knox. Brien has also worked as a network administrator for some of the
largest insurance companies in America. In addition to his continued
work in IT, Brien has spent the last three years training as a
Commercial Scientist-Astronaut Candidate for a mission to study polar
mesospheric clouds from space. You can follow Posey’s spaceflight
training at www.brienposey.com/space.

Source

Getting Started with GKE | Rancher Labs

Google Container Engine, or GKE for short (the K stands for Kubernetes),
is Google’s offering in the space of Kubernetes runtime deployments.
When used in conjunction with a couple of other components from the
Google Cloud Platform, GKE provides a one-stop shop for creating your
own Kubernetes environment, on which you can deploy all of the
containers and pods that you wish without having to worry about managing
Kubernetes masters and capacity. This article outlines how GKE works and
how to get up and running with GKE.

Background: Google and Kubernetes

Google founded the Kubernetes open source project based on some existing
code from its infrastructure, which has been built and refined using
Google’s lessons learned from running their entire platform on
containers well before Docker standardized the format, which sparked
mass adoption. With everything from ads and search to mail running in
containers, Google rightly predicted that management and orchestration
would be key to containers’ success in the marketplace.

Key Benefits of Google Container Engine

GKE has a number of features that take advantage not only of Kubernetes,
but also the rest of the Google Cloud Platform.

Its key features include:

  • Security is handled by the Google security team.
  • Compliance with HIPAA and PCI DSS is already managed.
  • Kubernetes instances are fully clustered, and will auto scale.
  • It’s based on the upstream Kubernetes project, which enables
    workload portability to other Kubernetes instances, whether they are
    another cloud provider or on-premises.

Getting Started with GKE

Following is a primer for getting up and running with GKE.

  1. Log in to the Google Container
    Engine

    page inside the Google Cloud Platform
    console.
  2. Create a project.
  3. Enable billing.
  4. Wait for the services to be set up. Once set up, you can create
    clusters to host applications and services.
  5. On the Create a container cluster screen, you can specify which
    one of Google’s data centers is hosting deployed artifacts.
  6. And you can enable other features, like authorization and automatic
    updates.
  7. GKE now has a functioning Kubernetes cluster you can connect to and
    use as you wish.

GKE Caveats

The single biggest drawback of using GKE for your Kubernetes runtime is
that you are tied to Google’s Cloud Platform. If you wish to use GKE,
but also want to be able to support multiple clouds, an option like
Rancher can be a help. Rancher provides a
unified front end for multiple container orchestration frameworks and
environments, giving you a “single pane of glass” for deploying
containers wherever you need.

Conclusion

If you want to try Kubernetes, or currently use it and want to be able
to scale without needing all the expertise in-house, GKE is a fantastic
single-cloud solution for running Kubernetes. Many companies never get
to the point of having a single cloud provider as a feasible option, but
using a product like Rancher allows a company to leverage existing
investment and expand to other cloud providers according to the dictates
of customer demand.

Source

Comparing 10 Container Monitoring Solutions for Rancher

Learn How Rancher 2.0 Solves Enterprise Kubernetes Challenges

Understand the comparitive advantage of Rancher 2.0 for DevOps teams, IT Admins, and Operations.

Read the Report

Container monitoring environments come in all shapes and sizes. Some are open source while others are commercial. Some are in the Rancher Catalog while others require manual configuration. Some are general purpose while others are aimed specifically at container environments. Some are hosted in the cloud while others require installation on own cluster hosts. In this post, I take an updated look at 10 container monitoring solutions. This effort builds on earlier work including Ismail Usman’s
Comparing 7 Monitoring Options for Docker from 2015 and The Great Container Monitoring Bake Off Meetup in October of 2016. The number of monitoring solutions is daunting. New solutions are coming on the scene continuously, and existing solutions evolve in functionality. Rather than looking at each solution in depth, I’ve taken the approach of drawing high-level comparisons. With this approach, readers can hopefully “narrow the list” and do more serious
evaluations of solutions best suited to their own needs.

The monitoring solutions covered here include:

In the following sections, I suggest a framework for comparing monitoring solutions, present a high-level comparison of each, and then discuss each solution in more detail by addressing how each solution works with Rancher. I also cover a few additional solutions you may have come across that did not make my top 10.

A Framework for Comparison

A challenge with objectively comparing monitoring solutions is that architectures, capabilities, deployment models, and costs can vary widely. One solution may extract and graph Docker-related metrics from a single host while another aggregates data from many hosts, measures application response times, and sends automated alerts under particular conditions. Having a framework is useful when comparing solutions. I’ve somewhat arbitrarily proposed the following tiers of functionality that most monitoring solutions have in common as a basis for my comparison. Like any self-respecting architectural stack, this one has seven layers.

Figure 1: A seven-layer model for comparing monitoring solutions

  • Host Agents – The host agent represents the “arms and legs” of the monitoring solution, extracting time-series data from various sources like APIs and log files. Agents are usually installed on each cluster host (either on-premises or cloud-resident) and are themselves often packaged as Docker containers for ease of deployment and management.
  • Data gathering framework – While single-host metrics are sometimes useful, administrators likely need a consolidated view of all hosts and applications. Monitoring solutions typically have some mechanism to gather data from each host and persist it in a shared data store.
  • Datastore – The datastore may be a traditional database, but more commonly it is some form of scalable, distributed database optimized for time-series data comprised of key-value pairs. Some solutions have native datastores while others leverage pluggable open-source datastores.
  • Aggregation engine – The problem with storing raw metrics from dozens of hosts is that the amount of data can become overwhelming. Monitoring frameworks often provide data aggregation capabilities, periodically crunching raw data into consolidated metrics (like hourly or daily summaries), purging old data that is no longer needed, or re-factoring data in some fashion to support anticipated queries and analysis.
  • Filtering & Analysis – A monitoring solution is only as good as the insights you can gain from the data. Filtering and analysis capabilities vary widely. Some solutions support a few pre-packaged queries presented as simple time-series graphs, while others have customizable dashboards, embedded query languages, and sophisticated analytic functions.
  • Visualization tier – Monitoring tools usually have a visualization tier where users can interact with a web interface to generate charts, formulate queries and, in some cases, define alerting conditions. The visualization tier may be tightly coupled with the filtering and analysis functionality, or it may be separate depending on the solution.
  • Alerting & Notification – Few administrators have time to sit and monitor graphs all day. Another common feature of monitoring systems is an alerting subsystem that can provide notification if pre-defined thresholds are met or exceeded.

Beyond understanding how each monitoring solution implements the basic capabilities above, users will be interested in other aspects of the monitoring solution as well:

  • Completeness of the solution
  • Ease of installation and configuration
  • Details about the web UI
  • Ability to forward alerts to external services
  • Level of community support and engagement (for open-source projects)
  • Availability in Rancher Catalog
  • Support for monitoring non-container environments and apps
  • Native Kubernetes support (Pods, Services, Namespaces, etc.)
  • Extensibility (APIs, other interfaces)
  • Deployment model (self-hosted, cloud)
  • Cost, if applicable

Comparing Our 10 Monitoring Solutions

The diagram below shows a high-level view of how our 10 monitoring solutions map to our seven-layer model, which components implement the capabilities at each layer, and where the components reside. Each framework is complicated, and this is a simplification to be sure, but it provides a useful view of which component does what. Read on for
additional detail.

Figure 2 – 10 monitoring solutions at a glance Additional attributes of each monitoring solution are presented in a summary fashion below. For some solutions, there are multiple deployment options, so the comparisons become a little more nuanced.

Looking at Each Solution in More Depth
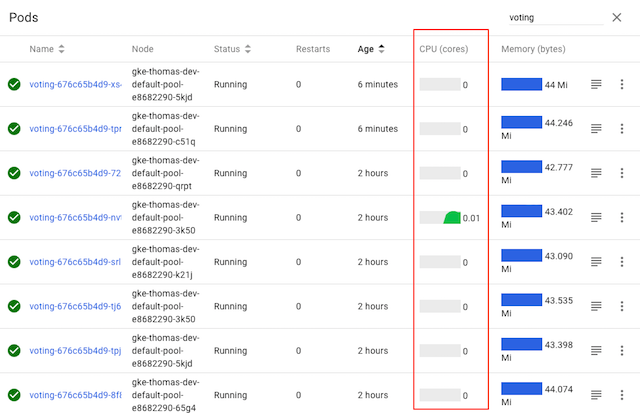
Docker Stats

docker stats
At the most basic level, Docker provides built-in command monitoring for Docker
hosts via the docker stats command. Administrators can query the Docker daemon and obtain detailed, real-time information about container resource consumption metrics, including CPU and memory usage, disk and network I/O, and the number of running processes. Docker stats leverages the Docker Engine API to retrieve this information. Docker stats has no notion of history, and it can only monitor a single host, but clever administrators can write scripts to gather metrics from multiple hosts. Docker stats is of limited use on its own, but docker stats data can be combined with other data sources like Docker log files and docker events to feed higher level monitoring services. Docker only knows about metrics reported by a single host, so Docker stats is of limited use monitoring Kubernetes or Swarm clusters with multi-host application services. With no visualization interface, no aggregation, no datastore, and no ability to collect data from multiple hosts, Docker stats does not fare well against our seven-layer model. Because Rancher runs on Docker, basic docker stats functionality is automatically available to Rancher users.

cAdvisor

cAdvisor (container advisor) is an open-source project that like Docker stats provides users with resource usage information about running containers. cAdvisor was originally developed by Google to manage its lmctfy containers, but it now supports Docker as well. It is implemented as a daemon process that collects, aggregates, processes, and exports information about running containers. cAdvisor exposes a web interface and can generate multiple graphs but, like Docker stats, it monitors only a single Docker host. It can be installed on a Docker machine either as a container or natively
on the Docker host itself. cAdvisor itself only retains information for 60 seconds. cAdvisor needs to be configured to log data to an external datastore. Datastores commonly used with cAdvisor data include Prometheus and
InfluxDB. While cAdvisor itself is not a complete monitoring solution, it is often a component of other monitoring solutions. Before Rancher version 1.2 (late December), Rancher embedded cAdvisor in the rancher-agent (for internal use by Rancher), but this is no longer the case. More recent versions of Rancher use Docker stats to gather information exposed through the Rancher UI because they can do so with less overhead. Administrators can
easily deploy cAdvisor on Rancher, and it is part of several comprehensive monitoring stacks, but cAdvisor is no longer part of Rancher itself.

Scout

Scout is a Colorado-based company that provides a cloud-based application and database-monitoring service aimed mainly at Ruby and Elixir environments. One of many use cases it supports is monitoring Docker containers leveraging its existing monitoring and alerting framework. We mention Scout because it was covered in previous comparisons as a solution for monitoring Docker. Scout provides comprehensive data gathering, filtering, and monitoring functionality with flexible alerts and integrations to third-party alerting services. The team at Scout provides guidance on how to write scripts using Ruby and StatsD to tap the Docker Stats
API
(above), the Docker Event API, and relay metrics to Scout for monitoring. They’ve also packaged a docker-scout container, available
on Docker Hub (scoutapp/docker-scout), that makes installing and configuring the scout agent simple. The ease of use will depend on whether users configure the StatsD agent themselves or leverage the packaged docker-scout container. As a hosted cloud service, ScoutApp can save a lot of headaches when it comes to getting a container-monitoring solution up and running quickly. If you’re deploying Ruby apps or running the database environments supported by Scout, it probably makes good sense to consolidate your Docker, application, and database-level monitoring and use the Scout solution. Users might want to watch out for a few things, however. At most service levels, the platform only allows for 30 days of data retention, and rather than being priced month per monitored host,
standard packages are priced per transaction ranging from $99 to $299
per month. The solution out of the box is not Kubernetes-aware, and
extracts and relays a limited set of metrics. Also, while docker-scout
is available on Docker Hub, development is by Pingdom, and there have
been only minor updates in the last two years to the agent component.
Scout is not natively supported in Rancher but, because it is a cloud
service, it is easy to deploy and use, particularly when the
container-based agent is used. At present, the docker-scout agent is
not in the Rancher Catalog.

Pingdom

Because we’ve mentioned Scout as a cloud-hosted app, we also need to mention a similar solution called Pingdom. Pingdom
is a hosted-cloud service operated by
SolarWinds, an Austin, TX,
company focused on monitoring IT infrastructure. While the main use case
for Pingdom is website monitoring, as a part of its server monitor
platform, Pingdom offers approximately 90 plug-ins. In fact, Pingdom
maintains
docker-scout,
the same StatsD agent used by Scout. Pingdom is worth a look because its
pricing scheme appears better suited to monitoring Docker
environments. Pricing is flexible, and users can choose between
per-server based plans and plans based on the number of StatsD metrics
collected ($1 per 10 metrics per month). Pingdom makes sense for users
who need a full-stack monitoring solution that is easy to set up and
manage, and who want to monitor additional services beyond the container
management platform. Like Scout, Pingdom is a cloud service that can be
easily used with Rancher.

Datadog

Datadog is another commercial hosted-cloud monitoring service similar to Scout and Pingdom. Datadog also provides a Dockerized agent for installation on each Docker host; however, rather than using StatsD like the
cloud-monitoring solutions mentioned previously, Datadog has developed
an enhanced StatsD called
DogStatsD. The Datadog
agent collects and relays the full set of metrics available from the
Docker API providing more detailed, granular monitoring. While Datadog
does not have native support for Rancher, a Datadog catalog entry in the
Rancher UI makes the Datadog agent easy to install and configure on
Rancher. Rancher tags can be used as well so that reporting in Datadog
reflects labels you’ve used for hosts and applications in Rancher.
Datadog provides better access to metrics and more granularity in
defining alert conditions than the cloud services mentioned earlier.
Like the other services, Datadog can be used to monitor other services
and applications as well, and it boasts a library of over 200
integrations. Datadog also retains data at full resolution for 18
months, which is longer than the cloud services above. An advantage of
Datadog over some of other cloud services is that it has integrations
beyond Docker and can collect metrics from Kubernetes, Mesos, etcd, and
other services that you may be running in your Rancher environment. This
versatility is important to users running Kubernetes on Rancher because
they want to be able to monitor metrics for things like Kubernetes pods,
services, namespaces, and kubelet health. The Datadog-Kubernetes
monitoring solution uses DaemonSets in Kubernetes to automatically
deploy the data collection agent to each cluster node. Pricing for
Datadog starts at approximately $15 per host per month and goes up from
there depending services required and the number of monitored containers
per host.

Sysdig

Sysdig is a California company that provides a cloud-based monitoring solution. Unlike some of the cloud-based monitoring solutions described so far, Sysdig focuses more narrowly on monitoring container environments including Docker, Swarm, Mesos, and Kubernetes. Sysdig also makes some of its functionality available in open-source projects, and they provide
the option of either cloud or on-premises deployments of the Sysdig
monitoring service. In these respects, Sysdig is different than the
cloud-based solutions looked at so far. Like Datadog, catalog entries
are available for Rancher, but for Sysdig there are separate entries for
on-premises and cloud installations. Automated installation from the
Rancher Catalog is not available for Kubernetes; however, it can be
installed on Rancher outside of the catalog. The commercial Sysdig
Monitor has Docker monitoring, alerting, and troubleshooting facilities
and is also Kubernetes, Mesos, and Swarm-aware. Sysdig is automatically
aware of Kubernetes pods and services, making it a good solution if
you’ve chosen Kubernetes as your orchestration framework on Rancher.
Sysdig is priced monthly per host like Datadog. While the entry price is
slightly higher, Sysdig includes support for more containers per host,
so actual pricing will likely be very similar depending on the user’s
environment. Sysdig also provides a comprehensive CLI, csysdig,
differentiating it from some of the offerings.

Prometheus


Prometheus is a popular, open-source monitoring and alerting toolkit originally built at SoundCloud. It is now a CNCF project, the company’s second hosted project after Kubernetes. As a toolkit, it is substantially different
from monitoring solutions described thus far. A first major difference
is that rather being offered as a cloud service, Prometheus is modular
and self-hosted, meaning that users deploy Prometheus on their clusters
whether on-premises or cloud-resident. Rather than pushing data to a
cloud service, Prometheus installs on each Docker host and pulls or
“scrapes” data from an extensive variety of
exporters
available to Prometheus via HTTP. Some exporters are officially
maintained as a part of the Prometheus GitHub project, while others are
external contributions. Some projects expose Prometheus metrics natively
so that exporters are not needed. Prometheus is highly extensible. Users
need to mind the number of exporters and configure polling intervals
appropriately depending on the amount of data they are collecting. The
Prometheus server retrieves time-series data from various sources and
stores data in its internal datastore. Prometheus provides features like
service discovery, a separate push gateway for specific types of metrics
and has an embedded query language (PromQL) that excels at querying
multidimensional data. It also has an embedded web UI and API. The web
UI in Prometheus provides good functionality but relies on users knowing
PromQL, so some sites prefer to use Grafana as an interface for charting
and viewing cluster-related metrics. Prometheus has a discrete Alert
Manager with a distinct UI that can work with data stored in Prometheus.
Like other alert managers, it works with a variety of external alerting
services including email, Hipchat, Pagerduty, #Slack, OpsGenie,
VictorOps, and others. Because Prometheus is comprised of many
components, and exporters need to be selected and installed depending on
the services monitored, it is more difficult to install; but as a free
offering, the price is right. While not quite as refined as tools like
Datadog or Sysdig, Prometheus offers similar functionality, extensive
third-party software integrations, and best-in-class cloud monitoring
solutions. Prometheus is aware of Kubernetes and other container
management frameworks. An entry in the Rancher Catalog developed by
Infinityworks makes getting started
with Prometheus easier when Cattle is used as the Rancher orchestrator
but, because of the wide variety of configuration options,
administrators need to spend some time to get it properly installed and
configured. Infinityworks have contributed useful add-ons including the
prometheus-rancher-exporter that
exposes the health of Rancher stacks and hosts obtained from the Rancher
API to a Prometheus compatible endpoint. For administrators who don’t
mind going to a little more effort, Prometheus is one of the most
capable monitoring solutions and should be on your shortlist for
consideration.

Heapster

Heapster is another solution that often comes up related to monitoring-container
environments. Heapster is a project under the Kubernetes umbrella that
helps enable container-cluster monitoring and performance analysis.
Heapster specifically supports Kubernetes and OpenShift and is most
relevant for Rancher users running Kuberenetes as their orchestrator. It
is not typically be used with Cattle or Swarm. People often describe
Heapster as a monitoring solution, but it is more precisely a
“cluster-wide aggregator of monitoring and event data.” Heapster is
never deployed alone; rather, it is a part of a stack of open-source
components. The Heapster monitoring stack is typically comprised of:

  • A data gathering tier – e.g., cAdvisor accessed with the
    kubelet on each cluster host
  • Pluggable storage backends – e.g., ElasticSearch, InfluxDB,
    Kafka, Graphite, or roughly a dozen
    others
  • A data visualization component – Grafana or Google Cloud
    Monitoring

A popular stack is comprised of Heapster, InfluxDB, and Grafana, and
this combination is installed by default on Rancher when users choose to
deploy Kubernetes. Note that these components are considered add-ons to
Kubernetes, so they may not be automatically deployed with all
Kubernetes distributions. One of the reasons that InfluxDB is popular is
that it is one of the few data backends that supports both Kubernetes
events and metrics, allowing for more comprehensive monitoring of
Kubernetes. Note that Heapster does not natively support alerting or
services related to Application Performance Management (APM) found in
commercial cloud-based solutions or Prometheus. Users that need
monitoring services can supplement their Heapster installation using
Hawkular, but this is not automatically
configured as part of the Rancher deployment and will require extra user
effort.

ELK Stack

Another
open-source software stack available for monitoring container environments is ELK, comprised of three open-source projects contributed by Elastic. The ELK stack is versatile and
is widely used for a variety of analytic applications, log file
monitoring being a key one. ELK is named for its key components:

  • Elasticsearch – a
    distributed search engine based on Lucene
  • Logstash – a
    data-processing pipeline that ingests data and sends it to
    Elastisearch (or other “stashes”)
  • Kibana – a visual search
    dashboard and analysis tool for Elasticsearch

An unsung member of the Elastic stack is
Beats, described by the project
developers as “lightweight data shippers.” There are a variety of
off-the-shelf Beats shippers including Filebeat (used for log files),
Metricbeat (using for gathering data metrics from various sources), and
Heartbeat for simple uptime monitoring among others. Metricbeat is
Docker-aware, and the authors provide
guidance
on how to use it to extract host metrics and monitor services in Docker
containers. There are variations in how the ELK stack is
deployed. Lorenzo Fontana of Kiratech explains in this
article

how to use cAdvisor to collect metrics from Docker Swarm hosts for
storage in ElasticSearch and analysis using Kibana. In another
article
,
Aboullaite Mohammed describes a different use case focused on collecting
Docker log files for analysis focusing on analyzing various Linux and
NGINX log files (error.log, access.log, and syslog). There are
commercial ELK stack providers such as logz.io and
Elastic Co themselves that offer “ELK as a
service” supplementing the stack’s capabilities with alerting
functionality. Additional information about using ELK with Docker is
available at https://elk-docker.readthedocs.io/. For Rancher users
that wish to experiment with ELK, the stack is available as a Rancher
Catalog entry, and a tutorial by Rachid
Zaroualli

explains how to deploy it. Zaroualli has contributed an additional
article

on how the ELK stack can be used for monitoring Twitter data. While
knowledgeable administrators can use ELK for container monitoring, this
is a tougher solution to implement compared to Sysdig, Prometheus, or
Datadog, all of which are more directly aimed at container monitoring.

Sensu

Sensu is a general-purpose, self-hosted monitoring solution that supports a variety of monitoring applications. A free Sensu Core edition is available under an MIT license, while an enterprise version with added functionality is available for $99 per month for 50 Sensu clients. Sensu uses the term client to refer to its monitoring agents, so depending on the number of hosts and application environments you are monitoring, the enterprise
edition can get expensive. Sensu has impressive capabilities outside of
container management, but consistent with the other platforms I’ve
looked at it from the perspective of monitoring the container
environment and containerized applications. The number of Sensu
plug-ins continues
to grow, and there are dozens of Sensu and community supported plug-ins
that allow metrics to be extracted from various sources. In an earlier
evaluation of Sensu on Rancher in 2015, it was necessary for the author
to develop shell scripts to extract information from Docker, but an
actively developed Docker
plug-in
is now
available for this purpose making Sensu easier to use with Rancher.
Plug-ins tend to be written in Ruby with gem-based installation scripts
that need to run on the Docker host. Users can develop additional
plug-ins in the languages they choose. Sensu plug-ins are not deployed
in their own containers, as common with other monitoring solutions we’ve
considered. (This is no doubt because Sensu does not come from a
heritage of monitoring containers.) Different users will want to mix and
match plug-ins depending on their monitoring requirements, so having
separate containers for each plug-in would become unwieldy, and this is
possibly why containers are not used for deployment. Plug-ins are
deployable using platforms like Chef, Puppet, and Ansible, however. For
Docker alone, for example, there are six separate
plug-ins

that gather Docker-related data from various sources, including Docker
stats, container counts, container health, Docker ps, and more. The
number of plug-ins is impressive and includes many of the application
stacks that users will likely be running in container environments
(ElasticSearch, Solr, Redis, MongoDB, RabbitMQ, Graphite, and Logstash,
to name a few). Plug-ins for management and orchestration frameworks
like AWS services (EC2, RDS, ELB) are also provided with Sensi.
OpenStack and Mesos support is available in Sensu as well. Kubernetes
appears to be missing from the list of plug-ins a present. Sensu uses a
message bus implemented using RabbitMQ to facilitate communication
between the agents/clients and the Sensu server. Sensu uses Redis to
store data, but it is designed to route data to external time-series
databases. Among the databases supported are Graphite, Librato, and
InfluxDB. Installing and configuring
Sensu

takes some effort. Pre-requisites to installing Sensu are Redis and
RabbitMQ. The Sensu server, Sensu clients, and the Sensu dashboard
require separate installation, and the process varies depending on
whether you are deploying Sensu core or the enterprise version. Sensu as
mentioned, do not offer a container friendly deployment model. For
convenience, a Docker image is available
(hiroakis/docker-sensu-server)
that runs redis, rabbitmq-server, uchiwa (the open-source web tier) and
the Sensu server components, but this package is more useful for
evaluation than a production deployment. Sensu has a large number of
features, but a drawback for container users is that the framework is
harder to install, configure, and maintain because the components are
not themselves Dockerized. Also, many of the alerting features like
sending alerts to services like PagerDuty, Slack, or HipChat, for
example, that are available in competing cloud-based solutions or
open-source solutions like Prometheus require that purchase of the Sensu
enterprise license. Particularly if you are running Kubernetes, there
are probably better choices out there.

The Monitoring Solutions We Missed

  • Graylog is another open-source solution
    that comes up when monitoring Docker. Like ELK, Graylog is suited to
    Docker log file analysis. It can accept and parse logs and event
    data from multiple data sources and supports third-party collectors
    like Beats, Fluentd, and NXLog. There’s a good
    tutorial

    on configuring Graylog for use with Rancher.
  • Nagios is usually viewed as better suited
    for monitoring cluster hosts rather than containers but, for those
    of us who grew up monitoring clusters, Nagios is a crowd favorite.
    For those interested in using Nagios with
    Rancher
    , some work has
    been done here.
  • Netsil is a Silicon Valley startup offering a
    monitoring application with plugins for Docker, Kubernetes, Mesos,
    and a variety of applications and cloud providers. Netsil’s
    Application Operations Center (AOC) provides framework-aware
    monitoring for cloud application services. Like some of the other
    monitoring frameworks discussed, it is offered as a cloud/SaaS or
    self-hosted.

Gord Sissons, Principal Consultant at StoryTek

Source

Local Kubernetes for Linux – MiniKube vs MicroK8s

In the previous article of this series, we described two solutions for local Kubernetes development on Windows

In this article, we will focus on Linux. Minikube is still a contender here. Unfortunately, Docker desktop is not available for Linux. Instead we are going to look at MicroK8s, a Linux only solution for a lightweight local Kubernetes cluster.

We are evaluating these solutions and providing a short comparison based on ease of installation, deployment, and management.

Minikube

Minikube runs a single-node Kubernetes cluster inside a VM (e.g. Virtualbox ) in your local development environment. The result is a local Kubernetes endpoint that you can use with the kubectl client. Minikube supports most typical Kubernetes features such as DNS, Dashboards, CNI, NodePorts, Config Maps, etc. . It also supports multiple hypervisors, such as Virtualbox, kvm, etc.

Installation

In order to install Minikube to Linux, you can follow the steps described in the official documentation. In our evaluation we used Ubuntu 18.04 LTS with VirtualBox support using the following commands:

sudo apt install virtualbox virtualbox-ext-pack //vbox requirements

wget https://storage.googleapis.com/minikube/releases/latest/minikube-linux-amd64

chmod +x minikube-linux-amd64

sudo mv minikube-linux-amd64 /usr/local/bin/minikube

After installation of Minikube, the kubectl tool needs to be installed in order to deploy and manage applications on Kubernetes. You can install kubectl by adding a new APT repository using the following command:

curl -s https://packages.cloud.google.com/apt/doc/apt-key.gpg | sudo apt-key add

echo “deb http://apt.kubernetes.io/ kubernetes-xenial main” | sudo tee /etc/apt/sources.list.d/kubernetes.list

sudo apt update

sudo apt install kubectl

Finally, after successful installation, you can start your minikube by issuing the command:

Management and Deployment

Managing a Minukube cluster on Linux is exactly the same as managing it on Windows. (See the previous article on Windows for an Nginx deployment example).

Mikrok8s

Microk8s is a new solution for running a lightweight Kubernetes local cluster. It was developed by the Kubernetes team at Canonical. It is designed to be a fast and lightweight upstream Kubernetes installation isolated from your local environment. This isolation is achieved by packaging all the binaries for Kubernetes, Docker.io, iptables, and CNI in a single snap package (available only in Ubuntu and compatible distributions).

By installing Microk8s using snap, you are able to create a “clean” deploy of the latest upstream Kubernetes on your local machine without any other overhead. The Snap tool is taking care of all needed operations and can upgrade all associated binaries to their latest versions. By default, Microk8s installs and runs the following services:

  • Api-server
  • Controller-manager
  • scheduler
  • kubelet
  • cni

Additional services such as the Kubernetes dashboard can be easily enabled/disabled using the microk8s.enable and microk8s.disable command. The list of available services are:

  1. Dns
  2. Dashboard, including grafana and influxdb
  3. Storage
  4. Ingress, Istio
  5. Registry
  6. Metrics Server

Installation

Microk8s can be installed as a single snap command, directly from the Snap store.

sudo snap install microk8s –classic

This will install the microk8s command and an api-server, controller-manager, scheduler, etcd, kubelet, cni, kube-proxy, and Docker. To avoid any conflicts with existing installation of Kubernetes, Microk8s adds a microk8s.kubectl command, configured to exclusively access the new Microk8s install. When following any generic Kubernetes instructions online, make sure to prefix kubectl with Microk8s. To verify that installation was successful, you can use the following commands to retrieve available nodes and available services respectively:

microk8s.kubectl get nodes

micro8ks.kubectl get services

Management

As mentioned above, Microk8s installs a barebones upstream Kubernetes. This means just the api-server, controller-manager, scheduler, kubelet, cni, and kube-proxy are installed and run. Additional services such as kube-dns and the dashboard can be run using the microk8s.enable command.

microk8s.enable dns dashboard

You can verify that all services are up and running with the following command:

1

2

3

4

5

6

7

8

9

10

11

12

13

14

15

16

17

18

19

20

21

22

23

24

25

26

pliakas@zouzou:~$ microk8s.kubectl get all –all-namespaces

NAMESPACE NAME READY STATUS RESTARTS AGE

kube-system pod/heapster-v1.5.2-84f5c8795f-n8dmd 4/4 Running 8 11h

kube-system pod/kube-dns-864b8bdc77-8d8lk 2/3 Running 191 11h

kube-system pod/kubernetes-dashboard-6948bdb78-z4knb 1/1 Running 97 11h

kube-system pod/monitoring-influxdb-grafana-v4-7ffdc569b8-g6nrv 2/2 Running 4 11h

NAMESPACE NAME TYPE CLUSTER-IP EXTERNAL-IP PORT(S) AGE

default service/kubernetes ClusterIP 10.152.183.1 <none> 443/TCP 12h

kube-system service/heapster ClusterIP 10.152.183.58 <none> 80/TCP 11h

kube-system service/kube-dns ClusterIP 10.152.183.10 <none> 53/UDP,53/TCP 11h

kube-system service/kubernetes-dashboard ClusterIP 10.152.183.77 <none> 443/TCP 11h

kube-system service/monitoring-grafana ClusterIP 10.152.183.253 <none> 80/TCP 11h

kube-system service/monitoring-influxdb ClusterIP 10.152.183.15 <none> 8083/TCP,8086/TCP 11h

NAMESPACE NAME DESIRED CURRENT UP-TO-DATE AVAILABLE AGE

kube-system deployment.apps/heapster-v1.5.2 1 1 1 1 11h

kube-system deployment.apps/kube-dns 1 1 1 0 11h

kube-system deployment.apps/kubernetes-dashboard 1 1 1 1 11h

kube-system deployment.apps/monitoring-influxdb-grafana-v4 1 1 1 1 11h

NAMESPACE NAME DESIRED CURRENT READY AGE

kube-system replicaset.apps/heapster-v1.5.2-84f5c8795f 1 1 1 11h

kube-system replicaset.apps/kube-dns-864b8bdc77 1 1 0 11h

kube-system replicaset.apps/kubernetes-dashboard-6948bdb78 1 1 1 11h

kube-system replicaset.apps/monitoring-influxdb-grafana-v4-7ffdc569b8 1 1 1 11h

You can access any service by pointing the correct to your browser. For example, you can access the dashboard by using the following web address, https://10.152.183.77. See image below for the dashboard:

Kubernetes dashboard

At any time, you can pause and restart all Kubernetes services and installed containers without losing any of your configurations by issuing the following command. (Note that this will also disable all commands prefixed with Microk8s.)

Removing Microk8s is very easy. You can do so by first disabling all Kubernetes services and then using the snap command to remove the complete installation and configuration files.

microk8s.disable dashboard dns

sudo snap remove microk8s

Deployment

Deploying a nginx service is what you would expect, with the addition of the Microk8s prefix:

microk8s.kubectl run nginx –image nginx –replicas 3

microk8s.kubectl expose deployment nginx –port 80 –target-port 80 –type ClusterIP –selector=run=nginx –name nginx

You can monitor your deployed services using the command:

pliakas@zouzou:~$ microk8s.kubectl get all

NAME READY STATUS RESTARTS AGE

pod/nginx-64f497f8fd-86xlj 1/1 Running 0 2m

pod/nginx-64f497f8fd-976c4 1/1 Running 0 2m

pod/nginx-64f497f8fd-r2tsv 1/1 Running 0 2m

NAME TYPE CLUSTER-IP EXTERNAL-IP PORT(S) AGE

service/kubernetes ClusterIP 10.152.183.1 <none> 443/TCP 13h

service/nginx ClusterIP 10.152.183.125 <none> 80/TCP 1m

NAME DESIRED CURRENT UP-TO-DATE AVAILABLE AGE

deployment.apps/nginx 3 3 3 3 2m

NAME DESIRED CURRENT READY AGE

replicaset.apps/nginx-64f497f8fd 3 3 3 2m

Now you are ready to access your deployed web service by pointing the following web url to your preferred web browser: http://10.152.183.125

Conclusions

After looking at all solutions, here are our results…

Minikube is a mature solution available for all major operating systems. Its main advantage is that it provides a unified way of working with a local Kubernetes cluster regardless of operating system. It is perfect for people that are using multiple OS machines and have some basic familiarity with Kubernetes and Docker.

Pros:

  1. Mature solution
  2. Works on Windows (any version and edition), Mac and Linux
  3. Multiple drivers that can match any environment
  4. Can work with or without an intermediate VM on Linux (vmdriver=none)
  5. Installs several plugins (such as dashboard) by default
  6. Very flexible on installation requirements and upgrades

Cons:

  1. Installation and removal not as streamlined as other solutions
  2. Can conflict with local installation of other tools (such as Virtualbox)

MicroK8s is a very interesting solution as it runs directly on your machine with no other VM in between.

Pros:

  1. Very easy to install, upgrade, remove
  2. Completely isolated from other tools in your machine
  3. Does not need a VM, all services run locally

Cons:

  1. Only for Ubuntu/Snap
  2. Relatively new, possible unstable
  3. Minikube can also run directly on Linux (vm=driver none), so MicroK8s value proposition is diminished

Source

Heptio Contour 0.7 Release Brings Improved Ingress Control and Request-Prefix Rewriting Support

Heptio Contour is an open source Kubernetes ingress controller that uses Envoy, Lyft’s open source edge and service proxy, to provide a modern way to direct internet traffic into a cluster. Last Friday, we released Contour version 0.7, which includes some helpful new features that you should know about if you’re evaluating options for incoming load balancing in Kubernetes.

Contour 0.7 enables:

Better traffic control within a cluster: With support for the ‘ingress.class’ annotation, you’ll now be able to specify where incoming traffic should go within a cluster. One key use case here is to be able to separate production traffic from staging and development; for example, if the ‘contour.heptio.com/ingress.class: production’ annotation is on an IngressRoute object, it will only be processed by Contour containers running with the flag ‘— ingress-class-name=production’.

Rewriting a request prefix: Need to route a legacy or enterprise application to a different path from your specified ingress route? You can now use Contour to rewrite a path prefix and ensure that incoming traffic goes to the right place without issue. (See Github for more detail on this.)

Cost savings through GZIP compression: Contour 0.7 features GZIP compression by default, so that you can see cost savings through reduced bandwidth, while speeding up load times for your customers.

Envoy health checking and 1.7 compatibility: Envoy’s now-exposed /healthz endpoint can be used with Kubernetes readiness probes, and Contour is also now compatible with Envoy 1.7, making it easier for you to get Prometheus metrics for HTTP/HTTPS traffic.

Source

5 Tips for Making Containers Faster

Take a deep dive into Best Practices in Kubernetes Networking

From overlay networking and SSL to ingress controllers and network security policies, we’ve seen many users get hung up on Kubernetes networking challenges. In this video recording, we dive into Kubernetes networking, and discuss best practices for a wide variety of deployment options.

Watch the video

One of the selling points of containers is that containerized
applications are generally faster to deploy than virtual machines.
Containers also usually perform better. But just because containers are
faster by default than alternative infrastructure doesn’t mean that
there are not ways to make them even faster. You can go beyond the
defaults by optimizing Docker container image build time, performance
and resource consumption. This post explains how.

Defining “Faster”

Before we delve into Docker optimization tips, let me first explain what
I mean when I write about making containers “faster.” Within the context
of a conversation about Docker, the word faster can have several
meanings. It can refer to the execution speed of a process or an
application that runs inside a container. It can refer to image build
time. It can refer to the time it takes to deploy an application, or to
push code through the entire delivery pipeline. In this post, I’ll
consider all of these angles by discussing approaches to making Docker
faster in multiple ways.

Make Docker Faster

The following strategies can help make Docker containers faster.

Take a Minimalist Approach to Images

The more code you have inside your image, the longer it will take to
build the image, and for users to download the image. In addition,
code-heavy containers may run sub-optimally because they consume more
resources than required. For all of these reasons, you should strive to
keep the code that goes into your container images to the bare minimum
that is required for whatever your image is supposed to do. In some
cases, designing minimalist container images may require you to
rearchitect your application itself. Bloated applications will always
suffer from slow deployment and weak performance, whether you deploy
them in containers or in something else. You should also resist the
temptation, when writing your Dockerfile, to add services or commands
that are not strictly necessary. For example, if your application
doesn’t need an SSH server, don’t include one. For another example,
avoid running apt-get upgrade if you don’t need to.

Use a Minimalist Operating System

One of the greatest benefits of containers as compared to virtual
machines is that containers don’t require you to duplicate an entire
operating system to host an application. To take advantage of this
feature to greatest effect, you should host your images with an
operating system that does everything you need, and nothing more. Your
operating system shouldn’t include extra services or data if they do not
advance the mission of your Docker environment. Anything extra is bloat,
which will undercut the efficiency of your containers. Fortunately, you
don’t have to build your own minimalist operating system for Docker.
Plenty of pre-built Linux distributions with small footprints are
available for hosting Docker, such as
RancherOS.

Optimize Build Time

Image build time is often the biggest kink in your continuous delivery
pipeline. When you have to wait a long time for your Docker images to
build, you delay your entire delivery process. One way to speed image
build time is to use registry mirrors. Mirrors make builds faster by
reducing the amount of time required to download components when
building an image. Combining multiple RUN commands into a single command
also improves build time for images because it reduces the number of
layers in your image, which improves build speed, and optimizes the
image size to boot. Docker’s build cache
feature

is another useful way to improve build speed. The cache allows you to
take advantage of existing cached images, rather than building each
image from scratch. Finally, creating minimalist images, as discussed
above, will speed build time, too. The less you have to build, the
faster your builds will be.

Use a Containers-as-a-Service Platform

For staff at many organizations, the greatest obstacle to deploying
containers quickly and efficiently results from the complexity of
building and managing a containerized environment themselves. This is
why using a Containers-as-a-Service platform, or CaaS, can be handy.
With a CaaS, you get preconfigured environments, as well as deployment
and management tools. A CaaS helps to prevent the bottlenecks that would
otherwise slow down a continuous delivery chain.

Use Resource Quotas

By default, each container can consume as many resources as it wants.
This may not always be ideal because poorly designed or malfunctioning
containers can eat up resources, thereby making other containers run
slowly. To help prevent this problem, you can set
quotas
on
each container’s compute, memory and disk I/O allotments. Just keep in
mind, of course, that misconfigured quotas can cause serious performance
problems, too; you therefore need to ensure that your containers are
able to access the resources they require.

Conclusion

Even if your containers are already fast, you can probably make them
faster. Optimizing what goes into your images, improving image build
time, avoiding operating system bloat, taking advantage of CaaS and
setting resource quotas are all ways to improve the overall speed and
efficiency of your Docker environment.

Source